


Abstract
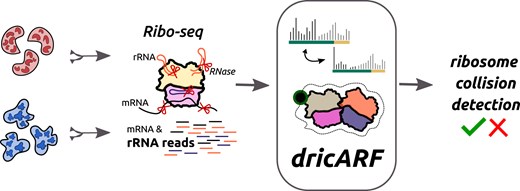
It has become clear in recent years that ribosomes regularly stall during translation. Such translation impairment has many causes, including exposure to ribotoxic stress agents, the presence of specific RNA structures or sequences, or a shortage of amino acids or translation factors. If they are not resolved, stalled ribosomes can lead to ribosome collisions that are continuously surveilled by various sensor proteins. This in turn initiates a cascade of signalling events that can change the physiology and behaviour of cells. However, measuring changes in collision abundance has proved challenging, and as a result, the importance of collision-mediated biological responses is still unclear. Here, we show that computational analyses of standard ribosome profiling (Ribo-seq) data enable the prediction of changes in ribosome collisions between conditions. This is achieved by using the known 3D structure of collided ribosomes to define the ribosomal RNA (rRNA) positions that are differentially digested by RNases during the Ribo-seq protocol. Comparison of the relative rRNA reads at these positions allows the relative quantification of collisions between samples, an approach we call differential ribosome collisions by Analysis of rRNA Fragments (dricARF). When applied to public datasets across multiple organisms, our approach detects changes in collision events with unprecedented accuracy and sensitivity. In addition to providing supplementary evidence for ribosome collisions, our tool has the potential to uncover novel biological processes that are mediated by them. dricARF is available as part of the ARF R package and can be accessed through https://github.com/fallerlab/ARF.
Introduction
During their life cycle, cells experience different environments that cause stress on the RNA translation machinery. These include limited availability of amino acids or translation factors, exposure to ribotoxic stress agents, and/or conditions that cause messenger RNA (mRNA) and/or translation factor defects. Under such conditions, the RNA translation process slows down and can even cause ribosomes to stall on mRNA [1]. When such ribosomal stalling persists, it leads to ribosome collision and queuing events [2].
In recent years, the detection and quantification of ribosome stalling and/or collision events has gained a lot of interest, with the discoveries of surveillance mechanisms that constantly monitor cells for such events. It has been shown that several different sensor proteins are responsible for this surveillance, each initiating a cascade of different signalling events [3]. For example, EDF1 is recruited to collided ribosomes and initiates a negative feedback loop to downregulate translation [4, 5], while ZAKα (which is also recruited to collided ribosomes) drives context-dependent signalling via effectors such as p38, JNK, GCN2, and SRC [6–9]. Another well-known sensor is ZNF598, a ubiquitin ligase that modifies several ribosomal proteins, resulting in inhibited translation and degradation of the nascent chain [10–15]. Activation of each sensor can have significant physiological consequences, with ZAKα in particular being implicated in a number of key biological processes, including metabolic ageing and intestinal stress responses [9, 16].
Despite the significant role they play in cellular physiology and behaviour, providing direct quantitative or qualitative evidence for changes in the abundance of ribosome collisions has posed a challenge to the field. While it is possible in some cases to detect strong stalls, as a precursor for ribosome collisions, in ribosome profiling (Ribo-seq) data, direct evidence is usually provided using the laborious polysome fractionation technique [8, 17–19]. In this technique, after soluble cell lysates are made from cells of interest, they are treated with an RNase, which digests mRNA-bound polysomes into individual units, such as monosome, disome, trisome, etc. These units are then fractionated using sedimentation in a sucrose gradient, and the relative abundance of collisions is assessed by comparing the peaks corresponding to each of these fractions. However, this is a technically challenging procedure, which limits its use as an exploratory approach for uncovering the extent of collision-mediated biological processes. Moreover, in several cases, researchers have been unable to show an increase in collisions, despite the activation of associated surveillance pathways [16, 20]. This may be due to the technical limitations of the approach, the resolving of collided ribosomes, or the splitting of collided ribosomes during RNase digestion. Regardless of the answer, it is clear that orthogonal approaches are needed.
To tackle this issue, we developed a bioinformatic approach to show that changes in the abundance of ribosome collisions can be detected through computational analysis of ribosomal RNA (rRNA) fragments generated by standard Ribo-seq experiments. Similar to our recently published ribosome heterogeneity prediction method, dripARF [21], this involves differential analysis of rRNA reads between conditions, followed by enrichment tests on sets of rRNA positions that act as a proxy for changes in the abundance of ribosome collision. To create such sets, we assumed that the RNase digestion of rRNA in higher-order structures (disomes, trisomes, etc.) will differ at specific positions in trailing and/or leading ribosomes, and these positions would be a source of rRNA read abundance differences. By analysing the 3D structure of disomes [22–24] and trisomes [25], we calculated the solvent accessibility differences between trailing and leading ribosome structures, and identified the rRNA positions that would be differentially digested. Using enrichment tests, we could then mine publicly available datasets and use this information to accurately predict changes in the abundance of these structures with unprecedented accuracy and sensitivity.
This tool not only offers supplementary evidence for ribosome collisions, but also serves as a platform to further our comprehension of ribosome biology. We use it to confirm, for example, that amino acid deprivation can cause ribosome collisions in the short term and that ZAKα phosphorylation may not be a reliable marker of collisions. This approach has the potential to open up new avenues for discovering novel biological mechanisms facilitated by ribosome collisions.
Materials and methods
dricARF method
We have developed and implemented the differential ribosome collisions by Analysis of rRNA Fragments (dricARF) differential ribosome collision prediction method building upon our previously published dripARF pipeline for predicting differential ribosome heterogeneity [21]. Both methods operate on the premise that during RNase digestion in Ribo-seq protocols, heterogeneous ribosomes undergo varied rRNA degradation. For prediction of ribosomal protein (RP)-mediated ribosome heterogeneity, dripARF expects the changes in sequenced rRNA fragments specifically in the vicinity of stoichiometric RPs. Therefore, in line with this idea, dripARF interprets the rRNA fragment differences within the ribosome heterogeneity space by performing Gene Set Enrichment Analysis (GSEA)-like enrichment tests, utilizing the position-specific differential rRNA abundance data and RP-specific rRNA position sets. In dripARF, these sets are determined by identifying which rRNA positions are in contact with which RPs within the 3D structure of the ribosome. With this approach, it discerns RPs as potential candidates for ribosome heterogeneity across Ribo-seq samples.
For the development of dricARF, we similarly hypothesized that differences in ribosome collision abundance between Ribo-seq samples would result in detectable biases in produced rRNA fragments as well. These biases would stem from RNase digestion variations between trailing and leading ribosomes in collision state. For instance, collided ribosomes are thought to be resistant to splitting by RNase digestion; therefore, the collision interface shields not only the mRNA but also specific rRNA regions from RNase digestion. Furthermore, different conformations of leading and trailing ribosomes in a collision state should introduce additional digestion biases in other rRNA positions as well. To create a comprehensive rRNA position set covering all potential rRNA fragment changes, we structurally analysed four published disome and trisome structures from the PDB, including the human disome structure 7QVP [22], two yeast disome structures 6I7O [23] and 6T83 [24], and one yeast trisome structure 6SV4 [25].
In our structural analysis (see Fig. 1), we first modelled the accessibility of rRNA positions to RNase digestion using solvent-accessible surface area (SASA) calculations. Subsequently, through differential analysis of SASA measures in leading and trailing ribosomes, we identified rRNA positions most likely affected by RNase digestion differences. This resulted in four structure-specific collision-associated rRNA position sets. To enable collision predictions in human, mouse, and yeast organisms, we then lifted over these sets using rRNA sequence alignments, employing our previously published methodology [21]. With a few further implementation improvements in the ARF R package, we created the independent dricARF function that integrates dripARF with collision sets for predicting differential ribosome collisions in human, mouse, and yeast. Ultimately, this function combines the differential analysis of rRNA read abundances at each rRNA position and performs the enrichment tests on all collision- and heterogeneity-associated rRNA position sets, reporting which sets are more enriched for rRNA read differences between given two conditions.
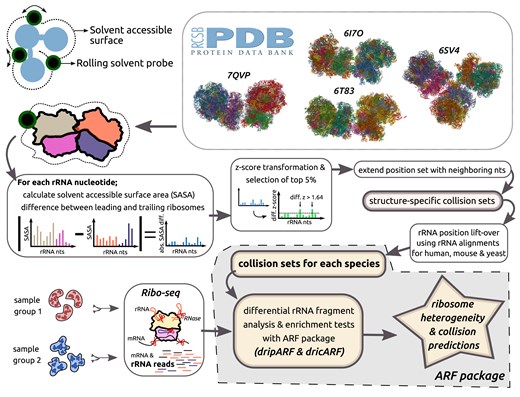
Schematic representation of the dricARF differential ribosome collision prediction pipeline. Collision-associated rRNA position sets are determined through the solvent accessibility analysis of several different PDB ribosome structures in disome/trisome state. This is later fed into the ARF package, and by quantitative analysis of rRNA fragment differences between Ribo-seq performed samples and their enrichment in collision sets, ribosome collision predictions are reported together with dripARF ribosome heterogeneity candidates.
SASA-based RNase accessibility analysis
For each structure, solvent accessibility calculations were performed using the measure sasa command in UCSF ChimeraX (version 1.3) [26]. To better represent RNase accessibility on rRNA molecules, we set the probe radius of the solvent to 10 Å, approximately the average radius of an RNase I molecule. Given the use of different RNase enzymes in Ribo-seq protocols under varying conditions and species, we decided on employing a fixed radius for the solvent for practicality. Additionally, we analysed how SASA measures change for other radius sizes (1.4, 5, and 20), which indicated minimal variation (see Supplementary Fig. S1).
Creating structure-specific collision sets
To identify the rRNA positions that have differential RNase accessibility within leading and trailing ribosomes, we employed the following approach for each collision structure. First, we calculated the absolute SASA difference across the same rRNA position in leading and trailing ribosomes. For the trisome structure, this is calculated as |max(SASA) − min(SASA)| at each rRNA position to consider SASA values from all three ribosomes. Next, we z-transformed the differential SASA measures and included each position with a z-score >1.64 in the collision set. This ensures that these positions exhibit the top 5% differential accessibility to RNase digestion on these ribosomes, thus expected to produce differential rRNA fragments. Considering that this digestion would also impact the sequencing of immediately neighbouring rRNA fragments, we further extended this set to include immediate nucleotides (1 nt in each direction) as well. To be able to use the four structure-specific sets in other organisms, we lifted over the rRNA positions to human, mouse, and yeast coordinates. Lastly, to enhance the robustness of our ribosome collision predictions for each organism, we created the ribosome collision (Rib.Col.) set by taking the union of all lifted over sets for that organism.
Defining the collision interface
In addition to our SASA-based structural analysis, we also defined the collision interface in disome formations using the following approach. For each rRNA position in both the leading and trailing ribosomes, we first measured the minimum distance to every rRNA and RP in the other ribosome. By filtering the lowest 5% of these distance measures, we identified the rRNA positions closest to the other ribosome. We then extended these positions by 1 nt bidirectionally to create our final collision interface sets that are specific to the analysed structure. For their use in all three organisms, these sets have been lifted over and joined together to form the comprehensive collision interface (Col.Int.) set by taking the union of all lifted over sets for that organism.
dricARF implementation in ARF
The dricARF method is implemented as part of the ARF R package, leveraging all functionalities of the previously released dripARF pipeline. Consequently, the dricARF function performs differential ribosome collision predictions alongside ribosome heterogeneity predictions. Enrichment results for the four structure-specific collision sets and the union Rib.Col. set represent the differential ribosome collision prediction outcomes, whereas results for Col.Int. are given as extra information. All results are reported as three enrichment scores: ES1, ES2, and RPSEA.padj. These scores come from our rRNA position set enrichment analysis (RPSEA), an enrichment test similar to the popular GSEA method. In RPSEA, rRNA positions are treated like genes, and their differential abundance is represented by logFC measure and adjusted P-values across given conditions. Based on the ranking of these positions using the abs(logFC)*max(−log10(adjP), 5) measure, we perform a unidirectional GSEA, where predefined rRNA position sets are treated as gene sets. Focusing on the results of this test, ES1 represents the normalized enrichment score (NES), RPSEA.padj denotes the adjusted P-value of the test, and ES2 indicates the deviation of ES1 from the enrichment of randomized background sets. These background sets (n= 100) are generated separately for each predefined rRNA position set by shifting the positions linearly across rRNAs, while preserving their size and connectedness. This linear shift approach ensures that, within the randomized background sets, several rRNA positions are immediately connected as well, just as is the case for given predefined sets. ES1 scores of the original and randomized background sets are then z-transformed to compute the ES2 score for the original set. Higher values for both ES1 and ES2 reflect greater confidence in the predictions. In dricARF, RPSEA.padj is evaluated using a significance threshold of 0.05. However, as suggested by dripARF, ES2 facilitates more precise comparison across datasets, with a value of 1 serving as a prediction confidence threshold, indicating one standard deviation increase from the mean ES1 score of randomized background sets for the original set. Additional information about the approach and its implementation details can be found in [21].
Public Ribo-seq datasets
For the benchmark and example application purposes of dricARF, we downloaded 14 different Ribo-seq datasets via the NCBI SRA platform, using their dataset-specific accession IDs. These datasets are summarized in Table 1, which outlines their accession IDs, the researched organisms, and the rationale for their inclusion. For each dataset, adapter trimming of raw reads was conducted using the cutadapt tool [35]. This was done using dataset-specific adapter sequences. Trimmed reads from all datasets were subsequently mapped to rRNA sequences using the TopHat aligner [36] and species-specific rRNA sequences provided by the ARF package.
Summary of the ribosome profiling datasets included in this paper
| GEO ID | Species | Inclusion reason | Reference |
|---|---|---|---|
| GSE114794 | Human | AA depletion [C: Cys, Q: Glu, BCAA (I: Ile, L: Leu, V: Val)] | [27] |
| GSE115161 | Human | AA depletion (G: Gln) | [24] |
| GSE125086 | Human | Control comparison | [28] |
| GSE141459 | Human | UV treatment and selective Ribo-seq (collision sensor ZAKα pull-down) | [8]a |
| GSE136091 | Mouse | Control comparison | [29] |
| GSE180208 | Mouse | mTOR complex inhibition (Rptor KO), collision sensor ZAKα activation | [9] |
| GSE205191 | Mouse | AA depletion (L: Leu), collision sensor ZAKα activation | [30] |
| GSE235700 | Mouse | HFHS diet (increased ROS), collision sensor ZAKα activation | [16] |
| GSE58321 | Yeast | Translation inhibitors (CHX, ANI, 3AT) | [31] |
| GSE128578 | Yeast | Control comparison | [32] |
| GSE156535 | Yeast | Selective Ribo-seq (collision sensor Hel2 pull-down) | [33] |
| GSE158572 | Yeast | Translation inhibitor (3AT) | [19]a |
| GSE189404 | Yeast | Synthetic collision-inducing reporters and KD of ribosome collision sensor Hel2 | [34]a |
aThese studies include Ribo-seq data for conditions with direct evidence of increase in persistent, RNase-resistant ribosome collisions (disomes).
Results
Development of collision-associated rRNA position sets and dricARF
To enable the prediction of differential ribosome collisions, we created collision-associated rRNA position sets (see Fig. 1). If the abundance of collisions changed between conditions, these sets represented the positions with expected changes in Ribo-seq rRNA reads. To create these sets, we focused on four published disome or trisome structures using SASA calculations (one human [22] and three yeast [23–25]; see the ‘Materials and methods’ section), and identified the rRNA positions whose accessibility to RNase digestion differed on the leading and trailing ribosomes. This provided an rRNA position set for each of those structures. As illustrated in Fig. 2, all structure-specific collision sets consist of 100–300 positions (lifted over for yeast). We then combined these sets to generate the Rib.Col. set, which is notably bigger, as it represents the union of structure-specific sets. We also generated an additional set using only rRNA residues that are in the interface between the leading and trailing ribosomes, which we named Col.Int. Notably, positions included in the Rib.Col. set were dispersed across various parts of the ribosome (see Supplementary Fig. S2), due to conformational differences between leading and trailing ribosomes within collision structures. Overlapping the Rib.Col. and Col.Int. sets showed that roughly 50% (yeast) and 30% (human) of residues in the collision interface were included in the Rib.Col. set, suggesting that despite collided ribosomes being resistant to RNase-mediated splitting, significant digestion still might occur in the interface. This analysis also showed that the overlap between the Rib.Col. and Col.Int. sets was higher in yeast disome structures compared to human. Potential reasons for this could be the structural differences between ribosomes across species.
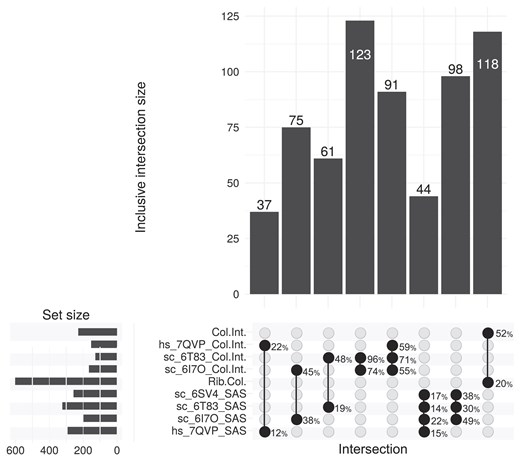
Overlap statistics between collision-associated rRNA position sets derived from structural analysis of different ribosome structures in the collision state. Sets are lifted over for yeast, and set sizes are given in the top bar plot for the intersections marked below. Left bar plot summarizes the set sizes for rRNA position sets generated with this study, whereas the overlap percentages are shown to the right of the highlighted intersections. The PDB IDs of the analysed structures are included within their respective set IDs, with Rib.Col. and Col.Int. sets representing the union of same type sets.
By integrating the collision-associated rRNA position sets with the dripARF method [21], we created the dricARF ribosome collision prediction pipeline. When applied to Ribo-seq datasets, dricARF analyses the differential abundance of rRNA fragments for each selected pairwise condition comparison and tests whether these changes are enriched in the predefined rRNA position sets using various enrichment tests. Our primary GSEA-like RPSEA enrichment test ranks rRNA positions according to differential rRNA abundance levels and evaluates the rank distribution of rRNA positions within predefined rRNA position sets. Three enrichment scores are produced from this test, ES1 representing the NES for the associated set, RPSEA.padj denoting the adjusted P-value of the test, and ES2 showing the deviation of ES1 from background noise. Although GSEA P-values are calculated by randomizing the tested sets as part of the analysis, this randomization does not account for the connectedness of predefined rRNA position sets. We introduced the ES2 score to address this specific issue, comparing the ES1 against controlled background sets tailored to each predefined rRNA set, ensuring a more accurate evaluation of ES1 enrichment scores. Following the criteria of the dripARF method, the dricARF method identifies an abundance change in ribosome collisions between two conditions, when the ES2 score for the Rib.Col. set is above a value of 1, which represents a one standard deviation increase in ES1 compared to the mean enrichment observed in controlled background sets. Ideally, this occurs alongside RPSEA.padj score <0.05, although this P-value threshold is not necessarily required. We further discuss the impact of various threshold choices on the accuracy of dricARF in subsequent sections.
Accurate ribosome collision predictions with dricARF
To evaluate the specificity and sensitivity of dricARF predictions, we selected 14 comparisons where the relative abundance of collided ribosomes in the cellular ribosome pool is expected to change and 5 control comparisons for which no changes are expected (see Table 2). These comparisons came from five independent datasets for benchmark comparisons and five for control comparisons. Two datasets contained comparisons for both cohorts.
Summary of relevant comparison groups for ribosome collision predictions performed in this paper
| Group | GEO ID | Species | Included comparisons |
|---|---|---|---|
| Extended benchmark | GSE141459 | Human | Hela_Unt vs Hela_UV |
| GSE158572 | Yeast | Mono_Ctrl vs Mono_3AT | |
| GSE58321 | Yeast | CTRL vs ANI; CTRL vs M10_3AT; CTRL vs M60_3AT | |
| GSE156535 | Yeast | Input.cyto vs Hel2_IPed.cyto; SRP72p.Input.cyto vs SRP72p.Hel2_IPed.cyto; GIT1p.Input.cyto vs GIT1p.Hel2_IPed.cyto | |
| GSE189404 | Yeast | wt_opt_mono vs wt_cga_mono; wt_opt_mono vs hel2_cga_mono; wt_opt_mono vs syh1_cga_mono; wt_cga_mono vs hel2_cga_mono; wt_cga_mono vs syh1_cga_mono; hel2_cga_mono vs syh1_cga_mono | |
| Control comparisons | GSE125086 | Human | Veh vs Treat_15m (high-dose CHX) |
| GSE136091 | Mouse | liver_control vs liver_eEF2_kd_7days | |
| GSE128578 | Yeast | WT.0hr vs eS7_WT.0hr | |
| GSE58321 | Yeast | CTRL vs CHX (t=0) | |
| GSE189404 | Yeast | wt_opt_mono vs wt_non_mono | |
| Amino acid depletion | GSE114794 | Human | EtOH_Ctrl_04hr vs EtOH_NoCys_04hr; EtOH_Ctrl_04hr vs EtOH_NoQ_04hr; EtOH_Ctrl_04hr vs EtOH_NoG_04hr; EtOH_Ctrl_30min vs EtOH_NoQ_30min; TAM_Ctrl_30min vs TAM_NoQ_30min; EtOH_Ctrl_04hr vs EtOH_NoBCAA_04hr; TAM_Ctrl_04hr vs TAM_NoBCAA_04hr |
| GSE115161 | Human | HeLa WT vs Gln depletion | |
| GSE205191 | Mouse | WT_Leu_Def vs WT_Std | |
| RSR activation & ZAKα phosphorylation | GSE141459 | Human | Hela_Unt vs Hela_UV, Hela_mock_IP vs Hela_ZAK_IP |
| GSE180208 | Mouse | SCenr vs RptorKO | |
| GSE205191 | Mouse | WT_Leu_Def vs WT_Std | |
| GSE235700 | Mouse | Mono_Chow vs Mono_HFHS; Disomes_Chow vs Disomes_HFHS |
In the first dataset, Ribo-seq was performed in yeast cells with different genetic backgrounds expressing different collision-inducing and control constructs [34]. We initially compared two cell lines, both expressing a reporter construct inducing ribosome collisions on repeated CGA codons, but one line was deficient in syh1-mediated mRNA decay. As this cell line cannot degrade the mRNAs translated by collided ribosomes (and thus cannot resolve the collision), an increased presence of collisions is expected in these cells. As shown in Fig. 3A, dricARF strongly predicts collisions in this comparison, with an ES2 score >1 and a RPSEA.padj value <0.05. Additionally, ES2 score of Rib.Col. set was higher than almost all heterogeneity predictions (generated with dripARF). Similarly, when comparing the same syh1-deficient collision-induced cells to wild-type WT cells not expressing the collision-inducing construct, dricARF again reports strong collision predictions as expected. Collisions were also induced in this study by the depletion of Hel2. As in the case of Syh1, Hel2 deficiency will prevent the resolving of ribosome collisions, and thus result in an increase of their abundance. Indeed, dricARF correctly identifies this change (Fig. 3A) and changes in other relevant comparisons (Supplementary Fig. S3).
To assess the sensitivity of dricARF when different Ribo-seq protocols are used, we analysed a dataset where authors performed selective ribosome profiling using Hel2 immunoprecipitation (IP) in yeast cells [33]. As Hel2 is known to bind to collided ribosomes, Ribo-seq from this IP is expected to be enriched for disomes, compared to standard Ribo-seq data in the same cell line. As expected, dricARF correctly predicts ribosome collisions in this scenario with a very high ES2 score (Fig. 3B).
It is well known that certain compounds can induce ribotoxic stress response. For example, 3AT inhibits histidine biosynthesis, inducing ribosome stalling and collisions on histidine codons. The recently developed Disome-seq method has provided direct evidence for such collisions under such treatment in yeast cells [19]. When analysing the standard (monosome) Ribo-seq part of this dataset, dricARF successfully predicts ribosome collisions with an ES2 score >1 (Fig. 3C). Similarly, collisions are predicted in an independent dataset [31] in which both 3AT and anisomycin treatments are used to stall ribosomes (Supplementary Fig. S4).
These data show that dricARF can accurately predict a change in the abundance of collisions in yeast cells. To test this in a different organism, we analysed a dataset generated in human cells, wherein Ribo-seq was performed in UV-treated HEK293 cells [8]. Importantly, direct evidence for changes in ribosome collisions is provided in the original publication, via polysome fractionation. In fitting with this, dricARF also predicts a change in collisions between UV-treated and untreated cells, with an ES2 score >1, although the RPSEA.padj is non-significant (something that is discussed below) (Fig. 3D).
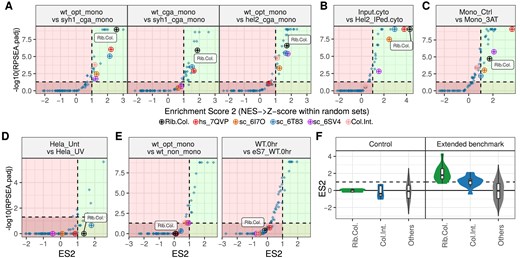
Benchmarking results for dricARF. In our analyses with various Ribo-seq datasets (A–D), collision-associated sets are among the top enriched across comparisons expected to have an abundance change in ribosome collisions. In these plots, axes represent the enrichment scores ES2 and RPSEA.padj, with higher values indicating stronger predictions. Dashed lines indicate the default dricARF thresholds for enrichment tests, with suggested high-confidence regions on the right of the dashed vertical line (highlighted in green) and low-confidence regions on the opposite side (highlighted in red). Each point represents the enrichment result for a different rRNA position set, whether it is collision- or heterogeneity-associated. (E) Collision predictions are below the threshold levels across two example control comparisons where collision abundances are not expected to change. (F) Violin plots show the distribution of ES2 prediction scores across all extended benchmark and control comparisons. Values are given separately for Rib.Col. and Col.Int. rRNA position sets, whereas all heterogeneity-related prediction scores are given together (Others).
To generate an overview of the sensitivity and specificity of dricARF, we plotted two examples from our control comparisons (Fig. 3E) and the distribution of ES2 scores across the benchmark datasets (Fig. 3F and Table 2). In datasets where collisions are expected, predictions of collisions are strongly enriched, with an ES2 score of above 1 for Rib.Col. set in all comparisons except for one. On the other hand, this score was <1 in all our control comparisons. We also plotted the ES2 scores of our set that is based on the Col.Int., and this showed much weaker enrichment, demonstrating the improved accuracy of our SASA-based approach (Fig. 3F and Supplementary Fig. S5). Taken together, our comprehensive benchmarks with disparate datasets suggest that dricARF is a reliable tool for predicting changes in ribosome collision abundance across Ribo-seq experiments.
Evaluation of selected dricARF thresholds
For dricARF to predict a change in collision abundance, it is ideal for the Rib.Col. set to have ES1 and ES2 scores as high as possible and RPSEA.padj value as low as possible. However, for practical use of dricARF, we suggest applying confidence thresholds when suggesting significant change in ribosome collision abundances between compared conditions. Despite being arbitrarily selected values, these thresholds are derived from statistical analyses and represent significant differences from background enrichment levels. Specifically, an ES2 score >1 for the Rib.Col. set is recommended as the primary dricARF threshold, as ES2 score is designed to address not only the known set-size bias of the GSEA method, but also the connectedness bias of rRNA positions within predefined rRNA position sets. RPSEA.padj value can be evaluated using the threshold value of 0.05; however, due to the biases known to exist in these measures, we recommend that ES2 be used for the prediction of collision abundance changes. As can be seen in Fig. 4A and 3D, strict adherence to the RPSEA.padj threshold increases the likelihood of false negatives in dricARF predictions. We have highlighted this in the dricARF output by colouring the quadrants of the graphs, with the area with an ES2 score above 1 in green, regardless of whether the RPSEA.padj is below 0.05.
Assessment of the rRNA read depth required for accurate dricARF function
Recent advancements in rRNA depletion protocols have significantly increased the number of mRNA reads in Ribo-seq experiments [37–40]. However, these methods may reduce the complexity of informative rRNA read fragments, potentially challenging the accuracy of dricARF predictions. To address this, we set out to determine the minimum rRNA read requirements using a read sampling approach in our benchmarking datasets. Since rRNA read depths were >5 million across all samples, we sampled reads in varying amounts between 10 000 and 5 million. To assess the accuracy of dricARF at each depth, we performed 100 rounds of independent random rRNA read sampling, followed by dricARF predictions. As can be seen in Fig. 4B, the interquartile range (IQR) of ES2 scores for the Rib.Col. set remained above the threshold value of 1 in benchmark comparisons and below it in control comparisons, even with rRNA read depth as low as 500 000. These results indicate that dricARF can still yield reliable and informative results in Ribo-seq experiments with high levels of rRNA depletion.

(A) Heatmap shows the dricARF results for control and benchmark comparisons (columns) using the two different thresholds (rows). (B) ES2 score distributions of the Rib.Col. set are given separately for benchmark and control datasets (rows), when they are sampled independently (100 times) with the rRNA read depth given on the x-axis.
Amino acid deprivation causes ribosome collisions
Ribosome stalling is known to occur due to the lack of amino acids [8, 30, 41]. Amino acid deprivation is usually sensed through uncharged tRNAs, and the mTORC1 and GCN2 signalling pathways, resulting in reduction of translation via eIF2α phosphorylation [42]. To test whether such stalling events can also cause ribosome collisions, we analysed a Ribo-seq dataset where glutamine was depleted for either 30 min or 4 h. Interestingly, dricARF predicted a change in collisions at the 30 min time point, but not the 4 h one (Fig. 5A, left two panels), hinting at potential resolution of collisions through glutamine synthesis or activation of other stress pathways.
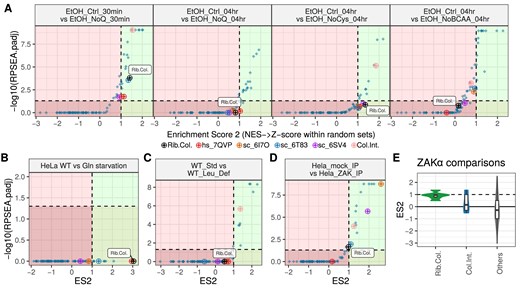
Ribosome collision prediction results across various Ribo-seq datasets with amino acid depletion versus control comparisons (A–C). In these plots, both axes represent the enrichment scores, with higher values indicating stronger predictions. Each point represents the enrichment result for a different rRNA position set whether it is collision- or heterogeneity-associated. (D) Violin plots show the distribution of ES2 prediction scores across various datasets focusing on comparisons with ZAKα activation, a sensor for ribotoxic stress response. Values are given separately for Rib.Col. and Col.Int. rRNA position sets whereas all heterogeneity-related prediction scores are given together (Others). (E) Collision prediction with dricARF in a dataset with ZAKα-bound Ribo-seq versus control Ribo-seq suggests a differential abundance of collisions between the two conditions.
The same dataset contained Ribo-seq following 4 h depletion of either cysteine or all branched-chain amino acids (BCAAs: I, L, and V). While a change in collision abundance was predicted for cysteine depletion, it was not for BCAA depletion (Fig. 5A, right two panels). In the study, the authors showed that this had the largest effect on overall protein synthesis of the conditions tested, suggesting that there may be a complete translational shutdown before collisions occurred. The same study also included amino acid depletions after oncogenic mutation (SRC deletion) and showed similar results (Supplementary Fig. S6).
Finally, analysis of another study in which glutamine was depleted in the HeLa cell line [24] showed that collisions were also predicted following withdrawal of this amino acid (Fig. 5B).
ZAKα phosphorylation is not always associated with a detectable change in collisions
Recent studies have shown that amino acid deprivation can also be sensed and responded to through alternative mechanisms [41], such as the Ribosome-associated Quality Control (RQC) and Ribotoxic Stress Response (RSR) pathways. For example, a recent study reported the activation of the RSR pathway (as assessed by ZAKα phosphorylation) in mice with a leucine-deficient diet [16]. However, despite ZAKα phosphorylation being considered a marker of ribosome collisions [8], the authors were unable to demonstrate an increase in collisions using established assays, and suggest that, in this case, ZAKα is being phosphorylated in the absence of collisions. We analysed their data using dricARF and did not predict a change in ribosome collisions, supporting this conclusion (Fig. 5C).
This observation motivated us to perform collision predictions in publicly available Ribo-seq datasets with reported ZAKα activation. For this, we used dricARF to analyse six comparisons across four datasets. Surprisingly, we only predicted collisions in one of these comparisons: UV-mediated activation of ZAKα (Fig. 3D). We also compared data from ZAKα-selective Ribo-seq, following ZAKα IP [8], which did give a prediction of differential collision abundance in ZAKα-associated ribosomes (Fig. 5D). While it is difficult to draw conclusions from the numerical value of ES2 (given that we have set the collision prediction at an arbitrary threshold of 1), it is worth noting that all other comparisons gave ES2 scores that were approaching 1, but did not cross that threshold (summarized in Fig. 5E). It may be the case that ZAKα activation either does not necessarily require a high level of collisions or perhaps that activation results in the resolution of collisions, and therefore a weaker prediction of collisions than would be expected.
Discussion
In recent years, ribosome collisions have been shown to play an important role in defining cell fate [5, 8, 9, 16, 43]. Despite their obvious importance, the study of collided ribosomes has been hampered by the difficulties faced when detecting them. In particular, no methods are available for exploratory analysis, and, as a result, our knowledge of their role in biology is limited.
To overcome this, we developed dricARF, a bioinformatic method that combines collision-associated rRNA position sets with the dripARF method. dricARF allows the identification of changes in the abundance of ribosome collisions in standard Ribo-seq data. The specificity and sensitivity of our method were validated through comparisons involving different genetic backgrounds, collision-inducing constructs, and treatments known to induce ribosome stalling and collisions. Other methods (such as disome-seq and polysome fractionation following RNase treatment) are dedicated to the analysis of collisions, and thus need the prior prediction of changes in collisions between conditions. dricARF does not need such prior knowledge, and thus can identify changes in situations where they are not necessarily expected. This fundamentally different approach adds a much needed tool to the ribosome collision field and opens the field considerably to new areas of research. Including dricARF in standard Ribo-seq analysis pipelines will provide this information to anyone carrying out this experiment, yielding additional key insights.
Importantly, however, dricARF can also be applied retrospectively, on previously published data, provided the raw, unprocessed data are available. For example, here we provide further support for the idea that amino acid deprivations can lead to ribosome collisions in the short term; however, these collisions get resolved over time. We also provide evidence that ZAKα phosphorylation may not be a good marker of increased collisions, although this needs further work. These examples clearly highlight the potential of dricARF to identify conditions that drive collisions and to proactively understand the contexts that they may play a key role in.
Although this approach fills a void in collision-related research, it has a number of important limitations. First, the method does not predict either the coordinates or reasons for ribosome collisions, something that can be done with other experimental techniques, such as disome-seq. dricARF simply reports whether there is a change in the abundance of ribosome collisions between two conditions, and thus acts as a starting point for further work. As a result, dricARF data should be validated and extended with orthogonal experimental approaches. Integrating additional experimental approaches, such as polysome fractionation, disome-seq, or cryogenic electron microscopy (cryo-EM) studies, would provide significant additional information, as well as a validation of the computational predictions. So while our method shows high sensitivity, it is not a replacement for traditional methods, but an additional approach with its own advantages and drawbacks.
It is also important to highlight that dricARF predicts changes in collision abundance but does not provide directionality to those changes. Although in theory we could provide this information, we hesitate to do so due to technical limitations and variations in Ribo-seq protocols. For example, RNase digestion does not necessarily result in fewer rRNA fragments in the regions defined for ribosome collisions. Collisions might cause the shortening of rRNA fragments at these sites, allowing them to be sequenced more because of the size selection strategy employed in Ribo-seq, which ultimately leads to an increase in rRNA fragments in these regions.
An additional limitation is there are currently only a small number of disome structures available that we can use to define collision-driven rRNA changes. As the various structures have different resolutions and variations in their respective SASA profiles, we merged these rRNA positions to create the final Rib.Col. set, which we assigned as the primary set to detect changes in ribosome collisions. While the Rib.Col. set works well as it is currently defined, it will be possible to further improve it as additional structures are published. These differences also explain why we opted to compare leading to trailing ribosomes when creating our sets, rather than comparing disome to monosome structures: cross-study structure analysis is problematic due to the varying resolutions and other technical differences.
The creation of the Rib.Col. set as a merger of individual structures also has implications for analysis across species. The set was generated using yeast and human structures, meaning it is not species-specific. Despite this, however, dricARF gives reliable results for both species, and for data generated in mouse tissue, even though mouse disome structures were not used to generate this set. While this is not surprising due to the highly conserved nature of the ribosome, it is reassuring and suggests that there is room for additional improvement to the approach as more structures are generated.
At present, SASA-based set generation is not yet integrated into ARF and is performed separately. However, we plan to add this in the future, which will allow the creation of sets from additional structures on an ad hoc basis and can either be used individually or be added to the Rib.Col. set. This will be particularly important for structures from species evolutionarily distant from those used here, which may need their own distinct set. Alternatively, adding additional structures to the Rib.Col. set may allow the inclusion of regions of the ribosome that are unresolved in current structures, or provide information about ribosome-associated proteins, which may vary depending on the cause or persistence of the collisions. Indeed, an obvious future research direction is the analysis of ribosomal structures that include binding of surveillance factors, as such factors can potentially alter the RNase digestion on specific rRNA positions as well. If we could also predict the changes in the binding of these factors, this could allow us to investigate the interplay between different sensor proteins and their roles in various cellular contexts, revealing new regulatory mechanisms mediated by ribosome collisions. On the other hand, it should also be noted that SASA-based modelling can only estimate the differences in RNase treatment accessibility. The limitations of such an approach to capture the real-world RNase digestion biases are currently not known to us. In the future, using more detailed RNase-specific approaches might be able to improve the accuracy of defined Rib.Col. sets and subsequent dricARF predictions.
In all, this novel method provides an alternative to traditional techniques for detecting ribosome collisions, offering a valuable tool for the field of ribosome biology. Most importantly, it allows the serendipitous identification of collisions, potentially accelerating research in this area. Researchers can now use our tool with public Ribo-seq datasets to explore the involvement of ribosome collisions in different biological contexts. This may uncover novel biological processes facilitated by ribosome collisions and pave the way for new research avenues investigating the complex interactions and regulatory mechanisms that govern the cellular response to ribosome collisions.
Acknowledgements
The authors thank the anonymous reviewers for their valuable suggestions and Oscar G. Wilkins for his assistance during the initial stages of this project. We also extend our gratitude to Rob van der Kammen, Anna Dopler, and Sofia Ramalho for their constructive comments and for fostering a supportive environment in the W.J.F. Lab.
Author contributions: Conceptualization: F.A., W.J.F., and J.S.; Data curation: F.A. and E.K.B.; Formal analysis: F.A., E.K.B., and J.B.; Funding acquisition: W.J.F.; Investigation: F.A., E.K.B., and J.B.; Methodology: F.A. and W.J.F.; Project administration: F.A. and W.J.F.; Software: F.A. and E.K.B.; Resources: F.A. and W.J.F.; Supervision: F.A. and W.J.F.; Validation: F.A. and E.K.B.; Visualization: F.A.; Writing - Original Draft: F.A. and W.J.F.; Writing - review & editing: E.K.B., F.A., J.S., and W.J.F. All authors reviewed and approved the final manuscript.
Supplementary data
Supplementary data is available at NAR Genomics & Bioinformatics online.
Conflict of interest
None declared.
Funding
This work was financed by the Dutch Research Council (NWO) under the grant OCENW-M20-373 and by The Dutch Cancer Society (KWF) under grant 13878. Research at the Netherlands Cancer Institute is supported by institutional grants of The Dutch Cancer Society and the Dutch Ministry of Health, Welfare and Sport.
Data availability
dricARF is released as part of the ARF R package that is deployed in GitHub and can be accessed using the following link: https://github.com/fallerlab/ARF. The version of the code from the submission of this article is also freely available via https://doi.org/10.5281/zenodo.15116022.

Comments