


Abstract
When replication forks encounter template DNA lesions, the lesion is simply skipped in some cases. The resulting lesion-containing gap must be converted to duplex DNA to permit repair. Some gap filling occurs via template switching, a process that generates recombination-like branched DNA intermediates. The Escherichia coli Uup and RadD proteins function in different pathways to process the branched intermediates. Uup is a UvrA-like ABC family ATPase. RadD is a RecQ-like SF2 family ATPase. Loss of both functions uncovers frequent and RecA-independent deletion events in a plasmid-based assay. Elevated levels of crossing over and repeat expansions accompany these deletion events, indicating that many, if not most, of these events are associated with template switching in postreplication gaps as opposed to simple replication slippage. The deletion data underpin simulations indicating that multiple postreplication gaps may be generated per replication cycle. Both Uup and RadD bind to branched DNAs in vitro. RadD protein suppresses crossovers and Uup prevents nucleoid mis-segregation. Loss of Uup and RadD function increases sensitivity to ciprofloxacin. We present Uup and RadD as genomic guardians. These proteins govern two pathways for resolution of branched DNA intermediates such that potentially deleterious genome rearrangements arising from frequent template switching are averted.
INTRODUCTION
When a replication fork encounters a barrier, the response can take many forms depending on the nature of that barrier. A discontinuity in one of the template strands can lead to a double strand break (1–9). An encounter with a bound protein barrier can produce replisome stalling (10–14). DNA lesions in the template can halt the replisome and trigger fork regression (15–18). These fork stalling/collapse pathways have been the focus of considerable research for several decades.
A fork does not always stall or collapse upon encountering a template strand lesion. Instead, it may skip over the lesion, leaving it behind in a postreplication gap. When a lesion exists in a single strand gap, repair cannot proceed via well-studied paths such as nucleotide excision, base excision, or mismatch repair. The gap must first be filled to create an undamaged complement to the lesion-containing strand. In bacteria, the postreplication gap is filled by one of three processes: translesion DNA synthesis (TLS) (19), template switching (20,21), or recombinational DNA repair via the RecFOR pathway (22,23). The latter two paths of gap filling generate branched intermediates behind the replication fork that, if resolved to a crossover (Figure 1A), lead to formation of chromosomal dimers. Under normal growth conditions, crossovers do not occur in wild type cells at frequencies that would interfere with normal chromosome segregation. Failure to close a gap inevitably leads to a double strand break when the gap is encountered in the next replication cycle (3). Many basic questions about gap generation and resolution remain enigmatic.
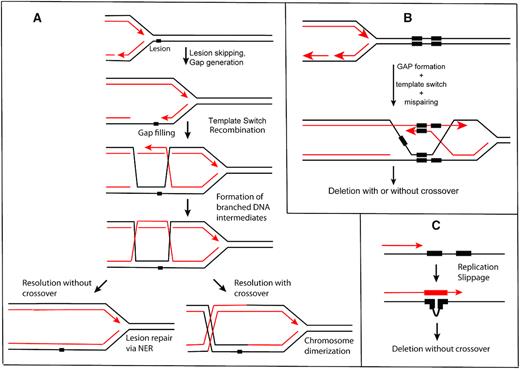
Processes that can lead to deletion between direct chromosomal repeats. (A) The formation of postreplication gaps and gap filling via template switching. The process can generate double Holliday junction intermediates similar to the process of RecA-mediated recombination. Resolution of intermediates can lead to crossing over. (B) If direct repeats are present, template switching can lead to a deletion. (C) A replication slippage model. In principle, this could occur on either the leading or lagging strand.
The concept of repair in postreplication gaps has a five-decade history in the literature of bacterial DNA metabolism (22,24–29). It was first embodied in the concept of post-replication repair, proposed by Howard-Flanders et al. (24,30). Many predictions of the model were subsequently borne out in vivo (31,32). As the idea matured, it was later called daughter-strand gap repair (31), and it became the basis for studies of RecA-mediated gap repair and the specialized functions of proteins such as RecF, RecO and RecR (28,33–38). These ideas continue to be investigated (7,32,39–42). However, the role of gaps in DNA repair remains under-explored amidst current studies on translesion DNA synthesis (TLS) polymerase exchange at the fork (43–45) and fork stalling/collapse pathways (7,9,12,23,46–49).
The importance of DNA gaps in DNA metabolism is becoming evident. Whereas an exchange of TLS polymerases into Pol III replisomes can readily be documented in vitro (43,45,50), new work in vivo is telling a different story. DNA polymerases IV and V spend the majority of their time at genomic sites well separated from the replication fork (51–53). The same is true of labeled RecA protein foci that appear after SOS induction (54). Given the substrate preferences for these enzymes, the distal sites are very likely to be DNA gaps.
Postreplication gaps also play a role in eukaryotic DNA metabolism, with investigation initiated about a decade ago (55). Much as seen in bacteria, postreplication gaps in eukaryotes are generally repaired by recombination-related template switching (56–58), a more standard recombinational repair (59–61) or translesion DNA synthesis by TLS polymerases such as Rev1 or eta (62–69). Ubiquitylation of PCNA regulates gap filling (62,70–72). The gaps are substrates for DNA damage checkpoint activation (73,74).
Of the known pathways for gap filling, template switching is the least understood. At least three processes are often conflated under the ‘template switch’ heading. One of these is the fork reversal that sometimes occurs when replisomes encounter barriers that are not readily bypassed (21,75–77). Recombinase (RecA or Rad51)-dependent D-loop formation followed by extension of the invading strand can also be described as template switching (58,78–80). In this report, we focus only on the third process: recombinase (RecA)-independent template switching behind the replication fork. For the most part, this process is genetically silent (Figure 1A, noncrossover path) in wild type cells. Occasional signatures of template switching can be seen in RecA-independent deletions (Figure 1B) and amplifications (81–85) that can largely be traced to postreplication gaps (21). However, the frequency with which gap generation occurs, the size of gaps, and frequency with which template switching occurs within them, all remain unknown. Similarly, little is known about what triggers gap generation or template switching, or the enzymes that participate in those transactions.
Detection of template switching is possible by engineering genetic events that can be traced to postreplication gaps. When direct repeats under 200 base pairs exist in the genome, and are within a few kilobase pairs of each other (86,87), a prominent class of RecA-independent deletions between genomic repeats can be detected (21,86–92). An unknown fraction of the deletion events could be caused (in principle) by replication slippage (Figure 1C). However, many of the events are accompanied by crossovers and repeat expansion, which would not occur under a simple replication slippage mechanism. Study of these rearrangements has led to a model where the crossover-associated events reflect DNA template switching that occurs in postreplication gaps (21,89) (Figure 1B). These events have several conditions. First, they require a discontinuity in the lagging strand to initiate (21). Second, they depend upon the DnaK chaperone protein, in a manner that is genetically separable from the role of DnaK in the heat shock response (92). The replicative β-clamp and the clamp-loading complex are also required (93). Third, misalignment of the repeats during this template switch can result in repeat deletions (Figure 1B) or expansions (91,92). Finally, resolution of the resulting Holliday junctions can result in either a noncrossover or a crossover, the latter producing a dimerization of the entire chromosome or plasmid regardless of the fate of the repeats themselves (21) (see Figure 1A). Such dimers are normally resolved by the site-specific recombinase XerCD, operating at a specific site called dif, near the replication terminus.
Here, we demonstrate that RecA-independent recombination via template switching in gaps is a common genomic event. Although template switching provides a viable path to gap filling and eventual repair of a lesion if present, it also generates branched DNA intermediates, the processing of which can produce crossover events behind the replication fork. We introduce two proteins, Uup and RadD, that suppress these potentially deleterious genetic rearrangements that can accompany template switching. The functions of these proteins have remained relatively obscure.
The uup gene first attracted interest due to an observed increase in precise excision of transposons elicited by uup mutants (94). The uup gene encodes a 635 amino acid protein with a predicted molecular weight of 72 067. It is an ABC family ATPase in Class 2 (no transmembrane domain). The UvrA protein also belongs in this class and shares similar domain layout with Uup. The Uup protein has two nucleotide binding domains with their own Walker A/B motifs connected by a linker and followed by a coiled-coil C-terminal domain. The Uup ATPase exhibits cooperativity such that inactivation of one site eliminates all ATP hydrolytic activity (95).
The radD gene (formerly yejH) encodes a polypeptide of 586 amino acid residues (including the N-terminal Met) with a predicted molecular weight of 66 413. It has been implicated in DNA repair following radiation or chemical damage (96). The peptide sequence of the RadD protein includes all seven of the motifs associated with a superfamily 2 (SF2) helicase (96), with the motifs aligning well to E. coli SF2 helicases RecG and RecQ. RadD also exhibits limited homology to the human XPB(ERCC3) protein (96). The protein binds to SSB and exhibits a DNA-independent ATPase activity that is stimulated by interaction with SSB (97).
Uup and RadD appear to govern two partially redundant pathways to resolve the branched DNA products of template switching, as introduced below.
MATERIALS AND METHODS
Strain construction
Strains used in this report are presented in Table 1. A modification of the method of Datsenko and Wanner (98) was used to make chromosomal gene knockouts. Plasmid pEAW507, which includes a kanamycin (Kan) resistance cassette flanked by FRT recognition sites for the FLP recombinase (pJFS42 mutant FRT-KanR-wt FRT) was the template used for gene deletions. PCR amplification across this cassette was carried out using primers that each include (a) 21 nucleotides of sequence complementary to one end of the cassette, and (b) an additional 50 nucleotides complementary to sequences flanking the gene of interest. Gel-purified PCR product was electroporated into the bacterial strain harboring pKD46, which expresses the λ Red recombinase. λ Red recombinase was expressed by the addition of L-arabinose. Kanamycin-resistant colonies were screened for ampicillin sensitivity, and used as a template in confirmation PCR with primers located in the chromosomal regions both upstream and downstream of the gene of interest. The KanR cassette was then removed by transient expression of the FLP recombinase (99). Use of the mutant FRT site from pJFS42 (100) prevents subsequent FLP-mediated recombination. For strains containing multiple deletions, P1 transduction was used to introduce additional alleles. The ΔrecA allele was introduced from strain STL7180 by transduction.
Strains used in this study
| Strain | Genotype | Parent strain | Source/technique |
|---|---|---|---|
| MG1655 | uup+ radD+ xerD+ | – | (125,126) |
| STL7180 | recA::cat | MG1655 | (92) |
| STL7212 | Δuup::FRT kan | MG1655 | Lambda Red recombination |
| STL8027 | ΔradD::FRT cat | MG1655 | Lambda Red recombination |
| STL21852 | ΔradD::FRT cat | MG1655 | Transduction of MG1655 with P1 grown on STL8027 |
| STL21884 | uup::FRT kan | MG1655 | Transduction of MG1655 with P1 grown on STL7212 |
| STL21912 | ΔradD::FRT | MG1655 | CatS derivative of STL21852 after pCP20 transformation and curing |
| STL21712 | recA::cat | MG1655 | Transduction of MG1655 with P1 grown on STL7180 |
| STL21936 | Δuup::FRT kan ΔradD::FRT | MG1655 | Transduction of STL21912 with P1 grown on STL7212 |
| STL21954 | recA::cat ΔradD::FRT cat | MG1655 | Transduction of STL21912 with P1 grown on STL7180 |
| STL21932 | recA::cat Δuup::FRT kan | MG1655 | Transduction of STL21884 with P1 grown on STL7180 |
| STL21969 | recA::cat Δuup::FRT kan ΔradD::FRT | MG1655 | Transduction of STL21936 with P1 grown on STL7180 |
| ZJR01 | △uup° | MG1655 | Transduction of MG1655 with P1 grown on EAW242 |
| ZJR04 | △uup△radD | MG1655 | Transduction of ZJR01 with P1 grown on EAW232 |
| EAW526 | ΔradD | MG1655 | Transduction of MG1655 with P1 grown on EAW232 |
| EAW1133 | ΔxerD | MG1655 | Lambda RED recombination |
| EAW1136 | ΔradD +Δlac IZYA +Δuup + ΔxerD | EAW1132 | Transduction of EAW1132 with P1 grown on EAW1133 |
| EAW1140 | AmpR &Tet repeat +ΔxerD | STL695 | Transduction of STL695 with P1 grown on EAW1133 |
| EAW1145 | AmpR &Tet repeat +Δuup +ΔradD +ΔxerD | EAW1139 | Transduction of EAW1139 with P1 grown on EAW1133 |
| EAW242 | founder+Δe14+Δuup | MG1655 | Lambda RED recombination |
| EAW232 | founder+Δe14+ΔradD | MG1655 | Lambda RED recombination |
| EAW1132 | ΔradD +Δlac IZYA +Δuup | EAW1100 | Transduction of EAW1100 with P1 grown on EAW242 |
| EAW1100 | ΔradD +Δlac IZYA | EAW526 | Transduction of EAW526 with P1 grown on EAW408 |
| EAW408 | Δlac IZYA | MG1655 | Lambda RED recombination |
| EAW1139 | AmpR &Tet repeat +Δuup +ΔradD | ZJR05 | Transduction of ZJR05 with P1 grown on EAW232 |
| STL695 | AmpR &Tet repeat | AB1157 | (89) |
| ZJR05 | AmpR &Tet repeat +Δuup | STL695 | Transduction of STL695 with P1 grown on EAW242 |
DNA substrates
Holliday junction substrates were ordered from Integrated DNA Technologies (IDT) with the following sequences:
OH1: 5′-56FAM/CCCGTGATCACCAATGCAGATTGACGAACCTTTGCCCACGT-3′,
OH2: 5′-GACGTGGGCAAAGGTTCGTCAATGGACTGACAGCTGCATGG-3′,
OH3: 5′-GCCATCCAGCTGTCAGTCCATTGTCATGCTAGGCCTACTGC-3′,
OH4: 5′-GGCAGTAGGCCTAGCATGACAATCTGCATTGGTGATCACGG-3′.
Double strand DNA substrates contained the following sequences:
ZJRds1:5′-GCAATTAAGCTCTAAGCCATCCGCAAAAATGACCTCTTATCAAAAGGA, ZJRds2: 5′-/56FAM/TCCTTTTGATAAGAGGTCATTTTTGCGGATGGCTAAGAGCTTAATTGC-3′. Two strand Replication fork substrates contained oligos OH1 and OH4. 3-way junction replication forks were generated from OH1, OH2, and 3W with the sequence 5′-GACGTGGGCAAAGGTTCGTCGTCATGCTAGGCCTACTGC-3′. All oligos were purified through standard desalting, HPLC purification was used for oligos with a fluorescent tag.
Protein purification
Escherichia coli RecA and RadD proteins were purified as described previously (96,101). The open reading frame of E. coli Uup was PCR amplified and subcloned in-frame into NdeI/EcoRI digested pET21a resulting in plasmid pEAW840. STL2669(DE3) (ExoI- ΔrecA derivative of AB1157, from Susan Lovett) was transformed with pEAW840, and 10 L of cells were grown in LB containing 100 μg/ml Ampicillin (Amp) at 37°C to an OD600 of 0.4. Expression of Uup was induced by adding 1 M IPTG to a final concentration of 0.4 mM to each culture and growing cells for an additional 3 h at 37°C. Cells were pelleted, flash frozen and resuspended in 25% (w/v) Tris-Sucrose solution to a 20% (w/v) cell pellet weight to volume ratio overnight. Three Roche Complete Protease Cocktail tablets were added and cells were lysed by sonication. Cell debris was pelleted and supernatant was saved. Uup was precipitated by adding ground ammonium sulfate was added to supernatant to a final concentration of 0.164 g/ml and stirred gently at 4°C for 2 h. Precipitant mixture was pelleted and resuspended in R buffer (20 mM Tris–Cl, 0.1 mM EDTA, 1mM DTT), 1 M Ammonium Sulfate, and 10% Glycerol. Protein was loaded onto a Butyl Sepharose Column and eluted over a linear gradient of 10 column volumes from 1 M to 0 mM ammonium Sulfate. Uup containing fractions were pooled and dialyzed three times against 2 l P buffer (20 mM Potassium phosphate, 0.1 mM EDTA, 10% glycerol) for 2 h each time. Dialyzed protein was loaded onto a ceramic hydroxyapatite column. Uup came out in the initial wash steps. Uup pools were dialyzed against R buffer containing 50 mM KCl 3 times and dialyzed fractions were loaded onto a Source 15Q column. Protein containing fractions were pooled and 0.28 g/ml ground ammonium sulfate was added to precipitate the protein overnight at 4°C while stirring gently. Protein precipitate was resuspended in R+ 1 M ammonium sulfate and applied to a small butyl sepharose column. A linear gradient of 1 M to 0 mM ammonium sulfate was applied over 10 column volumes. Uup containing fractions were pooled and tested for nuclease activity against PhiX RFI, PhiX virion and PstI digested PhiX RFI DNA. Protein was then aliquoted and flash frozen for −80°C storage. All proteins used in this work were greater than 98% pure and lacked detectable nuclease activities. The concentrations of RadD and Uup proteins were determined using the measured extinction coefficients of 59 500 cm−1 M−1 and 60 310 cm−1 M−1, respectively.
Plasmid repeat deletion assays
The pSTL plasmid series were constructed with direct repeats of a part of the gene encoding tetracycline resistance, 101 bp unless otherwise noted. A deletion involving the repeats restores tetracycline resistance. Deletion frequencies were measured by determining the number of Tetr Ampr cells in the Ampr population.
Protocol 1
Plasmid-borne deletions were assayed by transforming the indicated pSTL plasmid into strain MG1655 and its derivatives (listed in Table 1) as described previously (89). All incubations were carried out at 37°C. Transformants were streaked on LB+Amp plates to obtain single colonies. Entire fresh overnight colonies were then resuspended and grown in 1 ml LB+Amp broth for 2 h. Serial dilutions in 56/2 buffer (102) were spotted on LB+Amp and LB+Amp+Tet plates and incubated overnight at 37°C, followed by colony counts.
To analyze plasmid size, the plasmid was isolated from a number of independent Tetr isolates and run on n agarose gel to determine populations of dimers or monomers. All of the strains are recA null mutants, eliminating background dimerization from recombination. Dimerization occurs as the result of a sister chromosome exchange (SCE) concomitant with deletion. To obtain the frequency of deletions associated with dimerization (SCE), the deletion frequency was multiplied by the proportion of plasmids in the dimer form.
Protocol 2
Strains derived from MG1655 (Table 1) were made chemically competent and transformed by the indicated plasmid in the pSTL series, followed by plating on LB plates containing 100 μg/ml ampicillin. Single transformants were streaked onto Amp/LB plates and incubated at 37°C overnight. The following day, single colonies were picked to inoculate 2 ml LB/Ampicillin. Overnights were grown for 12 h each time to ensure equal growth for repeat deletion. 5 ml of LB was inoculated with 50 μl of overnight and grown to an OD600 of ∼0.2. at 37°C. Thus, the transformants undergo substantially more cell cycles in this protocol than in protocol 1. Cultures were serially diluted in 10× steps to 10−–6, and 100 μl of different dilutions were plated on Amp and Amp/Tet plates. Dilutions that gave 30–300 colonies were used to determine the ratio of Amp/Tet colonies per Amp colonies to yield repeat deletion frequencies.
Plasmid repeat expansion assay
Repeat expansion assays was carried out with plasmid pEXPBR (91), utilizing protocol 1 under Plasmid repeat deletion assays above.
RecFOR-mediated recombination assay
The assay relies on intermolecular recombination between two plasmids, pSTL330 and pSTL336, described previously (103). This recombination generates tetracycline resistance, and is dependent on RecFOR and RecA (103). Fluctuation assays for rate determination were performed by inoculation of 8–24 independent entire single colonies and aerobic growth for 2 h in LB broth+Amp+Cam (Chloramphenicol). Subsequent serial dilution and plating on LB+Amp+Cam and LB+Amp+Cam+Tet determined the number of plasmid bearing cells and plasmid recombinants, respectively, in each culture. Using these values, recombination rates were calculated from either the method of the median or the maximum likelihood method as described (104). The maximum-likelihood method was used in cases where 25% or more of the cultures contained zero Tet-resistant colonies.
Computer simulations
To produce estimates of gap frequencies, gap sizes and repeat deletion probabilities for the experimental deletion data, we carried out computer simulations in Matlab (Mathworks). The complete code is attached as Appendix PDF and is an adaptation of a simulator we used previously to replicate protein dynamics in single-molecule fluorescence traces (53). For plasmids we simulated 100 000 molecules in each run. The length of each molecule and the length of the repeat array mirrored those for pSTL57 (length 4461 bp/repeat array 202 bp), pSTL67 (4761/502 bp), pSTL 71 (5261/1002 bp), pSTL74 (5661/1602 bp), pSTL77 (7661/3402 bp) and pSTL78 (12261/8002 bp). Matching the length of the simulated DNA to the total length of the plasmid is appropriate as these plasmids undergo unidirectional replication. For each simulation the start of the repeat array was positioned 1000 bp from the ‘origin’. Plasmids were initiated at the origin. At each nucleotide position, the simulator decided whether or not to initiate a gap by drawing randomly from a normal distribution of values centered at the input gap frequency value. Once initiated, gaps were terminated in a similar fashion, drawing from a normal distribution centered at the reciprocal of the input gap size. This continued until each position of the plasmid had been sampled. Gaps that spanned the entire repeat array were identified. Each was classed as a deletion or non-deletion by drawing randomly from a normal distribution of values centered at the input deletion probability. To determine the proportion of cells carrying deletions, plasmids were placed in groups of 30 (representing the copy number of the plasmid). If any plasmid contained a deletion, that group (cell) was designated as containing a deletion product. Simulations of chromosomal repeat deletions were similar, except that the input DNA length was 2 320 826 bp (half the E. coli genome) and a group size of 2 was used, reflecting bidirectional replication of the chromosome.
Plasmid size gel electrophoresis
Three tetracycline resistant pSTL74 colonies from each strain the were chosen at random and grown for 16 h at 37°C. Plasmids were purified using the Promega Wizard® SV Minipreps DNA Purification Systems kit and stored in 25 μl TE. DNA concentrations of each plasmid preparation were taken for normalization and approximately 100 ng was loaded into a lane on an 0.8% agarose Tris–borate–EDTA (TBE) gel. The gel was run at 100 V for 4 h, stained and photographed.
Plasmid measurements/electron microscopy
A modified alcian method was used to visualize the RecA coated regions of the DNA filaments on plasmids. Activated grids were prepared as described previously (101). Plasmids for electron microscopy analysis were prepared as described above. Plasmids were boiled for 5 minutes and then incubated on ice before coating them with RecA protein. The standard reaction contained 0.01 ug/ul DNA, RecA buffer (25 mM Tris–HCl, 80% cation, final pH 7.2/5% (vol/vol) glycerol/10 mM MgCl2), 2 mM DTT, 8 uM RecA, 0.37 mM SSB and 3 mM ATPyS. This mixture was incubated for 10 mins in a 37 °C water bath and 3 min on ice before proceeding.
The reaction mixture was diluted to a final DNA concentration of 0.4 ng/μl with diluting buffer (200 mM ammonium acetate, 10 mM HEPES and 10% glycerol (pH adjusted to 7.5)) and adsorbed to an activated alcian grid for 3 min. The grid was then touched to a drop of the above buffer, followed by floating on a drop of the same buffer for 1 min. The sample was then stained by touching to a drop of 5% uranyl acetate followed by floating on a fresh drop of the same solution for 30 s. Finally, the grid was washed by touching to a drop of double distilled water followed by immersion in two 10 ml beakers of double distilled water. After the sample was dried, it was rotary-shadowed with platinum. This protocol is designed for visualization of complete reaction mixtures, and no attempt was made to remove unreacted material. Although this approach should yield results that give a true insight into reaction components, it does lead to samples with a significant background of unreacted proteins and broken DNA molecules. Grids were searched to locate circular DNA molecules coated with RecA protein. Each molecule encountered in a sample that was (a) a complete circle, (b) uniformly coated with RecA protein (molecules with short stretches of SSB protein were rejected) and (c) lacked branches or other structural complexities that could prevent them to be traced unambiguously was selected and measured. The size selection was random as every molecule encountered that met these criteria was included in the analysis.
Imaging and photography were carried out with a TECNAI G2 12 Twin Electron Microscope (FEI Co.) equipped with a 4k × 4k Gatan Ultrascan CCD camera. Digital images of the nucleoprotein filaments were taken at ×15 000 Magnification.
At least fifty circular DNAs coated with RecA filaments were included from both the wild type and Δuup ΔradD strains. Each molecule was measured three times using Metamorph analysis software and the average length was calculated in nm. The 500 nm scale bar was used as a standard to calculate the number of pixels per μm. Each nucleoprotein fragment length, originally measured by Metamorph in pixels, was thus converted to nm. Plots were generated using GraphPad Prism Software.
Electrophoretic mobility shift assays (EMSA)
Annealing reactions to create branched DNA substrates were carried out by adding equimolar oligo amounts in buffer A (40 mM Tris 80% Cation (pH 7.5), 100 mM NaCl and 10 mM magnesium acetate), heated at 95°C for 5 min, and cooled at 1 degree per minute in a Eppendorf Nexus X2 Mastercycler. Annealed DNA was purified from a 8% TBE gel, concentration was determined by diluting DNA in TE buffer and measuring absorbance at 260 nm in a Cary 300 UV–Vis spectrophotometer using extinction coefficients provided by IDT.
Standard binding reactions contained buffer A, 1 mM DTT, 100 nM DNA and the indicated concentration of Uup protein to a final volume of 10 μl. Reactions were incubated in a 37°C water bath for 30 min followed by a 5 min incubation on ice. 6× Ficoll was added to a final 1× concentration and each sample was run on an 8% TBE gel at 150 V for 3 h. Gels were imaged using a GE Healthcare Typhoon FLA9000.
Fluorescence polarization assays
A three-way junction substrate was formed by annealing oligos OH1, OH4 and 3W (see sequences under ‘DNA substrates’ above) and gel purifying as described above. The empty replication fork was generated by annealing OH1 and OH4. RadD protein was incubated with 5 nM DNA, RecA buffer, 5 mM ATP, 0.1 mg/ml BSA and incubated at room temp for 30 min. Fluorescence polarization values were measured using at 25°C using a Beacon 2000 Fluorescence Polarization System. Average polarization values of reactions containing only DNA substrate were subtracted from experimental values. For all binding experiments the data were fit to a simple one site specific interaction model using GraphPad Prism Software.
Bright-field microscopy
For all measurements of cell filamentation, wide-field microscopy was conducted on an inverted microscope (IX-81, Olympus with a 1.49 NA 100× objective). Bright-field images were collected on a 512 × 512 pixel EM-CCD camera (C9100–13, Hamamatsu). For imaging of all strains we used glass coverslips functionalized with 3-amino-propyl-triethoxysilane (APTES, Alfa Aeser) to immobilize cells on the coverslip surface.
Coverslips were first sonicated for 30 min in 5M KOH to clean and activate the surface of the coverslip. Coverslips were then rinsed thoroughly with MilliQ water, then treated with 1 m 5% (v/v) of APTES in MilliQ water for 10 min. Subsequently, coverslips were rinsed with ethanol twice and sonicated in ethanol for a further 20 s. Finally, functionalized coverslips were rinsed with MilliQ water and dried in a jet of N2 and stored under vacuum prior to use.
Live-cell imaging
For all imaging experiments, cells were grown overnight at 37°C with shaking in EZ rich defined medium (Teknova) that contained 0.2% (w/v) glucose. Overnight, saturated cultures were reset 1 in 1000 μl EZ glucose and grown out for 3 h before imaging. To initiate imaging, 20 μl of cells were loaded onto an APTES functionalized coverslip, sandwiched with a KOH cleaned coverslip and allowed to associate with the surface before being imaged. A single bright-field image (34 ms exposure) was taken at multiple fields of view to determine cell lengths and filamentation.
Growing cells in SYTOX Orange
Nucleoids were visualized using SYTOX Orange, chosen for its ready detection coupled to minimal perturbation of cell growth (105). A nonionic detergent, Poloxamer 188 (106–109), was added to increase dye uptake. For all strains, cells were grown overnight in EZ Glucose at 37°C with shaking. The next morning saturated cultures were diluted 1/100 in 500 μl EZ Glucose and grown at 37°C for ∼1 h. Following this, a pluronic detergent (Poloxamer 188, Sigma-Aldrich) and SYTOX Orange (Sigma-Aldrich) was added (to final concentrations of 1.5% (v/v) and 150 nM, respectively) and the culture grown for another hour at 37°C before imaging as described below. These conditions were derived from optimization and do not affect cell growth rates, as demonstrated in Supplementary Figure S2.
SYTOX Fluorescence Imaging
Wide-field fluorescence imaging was conducted on a Nikon Ti2-E microscope equipped with a 1.49 NA 100x objective and a 512 × 512 pixel2 EM-CCD camera (C9100-13, Hamamatsu). NIS-Elements equipped with JOBS software was used to operate the microscope (Nikon, Japan). Continuous excitation is provided using a semidiode laser (Sapphire LP, Coherent) of wavelength 568 nm (200 mW max output). For all strains, yellow excitation light (λ = 568 nm) was utilized at high intensity (2750 W cm−2), collecting emitted light between 610–680 nm (ET 645/75m filter, Chroma).
To characterize the nucleoid position of all strains, a snapshot of each cell position was first recorded as a bright-field image of 124 ms exposure. To characterize the nucleoid position of all strains, 100 ms exposure images using 568 nm light were recorded. All images were analyzed with ImageJ (110). For imaging of all strains, glass coverslips were first cleaned via sonication in 5M KOH. Cells were then spotted onto the coverslip (20 μl) and immobilized for imaging with a small agarose pad (1.5% agarose containing EZ glucose).
Analysis of cell filamentation/Intensity profile generation
Bright-field images of all strains were imported into MicrobeTracker 0.937 (110). A MATLAB script was used to create cell outlines as regions of interest (ROIs). Cell outlines were manually created and designated via MicrobeTracker to ensure accuracy and that only non-overlapping, in-focus cells were selected for analysis. ROIs were then exported Microsoft Excel to define cell parameters including cell length. To generate intensity profiles, cells were outlined as mentioned above. The ROIs were used to define the edges when measuring the intensity profile of each cell by MicrobeTracker. A MATLAB script was used to average the intensity profile of each cell. Profiles were generated through MicrobeTracker 0.937 (110) and average plots were made in MATLAB (see methods). Cell lengths were normalized, with fluorescence intensity measured for 10 bins representing 0.1 of each total cell length.
Autocorrelation analysis
Cell intensity profiles, plotted along the x-axis of each cell, were generated using MicrobeTracker 0.937, a MATLAB script, based upon previously defined cell outlines as regions of interest (110). For each intensity profile the autocorrelation function was calculated in MATLAB using the xcorr routine. The mean of these functions was determined for each set of data (wild-type, ΔradD, Δuup, ΔuupΔradD) and normalized against the value at zero lag. The normalized means for each data set was then plotted, providing an indication of the relative abundance of different width nucleoid features for each data set.
DNA damage sensitivity assays
Strains were grown in 3 ml LB culture overnight at 37°C. The following day 10 0μl of overnight was used to inoculate 10 ml LB and grown to an OD600 of ∼0.2 while shaking at 37°C. Cultures were serially diluted in 10× steps to 10−–6 in 1× PBS buffer (137 mM NaCl, 2.7 mM KCl, 10 mM Na2HPO4, 1.8 mM KH2PO4, 1 mM CaCl2 and 0.5 mM MgCl2) in a 96-well plate. LB agar plates were made the day of plating and kept in dark to prevent break down of DNA damaging agents. A total of 10 μl of each dilution was plated for all strains, and the plates were photographed after growth at 37°C overnight.
SOS induction assays
Plasmids carrying the Photorhabdus luminescens luxCDABE luciferase operon were used for reporters for induction of the SOS response (92,111). Promoter-less vector (pDEW201) or fusion to the E. coli recA promoter (pDEW238), were transformed into the appropriate strains and selected by Amp-resistance. Single colonies were grown in half of a 96-well plate containing 200 μl of LB+ 100 μg/ml Amp medium per well and grown standing overnight at 37°C. The next day, the cultures were diluted 1:100 in 100 μg/ml LB+Ap broth (200μl total per well) in duplicate into a 96-well plate reader plate (Corning Incorporated/Costar) and put into the plate reader (Synergy H1 Hybrid Reader by BioTek). The samples were allowed to grow shaking for 75 min at 37°C, with OD600 and luminescence readings taken every 15 minutes. One set was treated with AZT (500 ng/ml) while the other set was not treated. The samples then continued to grow with shaking at 37°C for 18 h and the OD600 and the luminescence were measured for each well every 15 min. Relative luminescence units (RLU) values were calculated by normalizing the amount of bioluminescence (in counts per second, cps) to the OD600 of the cultures.
Growth curves
In a large test tube, 2 ml of LB was inoculated to a starting OD600 of at least 0.005. In a 96-well plate samples were diluted to an OD600 of 0.0025 with 150 nM SYTOX and 15% Poloxamer 188. Untreated samples had 15% water added in place of the poloxamer and volume equivalents of DMSO added in place of the SYTOX. Cultures were placed in a BioTek Synergy H1 microplate reader and OD was measured overnight every 10 min while shaking. Blank OD readings were subtracted from the wells containing cells and data were graphed on GraphPad Prism Software.
RESULTS
The experiments to follow were designed to explore the role of the Uup and RadD proteins in the suppression genomic rearrangements resulting from RecA-independent recombination events occurring behind the replication fork in postreplication gaps. We have no evidence that RadD or Uup affect the frequency of gap generation itself, and test that supposition at the end of this study. Instead, the properties of these two proteins suggest that they act on branched DNA molecules of a type that can be generated by RecA-independent template switching within gaps behind the replication fork (Figure 1A and B).
Uup and RadD suppress genomic deletions via two distinct pathways
We focus on DNA deletions of a type associated with RecA-independent template switching in gaps (20,21,92,112). The results presented in Figure 2 utilize a series of multicopy plasmids described previously (20,21,92,112) that feature direct 101 bp repeats separated by varying amounts of unique sequence DNA, with one plasmid (pSTL55) featuring tandem 787 bp repeats. A successful deletion event confers resistance to tetracycline.
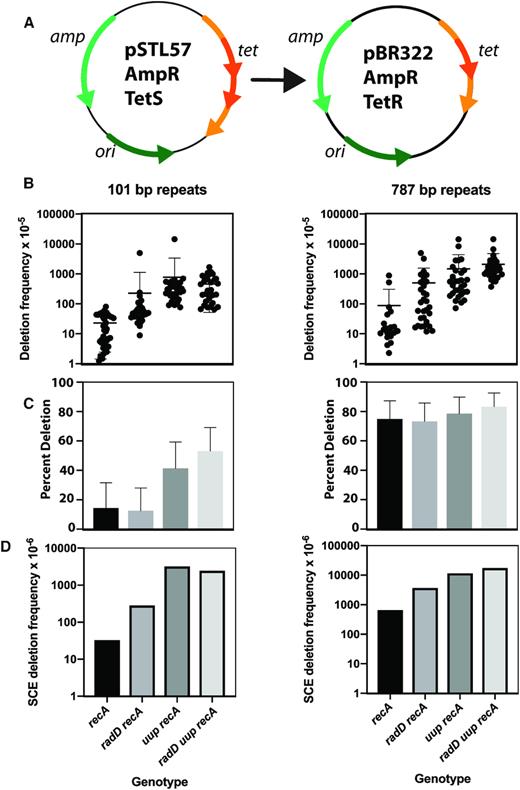
(A) The plasmid-based deletion assay. Part of the sequence of the gene encoding tetracycline resistance is repeated, creating a null allele. Recombination between the repeats can generate a functional gene and tetracycline resistance. (B) DNA deletion frequency in plasmids bearing 101 bp and 787 bp repeats. Assays were carried out as described in Materials and Methods, protocol 1. (C) Proportion of deletion products that are replicon dimers. (D) Derived frequency of deletion associated with sister chromosome exchange.
Two sets of experiments were carried out, in two laboratories and using different sets of Escherichia coli strains based on MG1655 (Table 1; STL series) and with protocols that differ in key details. Two plasmids, pSTL57 and pSTL55, carrying tandem repeats of 101 and 787 bp, respectively were used in the first set of experiments (Figure 2), and all of the strains carried a deletion of the recA gene. The protocol (protocol 1; see Materials and Methods) involved transformation, selecting transformants that grow on Ampicillin, selection of single colonies, then growth of a colony in media for 2 hours before plating. With the 101 bp repeats (pSTL57), the average deletion frequency was increased about 10-fold when the radD gene was also deleted (Figure 2B). The deletion frequency increased further when the uup, or when both uup and radD were deleted. A similar pattern was seen when the deletions involved 787 bp repeats (pSTL55). For the 101 bp repeats, the proportion of deletion products found to be dimeric increased for strains lacking uup or both uup and radD (Figure 2C). For the 787 bp repeats, ∼80% of the deletion products were dimeric in all strains. The derived frequency of deletion events associated with dimerization (sister chromatid exchanges) was increased with deletion of either radD or uup (Figure 2D).
The second set of experiments was carried out in E. coli strains derived from MG1655 using a broader set of plasmids in the pSTL series, all with 101 bp repeats but with varying distances and structures separating the repeats. The protocol in this case featured an extended period of growth with the transformants prior to plating and colony counting (protocol 2; see Methods), which substantially increased the yield of deletion events. In addition, these strains did not have recA deletions except where indicated (Table 1; EAW series). Beginning with pSTL57 (tandem repeats of 101 bp), deletion of either uup or radD produces an increase in deletion frequency of 18- or 2-fold, respectively (Figure 3; increases somewhat difficult to view on this linear scale). Deletion of both uup and radD generates a further and synergistic increase (96-fold relative to wild type) readily seen on the linear scale. Scatter plots on a logarithmic scale are provided for pST57 and two other plasmids at the bottom of Figure 3. When the repeats are adjacent to each other, 8% of the surviving cells contain plasmids that have undergone successful deletion to secure tetracycline resistance. These deletions occur independently of the RecA protein, as seen in the one strain where a recA deletion is included in the uup radD background (Figure 3).
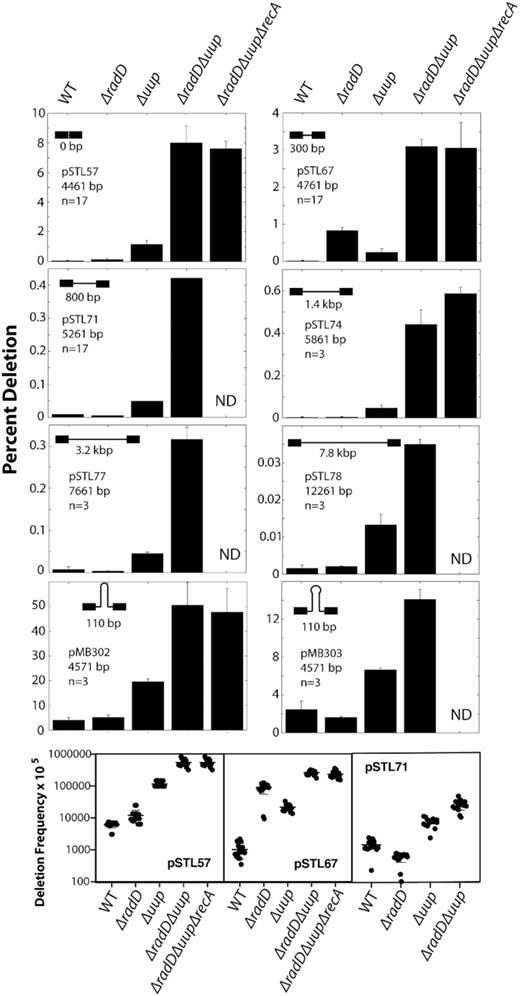
DNA deletion frequency in plasmids bearing direct 101 bp repeats. Assays were carried out as described in Methods, protocol 2. As the number of cell cycles following transformation is higher when this protocol is used, the observed deletion frequency is higher than that observed in Figure 2. The distance between repeats is given in each graph. Successful deletion results in resistance to tetracycline. Please note the different scales in the various panels.
As the distance between the repeats (in base pairs) is increased, the deletion frequency declines. However, the overall pattern remains consistent. Inactivation of either uup or radD results in an increase in deletion, while deletion of the genes encoding both proteins brings about a larger increase. Presumably, the distance renders the mispairing required for a deletion and/or the possibility of both repeats falling within a single gap less likely. The fact that deletion frequencies can still be reliably measured even when the repeats are separated by 7.8 kb suggests that the length of postreplication gaps is at least sometimes substantial.
The trend observed as the distance between repeats is lengthened is abrogated when a 101 bp palindrome is inserted between the repeats. Here, substantial levels of deletion (∼4%) are seen even in wild type cells. This rises to 50% when uup and radD function are both absent (pMB302; featuring a 53 bp inverted repeat separated by a 4 bp sequence that becomes the loop when a cruciform forms). The deletion rates decline somewhat when the inverted repeat decreases to 46 bp and the connecting loop is lengthened to 14 bp (pMB303) but are still substantial (Figure 3). Again, the high rate of deletion occurs independently of RecA. Palindromes are known to be barriers to replication. This barrier may facilitate a lesion-skipping process and the formation of a postreplication gap.
We note that the effect of deleting the recA gene alone on deletion frequency in this assay has been studied previously (86). Relative to wild type cells, the effects of recA deletion on deletions involving repeats of this size are generally very small. With pSTL57, the absence of RecA function leads to no significant decline in deletion frequency (86). RecA dependence becomes more important for repeats of 200 bp or greater (86).
In effect, the loss of Uup and RadD function is uncovering a common process in DNA metabolism—gap generation and template switching—that is usually rendered genetically silent by the presence of these two enzymes. We also note that the synergistic increase seen when both uup and radD are deleted suggests that the two proteins operate in distinct, albeit partially redundant pathways to resolve the intermediates generated by template switching. In the work to follow, we first carry out simulations to provide a first (and rough) estimate of the underlying frequency of gap generation and template switching. We also find (a) evidence that the events seen in the absence of these two proteins are accompanied by a substantial level of crossing over and repeat expansion, (b) uup and radD deletions affect cell division and viability with some but not all DNA damaging agents, (c) the Uup and RadD proteins bind to branched DNA structures and (d) no evidence that Uup and RadD affect the rate of gap generation itself in two tests.
Lagging strand gap generation and template switching is a frequent genomic event
The contribution of template switching, and the generation of postreplication gaps in which template switching occurs, to DNA metabolism has been difficult to assess due to the absence of an associated and reliable signal. The high rates of deletion seen in cells lacking uup and radD function provides an opportunity to derive preliminary estimates for the frequency at which these processes occur, as well as the size of the gaps in which they occur.
The calculation (Figure 4) proceeds from further consideration of Figures 2 and 3. The deletion reaction relies on mispairing during a template switch within a gap. As described above, we begin with a scenario in which there is a level of gap generation and template switching organic to the replication process in E. coli that is normally not observed (rendered genetically silent) due at least in part to the activities of Uup and RadD.

Calculations of estimates for gap sizes, gap frequencies and deletion probabilities, based on the data of Figure 3. (A) Plot of the expected proportion of cells carrying TetR deletion products as a function of generation number for a constant deletion rate of 0.13% per generation. (B) Plot of deletion frequencies for uup radD cells. Data are the same as those shown in Figure 3. The data were fit with a single exponential decay function in Matlab (Mathworks). (C) Schematic of a computer simulation designed to probe deletion frequencies. The complete code (for Matlab) is available as Appendix PDF, in supplementary materials. (D–F) Simulated deletion frequencies. Plasmid lengths and repeat array lengths mirrored those for pSTL57, pSTL67, pSTL71, pSTL74, pSTL77 and pSTL78 (see Figure 3). All runs simulated 100,000 plasmids. Output data were fit with a single exponential decay function in Matlab (Mathworks). (D) Simulated deletion frequencies for gap initiation frequencies of 10−4 nt−1 (red), 10−5 nt−1 (magenta), 10−6 nt−1 (cyan) and 10−7 nt−1 (black). Other parameters: gap size = 300 nt; deletion probability = 0.5. (E) Simulated deletion frequencies for deletion probabilities of 0.015 (black), 0.05 (cyan), 0.15 (magenta) and 0.5 (red). Other parameters: gap size = 300 nt; gap frequency = 10−4 nt−1. (F) Simulated deletion frequencies for gap sizes of 100 nt (black), 178 nt (cyan), 300 nt (dark green), 562 nt (light green), 1000 nt (magenta), 1778 nt (yellow) and 3000 nt (red). To highlight the differences in exponential decay rates outputs for different gap sizes were normalized against frequencies for the shortest repeat array (202 bp, equivalent to pSTL57). Other parameters: gap frequency = 10−4 nt−1; deletion probability = 0.5.
Key uncertainties limit the accuracy of this simulation exercise. There may be additional enzymes in E. coli (besides RadD and Uup) that suppress the deletion process, such that the resulting estimate represents only a lower limit. We do not know the average size of postreplication gaps, the frequency with which RecA-independent template switching is utilized for gap filling, or the likelihood that mispairing will occur during the template switch so as to produce a deletion. We assume that gaps are at least long enough to extend across the region in which the deletion must occur (some template switching mechanisms that produce deletion may not require this), that gap generation must be at least as frequent as the template switching that relies on it, and that correct pairing during a template switch is at least as frequent as mispairing (so that observed deletions represent no more than one half of the template switch events in that genomic location). We must also assume that gap generation, and template switching, occurs stochastically across the genome. DNA secondary structure may affect these processes, but information in this area is limited. We acknowledge that many of these assumptions are conservative. If template switching occurs in only a small fraction of gaps, or if mispairing occurs only in a small fraction of template switching events, the calculation will tend to underestimate the true frequency of gap generation and template switching. If the processes are not stochastic (e.g. they are affected by sequence context such that some feature of the repeats enhances gap formation at this location), the calculation will overestimate the true frequency.
Up to 8% of cells transformed with plasmid pSTL57 successfully underwent a deletion event to acquire resistance to tetracycline (using the protocol of Figure 3). The cells plated in the deletion assay had undergone approximately 62 cell generations/replication cycles from the moment of transformation prior to plating on tetracycline (See Methods: Growing a single transformed cell to the 107+ cells in a colony is about 25 generations; streaking out and growing single cells to a colony again is another 25 generations; inoculating a 2 ml overnight with 107 cells and growing to the 109 cells at stationary is another 7 generations, and diluting 1/100 and growing to an OD600 of 0.2 is approximately 5 generations). Thus, a deletion event occurred in 0.08/62 or 0.13% of the cells in each replication cycle. Assuming that this rate is constant throughout the experiment, the proportion of cells carrying deletions would approach 100% after ∼4000 generations (Figure 4A).
Examining the data presented in Figure 3, we noticed that deletion frequencies decreased as a function of the length of the repeat array used. This decrease is well approximated by an exponential decay function with a decay constant τ = 301 bp (Figure 4B). We reasoned that this decay in deletion frequencies likely occurred as the size of the repeat array became larger than the mean size of the gaps in which the deletions occurred. Gap sizes in vivo are likely to be heterogenous. As the size of the repeat array becomes larger, fewer gaps would be large enough to accommodate the array in its entirety; a key requisite for deletion under our model.
To explore this idea further, we carried out a series of simulations (Figure 4C), exploring how deletion frequencies scale with gap size, gap frequency and deletion probability (i.e. the probability that an array that falls entirely within a gap will produce a deletion). A schematic for the simulation approach is provided in Supplementary Figure S1. In line with our model, gaps were initiated at random locations within plasmids and were terminated stochastically, drawing from a normal distribution of gap lengths with 10% standard deviation around the mean. We note that if the deletion mechanism features template switching via strand invasion (utilizing an activity other than RecA), the results of Figure 4C may reflect the search radius of a 3′-DNA end undergoing template switching, rather than the size of the gaps. The exponential drop-off in deletion frequency with the increase in repeat distance has been noted before (albeit with strains undergoing much lower levels of deletion) (86,90,113), and attributed to a proximity effect.
In the simulations, deletion frequencies scaled linearly with both the gap initiation frequency (Figure 4D) and the deletion probability (Figure 4E). As with the experimental data, deletion frequencies decreased exponentially as a function of the repeat array length. In each case, fitting the data to an exponential function returned a decay constant τ that was approximately equal to the input gap size used in the simulations. As we expected, varying the input gap size changed the rate at which deletions decreased as a function of repeat array length (Figure 4F). In each case, the decay constant τ was approximately equal to the input gap size. Thus, the simulations supported the notion that deletion frequencies decrease as a function of repeat array size because the array becomes larger than most of the gaps that are present in vivo. Interpreting the experimental data under our model, the observed decay rate of 301 nt (Figure 4A) implies that mean size of gaps in vivo is close to 300 nt. In simulations, increasing the heterogeneity of gap size (i.e. increasing the standard deviation of the distribution from which gap sizes were drawn randomly) had no effect on measured decay constants, which continued to scale with the mean gap size.
In the simulations, deletion frequencies scale linearly with the gap frequency and the deletion probability. Thus for these parameters, a series of values produce deletion frequencies similar to those observed in the experimental data (when using an input gap size of 300 nt). The simulated data most closely resemble the experimental data when the following condition is met: gap frequency × deletion probability = 2 × 10⁻⁵ nt−1. At the assumed maximum deletion probability 0.5 (deletions capture no more than half of the template switching events), this corresponds to a gap initiation frequency of 4 × 10⁻⁵ nt−1; equivalent to one lagging strand gap being created for every 25 Okazaki fragments synthesized (assuming a mean Okazaki fragment size of 1000 nt). If the deletion probability was 0.1, this would require a gap frequency of 2 × 10⁻⁴ nt−1; or one gap for every five Okazaki fragments. However, it is important to point out that these estimates are derived under the assumption that gap creation is completely stochastic. Even a slight bias towards creating gaps at the site of the deletion array would significantly alter the outcome. Indeed, introduction of a hairpin structure within the repeat array, which is expected to promote gap creation, produced a dramatic increase in deletion frequencies relative to the standard deletion arrays (Figure 3, compare pMB302 results with others).
An independent assessment is provided in Figure 5, involving repeated sequences on the E. coli chromosome rather than a plasmid. This experiment employs 787 bp direct repeats that are directly adjacent, encompassing just under 2 kbp of DNA. A deletion across these repeats again results in tetracycline resistance. Prior to plating on tetracycline, cells undergo approximately 30 cell generations/replication cycles. When wild type cells harboring the deletions were plated, no TetR colonies appeared in three replicate trials when cells were plated undiluted (data not shown as the signal was zero). Cells with single uup or radD deletions also failed to yield TetR colonies. In cells lacking both uup and radD function, 0.07% of the cells had undergone the chromosomal deletion, or about one in 1400 cells. In 30 generations, this would amount to one template switch resulting in a deletion in every 42 000 cells, or 0.0024% per generation. This dataset is more limited, and was not used to carry out simulations. However, the results again suggest that deletions associated with postreplication gaps are a frequent genomic event. Notably, when the xerD gene is deleted as well as uup and radD in the experiment of Figure 5, so that chromosomal dimers resulting from crossovers cannot be resolved, the recovery of TetR colonies is reduced by 30-fold. This suggests that deletion induced by template switching is also often generating crossovers and chromosomal dimers, leading to cell death.
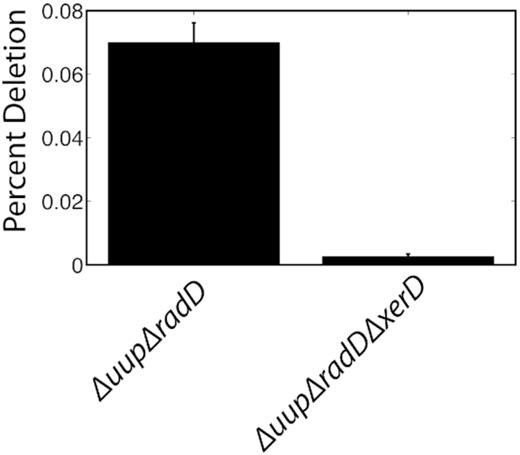
DNA deletion frequency between 787 bp repeats embedded on the E. coli chromosome. The repeats are separated by 1.4 kb and successful deletion confers tetracycline resistance; n = 10. A control with a wild-type genetic background is not included, as it generated no successful deletion events in three replicate trials. Assays were carried out as described in Materials and Methods.
RadD suppresses crossovers
A closer examination of the plasmids present in the tetracycline resistant survivor cells reveals another important feature of the reactions—the RadD protein specifically suppresses crossing over. Plasmids isolated from cells carrying pSTL74 (101 bp direct repeats separated by 1.4 kb) and that survive tetracycline exposure are shown in Figure 6. The few wild-type cells that survive have a mix of deleted and normal sized plasmids, indicating that the successful deletion events occurred in a portion of the plasmid copies present. In the larger number of survivors that lacked uup function, the deleted plasmids again exhibit a mix of normal sized and deleted plasmids. In both cases, some larger species are present that may represent multimers or replication intermediates. However, in either the ΔradD or ΔuupΔradD cells, the normal sized plasmids disappear, replaced by larger species. In Figure 1, it can be seen that resolution of the branched intermediates resulting from template switching can have noncrossover or crossover outcomes. A crossover will result in a dimeric plasmid. Additional crossovers in successive replication cycles can result in much larger plasmids. Repeat deletion in some of these can generate plasmids with a variety of sizes. All of the plasmids in cells lacking radD function are larger, indicating relatively frequent crossing over. The elevated levels of RecA-independent crossing over indicate that many, and perhaps most of the events leading to deletions, are not due to replication slippage. Instead, they require a template switch behind the replication fork leading to the kinds of branched intermediates behind the fork that can give rise to crossovers.
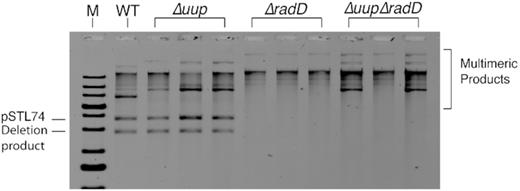
Plasmids isolated from TetR survivors from the assays in Figure 3, utilizing pSTL74 (101 bp direct repeats separated by 1.4 kb of DNA). Genetic backgrounds are indicated. Plasmid isolation and analysis are described in Materials and Methods.
Figure 7 demonstrates that the slower running bands in Figure 6 actually are larger plasmids rather than catenanes or some other species. Rapid isolation of plasmids in cells can generate a large amount of broken plasmids, especially if they are in the process of undergoing template switching and exchange reactions. In addition, fragments derived from broken genomic DNA are also present. For analysis by electron microscopy, we focused only on unbroken plasmid circles that were sufficiently separated from other DNA fragments that they could be traced and measured unambiguously. For both wild type and ΔuupΔradD cells, we measured at least 50 such molecules. The results demonstrate that virtually all of the plasmids present in the wild type survivors are monomeric or near monomeric in size. In the ΔuupΔradD cells, most of the plasmids are ∼2-fold larger, with much size variation. The results suggest that the RadD activity plays a significant role in suppressing crossovers.
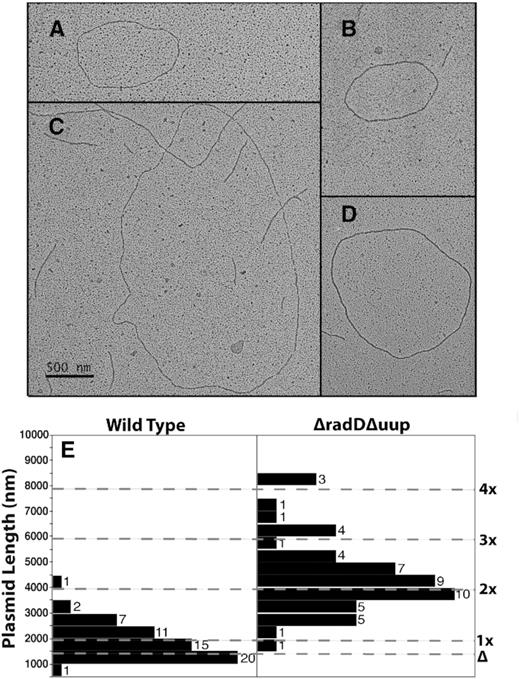
Visualization of plasmids from Figure 6 by electron microscopy. (A) An example of a plasmid with monomeric length attributes. (B–D) Examples of plasmids derived from survivors in a strain lacking uup and radD function. The magnification is the same in each panel, such that the scale bar in panel C applies to all panels A–D. (E) Measurements of plasmids derived from TetR survivors of the deletion assay, from wild type and ΔuupΔradD genetic backgrounds as indicated. Measurements were carried out as described in Methods. The expected lengths of a monomeric copy of pSTL74 and a deleted version of pSTL74 are indicated. Lines above indicate expected lengths of dimeric, trimeric, etc. versions of pSTL74 lacking deletions.
Loss of RadD and Uup results in repeat expansion as well as deletion
We also examined the strains lacking RadD and Uup function for repeat expansion, using a plasmid-based assay described earlier. Loss of RadD and Uup results in repeat expansion as well as deletion. In this assay, repeat expansion involves a plasmid with a pair of 787 bp repeats, and recombination between them leads to acquisition of tetracycline resistance only if expansion to three or more repeats occurs (91). Deletion is not measured or detected in this assay. Expansion occurred at a frequency of 1.4 × 10⁻⁵ for ΔrecA cells, similar to rates reported earlier (91). The ΔuupΔradDΔrecA strain produced expansions at a frequency that was about ten-fold higher, 1.5 × 10⁻⁴ (n = 28 for both trials). This is likely to be an underestimate of frequencies in the cells lacking RadD and Uup. High rates of deletions in these cells (undetected in the assay) would render expansion impossible. The effects single deletions of the uup or radD genes, were not assessed. Combined with the crossovers associated with the RecA-independent repeat deletions, this provides another outcome that cannot be readily explained by a simple replication slippage mechanism.
Loss of Uup and RadD functions leads to cell filamentation and nucleoid mis-segregation
If gap generation and template switching is occurring frequently, the absence of uup and radD function could in principle be highly toxic. Toxicity would arise if template switching leads to crossing over and cells are defective in resolving chromosomal dimers via the xerCD/dif system. In the experiment of Figure 8A, a series of strains with deletions of uup, radD, and xerD, singly or in combination, are grown and plated in serial dilution. No apparent growth defect on LB media is noted, even with all three genes are missing. Growth rates monitored by optical density at 600 nm were also similar (data not shown). However, an effect of the uup and radD deletions becomes evident when the cells are examined directly by microscopy (Figure 8B). Wild type cells exhibit an average length of just over 4 μm. Elimination of radD function produces some filamentation, increasing the average cell length to over 5 μm, with a few cells over 20 μm. The average length jumps more substantially when uup function is missing, to over 7 μm. A few Δuup cells are over 50 μm in length. Elimination of uup and radD function together produces a synergistic increase in average cell length to over 11 μm, with significant numbers now over 50 μm.
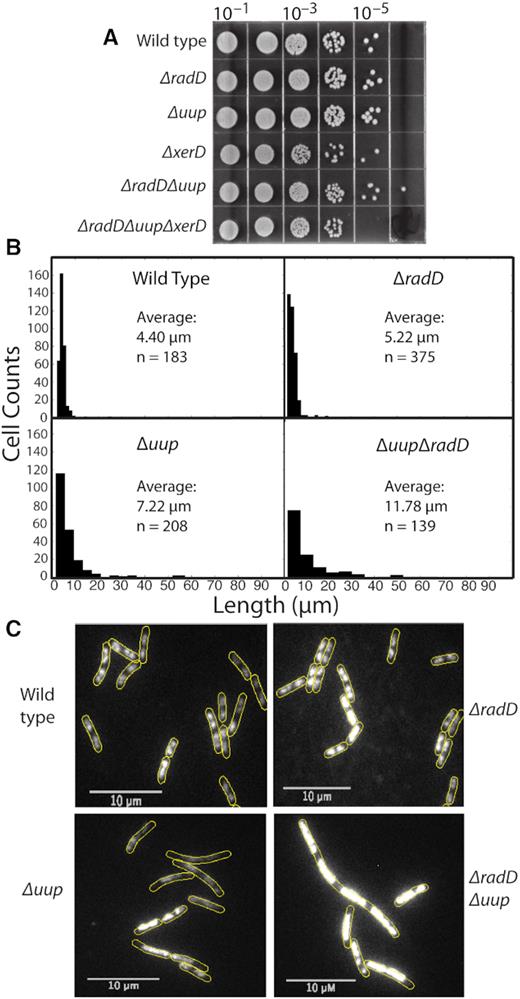
Loss of Uup and RadD function affects cell division. (A) Spot plates of strains with different genetic backgrounds in the absence of environmental stress. Successive 10-fold dilutions of overnight cultures are as indicated. (B) Histograms showing cell length distributions in unstained cells. The number of cells included in the histograms are noted in each panel. (C) Micrographs of cells from a separate experiment, stained with SYTOX orange to visualize nucleoids as described in Methods. Analysis of nucleoid positioning is provided as intensity profiles and an autocorrelation analysis in Supplementary Figures S3 and S4, respectively. Growth curves of all strains under the conditions used to visualize nucleoids with SYTOX Orange are provided in Supplementary Figure S2.
We examined the cells further to determine if the evident filamentation reflected a defect in nucleoid segregation. To visualize nucleoids, exponentially growing cells were stained with SYTOX orange. This dye was chosen as its use does not affect cell growth (105; see Supplementary Figure S2). Fluorescence intensity was measured across the long axis of over 150 cells for each strain (see Methods and Supplementary Figure S3 legend) chosen at random. Wild type and ΔradD strains exhibit a very similar bimodal distribution of nucleoid positioning (Supplementary Figure S3), a status that was also evident by eye (Figure 8B). Cells lacking uup show a flattened distribution across the cell, indicating incomplete nucleoid separation consistent with a partitioning defect. This was also evident by eye. The ΔuupΔradD mutant had its bimodal shape restored in the intensity profile. However, in this case the result is somewhat misleading. Many of the cells averaged into the profile exhibit multiple large regions of DNA within filamented cell structures. Overall intensity across the cell is increased 2-fold compared to wild type, even within the slight decline that renders the plot apparently bimodal. SYTOX staining images (Figure 8B) clearly show the loss of defined nucleoids in many Δuup cells. Although cells lacking RadD appear normal, the loss of RadD exacerbates the defect seen in Δuup strains. The elongated cells lacking both uup and radD function have multiple large regions of DNA that do not exhibit the same compact conformation of those in wild type. These DNA regions are visibly brighter; their positions within the elongated cells suggest abortive attempts at nucleoid segregation and cell division.
To further characterize this apparent nucleoid mis-segregation, we calculated the autocorrelation functions for each cell intensity profile and compared the mean of these functions to each other. This allows the characteristic widths of nucleoid features (along the cell long axis) to be compared between strains (Supplementary Figure S4A). Compact, well-segregated nucleoids would be expected to produce a characteristic signature in the autocorrelation at a 1–2 μm lengthscale. Larger, non-segregated nucleoids would be expected to produce characteristic signatures in the 3–6 μm lengthscale. The sharper, narrower autocorrelation function observed for both wild-type and ΔradD strains indicates that both strains have distinct and well-segregated nucleoids (Supplementary Figure S4B). The broader autocorrelation function observed for cells lacking uup indicates that the nucleoids present in these cells are mis-segregated and more likely to be on the scale of 3–4 μm. This result suggests that Uup is involved in the correct segregation of nucleoids. Interestingly, when both uup and radD are knocked out the autocorrelation function becomes broader again, indicative of nucleoid features on the scale of 5–6 μm. The results indicate that even though growth appears to be normal or nearly so, a defect in nucleoid segregation that affects normal cell division is present in these mutants. Although no defect is evident in strains lacking RadD, the defect associated with a uup deletion is exacerbated when radD is also deleted.
Loss of RadD and Uup function confers sensitivity to nitrofurazone and ciprofloxacin
The RadD and Uup proteins initially came to our attention because loss of either function conferred sensitivity to ionizing radiation (114). A primary effect of ionizing radiation is the generation of reactive oxygen species in water (115). A subsequent examination of the loss of radD function in vivo demonstrated a sensitivity to higher levels of ciprofloxacin (96). In Figure 9, we more broadly explore the sensitivity of strains lacking uup or radD function to DNA damaging agents. Loss of either or both functions has little or no effect on sensitivity to UV irradiation or bleomycin. In contrast, strains lacking RadD function were sensitive to higher concentrations of ciprofloxacin as reported before, an effect that was enhanced when xerD was also absent. The loss of Uup or RadD did not seem to affect sensitivity to nitrofurazone (NFZ). However, the additional loss of xerD produced an effect much greater than loss of any one of the three genes. We hypothesize that IR, ciprofloxacin, and NFZ may all generate types of DNA damage that increase the rates of gap generation and template switching, thereby increasing the formation of crossover-derived chromosomal dimers that require XerCD/dif for resolution.
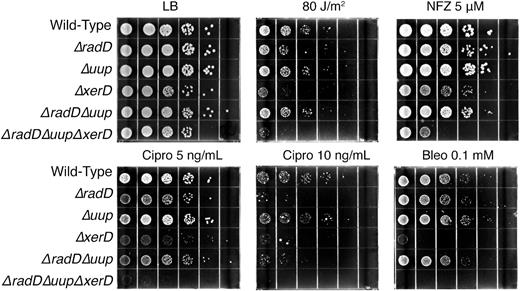
Sensitivity of uup and radD mutants to DNA damaging agents. Deletions of xerD are included in some genetic backgrounds. Spot plates with the indicated concentrations of DNA damaging agents. LB is Luria broth media. NFZ, Cipro, and Bleo are nitrofurazone, ciprofloxacin, and bleomycin, respectively.
RadD and Uup bind to branched DNA structures
In Figure 10, we demonstrate that Uup and RadD each independently bind to branched DNA structures, albeit different ones. The RadD protein binds to structures with three DNA branches, resembling replication forks. A three-way junction is bound with the highest affinity. Holliday junctions are not bound to a measurable extent. The Uup protein binds to Holliday junctions. Neither protein exhibits detectable binding to linear duplex DNA. The estimated Kd values in each case are in the low μM range. Affinities are limited such that the binding curves in experiments such as that in Figure 10A cannot be completed so as to reach saturation and more accurately estimate Kd.
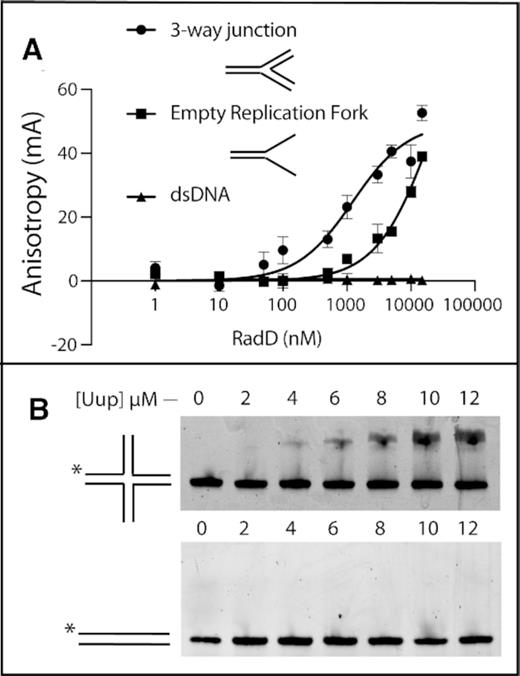
DNA binding activities of (A). RadD protein via fluorescence anisotropy. Branched DNA substrates are illustrated. (B) Uup protein via EMSA.
Two tests suggest that Uup or RadD are not involved in gap generation
We considered whether the phenotypes of the radD and uup deletions might be due to excessive formation of postreplication gaps, suggesting a role in their generation. We separately tested strains with deletions in radD, uup, or both for increases in RecFOR-dependent recombination measured in a plasmid crossover recombination assay between pSTL330 and pSTL336 (103). None of these mutant strains produced a detectable increase in RecFOR-mediated recombination (Figure 11A), providing no indication that the Uup or RadD proteins were involved in generating gaps.
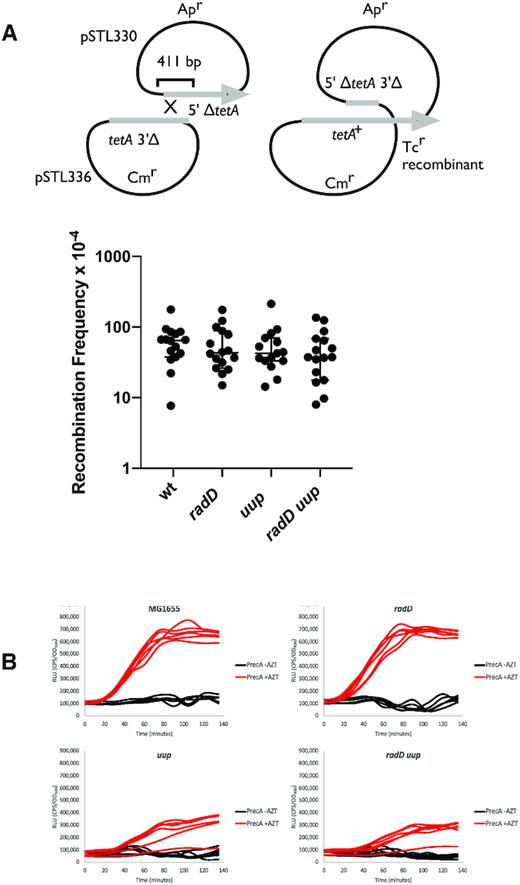
Uup and RadD are likely not involved in gap generation. (A) Effects of RadD and Uup function on RecFOR-mediated recombination. The intermolecular recombination illustrated in the top panel is dependent upon RecFOR (103). Recombination frequencies are shown for wild type, along with mutant strains lacking uup, radD or both. (B) SOS induction measured by recA promoter fusion to a luxCDABE operon (92) during growth with and without azidothymidine (AZT). Relative luminescence units (RLU) are the luminescence per second normalized to OD600 of the cultures, either exposed (red) or not exposed (black) to AZT at time 0. SOS induction by AZT is dependent on RecFOR (127).
In addition, we examined the cells for induction of the SOS response, which might be enhanced if gap formation increased. The MG1655 strains with a radD deletion exhibited no increase or change in SOS induction relative to wild type cells (Figure 11B). Cells lacking uup function exhibited an apparent decline in SOS induction, with a delay in the appearance of the SOS signal. Overall, we did not find evidence that either RadD or Uup were involved in gap generation.
DISCUSSION
The present work leads to five main conclusions: (i) The generation of postreplication gaps, and template switching within them, is a surprisingly common byproduct of DNA replication. These events may occur multiple times during a typical bacterial replication cycle. Postreplication gaps thus make a much more substantial contribution to bacterial DNA metabolism than the low frequency of genetic events associated with them to date might suggest. The events are accompanied by a high level of crossing over, as well as increases in repeat expansion, both hallmarks of a template switching process (21). The events we are measuring in most of the experiments are occurring in the absence of added DNA damaging agents, during normal growth. They reflect replisome encounters with spontaneous DNA lesions, occasional replication mistakes, or both. (ii) The frequency of postreplication gap formation and template switching is normally masked by the RadD and Uup proteins. In wild type cells, deleterious genome rearrangements are quite uncommon, and chromosome segregation proceeds normally in most cells. When RadD and Uup are missing, levels of crossing over (Figures 2, 6, 7 and 9), repeat deletion (Figures 2 and 3), and repeat expansion (data presented in Results section text) increase substantially. Coupled to the cell filamentation and nucleoid mis-segregation seen in cells lacking Uup (Figure 8 and Supplementary Figures S3 and S4), and the DNA binding properties of these two proteins (Figure 10), we posit that RadD and Uup are most likely involved in the resolution of branched DNA intermediates arising from template switching in postreplication gaps. The proteins may function in other contexts as well. The RecA-independent deletion reactions between direct chromosomal repeats we are measuring have previously been associated with template switching (21). (iii) The RadD and Uup proteins operate in pathways that are at least partially distinct. Loss of both functions results in a synergistic increase in RecA-independent deletion events, and cell filamentation also increases when both activities are absent. (iv) RadD specifically suppresses crossovers arising from the resolution of branched intermediates of template switching. Elimination of RadD results in the formation of a range of multimeric species in a plasmid-based deletion assay. (v) As mentioned above, loss of Uup leads to a defect in nucleoid segregation that is exacerbated when RadD is also lost.
RadD and Uup together render most template switching events genetically silent. Loss of these two functions provides a new point of entry to further elucidate this under-scrutinized aspect of DNA metabolism.
We note that the major results of Figures 2 and 3 involve a plasmid-based assay and could to some extent reflect some peculiarity of plasmid replication. More work is needed to address chromosomal replication. However, the results of Figure 5 begin to extend these results to the chromosome. The sensitivity of the ΔradDΔuup mutants to nitrofurazone and ciprofloxacin in the absence of xerD function (Figure 9) also suggest a high level of crossing over that must be dealt with by XerD.
Some of the deletion events that we are measuring could result from replication slippage, as shown in Figure 1C, and one possibility is that RadD and/or Uup could suppress such events. Events of this type would also occur independently of RecA protein. However, simple replication slippage would not generate crossovers or repeat expansions. The elevated levels of crossovers observed directly or indirectly in this work (Figures 2, 6, 7 and 9) indicates that a large proportion of the events we are measuring in the deletion assay involve the kind of RecA-independent template switching that would generate branched DNA intermediates behind the fork, as described previously (21). The repeat expansions reported in the text reinforce this view. Coupled to what is known so far about Uup and RadD structure and function (next paragraph), a role in suppression of replication slippage seems unlikely.
The results reported here, and the structures of these proteins, provide some important clues as to the function of these two still enigmatic proteins. The Uup protein has two ATPase domains, and belongs to a family of proteins that also includes the bacterial UvrA protein. UvrA has a DNA scanning function, binding to bulky lesions when detected and recruiting the UvrB and UvrC proteins for nucleotide excision repair (116–118). Strictly by analogy, we hypothesize that Uup has a DNA scanning function that searches for and binds to branched DNA intermediates, particularly the Holliday junctions that it binds to (Figure 10). The potential for Uup to recruit other proteins to these sites remains to be explored. RadD protein is part of a family of helicase proteins that includes RecQ and RecG. As RadD suppresses crossovers, we hypothesize a role that may be analogous to the double Holliday junction dissolution activity of BLM-TopoIIIα-RM1-RM2 in vertebrates (119–121) or Sgs1–Top3–Rmi1 complex in yeast (122,123). We note that the E. coli RecQ helicase will not function in the dissolution of double Holliday junctions (120). The RadD protein binds with highest affinity to DNA structures with three branches (Figure 10), but helicase activity has not yet been demonstrated.
Uup and RadD have not previously been associated with any major DNA repair path, and their functions have remained obscure. We introduce them here as enzymes that have served to render the process of DNA template switching genetically silent, although one or both proteins may function in other contexts as well.
The assessment of the frequency of DNA template switching provided here represents only a first effort, and its accuracy is limited by a lack of information about several key parameters. The simulations provide two items of information: estimated gap size and estimated gap generation frequency.
If our assumption that gaps must span the repeat array that is used for deletion is true, the estimate of average gap size, ∼300 nucleotides, is likely the more reliable parameter. The same gap size was derived from multiple datasets and remained consistent throughout the simulations. However, template switching presumably involves strand invasion of the 3′-ending strand at one end of the gap with the sister chromosome. The initial mis-paired strand invasion leading to a deletion may occur whether or not both repeat sequences are exposed in the gap. It is nonetheless likely in this instance that gap size still plays a role in determining whether template-switch deletions occur. Deletion frequencies would likely scale exponentially with gap size. Alternatively, the 300 nucleotides may reflect the search radius of the template-switching DNA end rather than an actual gap size. As the events are RecA-independent, we do not know what activity might promote the strand invasion. Previously, an exponential drop-off with repeat distance has been noted (86,90,113) and attributed to a proximity effect. In one previous study (and potentially the current study—resolution is insufficient to tell) this drop-off follows a two-exponential decay (86,90,113), which is not fully explained by either the gap-size model or the proximity model in their current forms.
The gap generation frequency estimate is subject to considerable uncertainty. If template switching is uncommon in gaps, or if most template switches do not produce a deletion in the absence of RadD and Uup, then the high frequencies reported here would actually be an underestimate. If gaps are not generated stochastically (e.g. if there is some sequence feature that triggers gap formation near our engineered repeat arrays), the frequency may be overestimated.
The primary value of this exercise is to highlight the likely prominence of this process. Based on the frequency of gap-associated deletions that occur when RadD and Uup are not present, we suggest that postreplication gaps make a much more substantial contribution to DNA metabolism than currently appreciated – perhaps being generated multiple times in a typical cell cycle under normal growth conditions.
As a guide to further investigation, we suggest the following scenario. During normal bacterial growth on rich media, the generation of postreplication gaps is relatively common and may occur multiple times in the average replication cycle. RecA independent template switching also occurs often and may be a major path of gap filling. Loss of Uup and RadD function does not reduce apparent growth rates or viability, but the double mutant exhibits substantial cell filamentation and nucleoid mis-segregation in the absence of added DNA damaging agents. The filamentation may reflect frequent template switching, generating crossovers and attendant problems in chromosome segregation. These two proteins may also take part in additional processes. For example, in Vibrio cholerae, RadD has recently been implicated in the processing of R-loops (124). The process of gap generation and template switching produces a readily detected rate of chromosomal deletion between direct repeats. Substantial toxicity is associated with loss of these two proteins only when particular DNA damaging agents are introduced. Different DNA damaging agents may generate gaps with different properties (e.g. different types or positions of lesions within the gaps), or gaps in which different pathways of gap filling may predominate.
SUPPLEMENTARY DATA
Supplementary Data are available at NAR Online.
ACKNOWLEDGEMENTS
The Authors gratefully acknowledge use of facilities and instrumentation supported by NSF through the University of Wisconsin Materials Research Science and Engineering Center (DMR-1720415). The authors also thank Thomas F.J. Martin and his laboratory for use of the Metamorph software used for electron microscopy measurements.
FUNDING
National Institutes of Health [GM32335 to M.M.C., RM1 GM130450 to M.M.C. and A.v.O., R01 GM51753 to S.T.L.]; Australian Research Council (Laureate Research Fellowship to A.v.O.); National Health and Medical Research Council [APP1165135 to A.R. and A.v.O.]. Funding for open access charge: National Institutes of Health [RM1 GM130450].
Conflict of interest statement. None declared.

Comments