


Abstract
Small angle X-ray scattering (SAXS) is an increasingly common technique for low-resolution structural characterization of molecules in solution. SAXS experiment determines the scattering intensity of a molecule as a function of spatial frequency, termed SAXS profile. SAXS profiles can contribute to many applications, such as comparing a conformation in solution with the corresponding X-ray structure, modeling a flexible or multi-modular protein, and assembling a macromolecular complex from its subunits. These applications require rapid computation of a SAXS profile from a molecular structure. FoXS (Fast X-Ray Scattering) is a rapid method for computing a SAXS profile of a given structure and for matching of the computed and experimental profiles. Here, we describe the interface and capabilities of the FoXS web server (http://salilab.org/foxs).
INTRODUCTION
SAXS is becoming a widely used technique for low-resolution structural characterization of molecules in solution (1–6). Unlike EM, NMR and X-ray crystallography, the key strength of SAXS is that it can be performed under a wide variety of solution conditions, including near physiological conditions. The experiment is performed with ∼1.0 mg/ml of a macromolecular sample in a ∼15 μl volume, and usually takes only a few minutes on a well-equipped synchrotron beam line (4). The SAXS profile of a macromolecule, I(q), is computed by subtracting the SAXS profile of the buffer from the SAXS profile of the macromolecule in the buffer. The profile can be converted into an approximate distribution of pairwise atomic distances of the macromolecule (i.e. the pair-distribution function) via a Fourier transform.
Computational approaches for modeling a macromolecular structure based on its SAXS profile can be classified into ab initio and rigid body modeling methods (3). On the one hand, the ab initio methods search for coarse 3D shapes represented by dummy atoms (beads) that fit the experimental profile (7–9). On the other hand, rigid body modeling approaches refine an atomic model of the molecule with the aim to fit the computed SAXS profile to the experimental one (10). Therefore, rigid body modeling can be used only if an approximate structure of the studied molecule or its components are available.
Rigid body modeling approaches require the computation of the SAXS profile of a given atomic structure and its comparison with the experimental profile. Here, we describe a web server (FoXS) that performs this task. FoXS can be used as a tool for numerous SAXS-based modeling applications, such as comparing solution and crystal structures (4), modeling of a perturbed conformation (e.g. modeling active conformation starting from non-active conformation) (11), structural characterization of flexible proteins (12,13), assembly of multi domain proteins starting from single domain structures (14), assembly of multi protein complexes (10), fold recognition and comparative modeling (15,16), modeling of missing regions in the high-resolution structure (17), and determination of biologically relevant states from the crystal (18,19).
There are several methods and software tools for calculating a SAXS profile of a given molecular structure. The methods differ in the use of the inter-atomic distances and in the treatment of the solvation layer (20). Inter-atomic distances can be computed and used explicitly (5,14). The most popular method CRYSOL (21), also available as a web server, uses multipole expansion for fast calculation of the spherically averaged scattering profile. Another widely used approach is Monte Carlo sampling of the distances in the model (22). Coarse graining that combines several atoms in a single scattering center can also be used to speed up the calculation (23,24). The solvation layer can be treated explicitly by introducing water molecules (24,25) or implicitly by a continuous envelope surrounding the model (21).
FoXS is a rapid and accurate web server for calculating a SAXS profile of a given molecular structure that explicitly computes all inter-atomic distances as well as models the first solvation layer based on the atomic solvent accessible areas. The server also provides an optimization of the hydration layer density as well as the excluded volume of the protein, to maximize the fit of the computed profile to the experimental profile. Additional optimization is achieved by adjusting the ‘background’ of the experimental profile for wider scattering angles (26). Next, we describe the method implemented in FoXS and its interface.
FOXS METHOD

FoXS was successfully tested with all PDB structures (30) that have an experimental SAXS profile in the open access SAXS database (http://bioisis.net/) (4) as well as a number of additional cases (in preparation).
FOXS WEB SERVER
The web server has one mandatory input, a structure file in the PDB format (or a zip archive with multiple PDB files). The server assigns form factors for the standard PDB protein and nucleic acid atoms. For other types of molecule, the form factors are assigned using the element field in the PDB format. Hydrogen atoms are considered implicitly for proteins and nucleic acids by adding their form factors to that of their bound heavy atom. If the input structure includes other groups, such as lipids or sugars, it is recommended to add all the hydrogens explicitly and turn off the ‘implicit hydrogens’ option on the FoXS input form.
The optional input includes an experimental SAXS profile, which must be obtained for the exact molecule specified in the input PDB file (including all loops, linkers and His tags). The profile is specified in a text file with three columns:
q, I(q), σ(q) where q = (4πsinθ)/λ, 2θ is the scattering angle and λ is the wavelength of the incident X-ray beam. It is recommended to provide an accurate error estimate of σ(q) because it is used for the profile fitting. If the third column is not given, FoXS will assume the error is distributed according to the Poisson distribution with λ = 10.
# q intensity error
0.00000 3280247.73 1904.037
0.00060 3280164.59 1417.031
0.00120 3279915.19 1840.032
The server also has several optional input parameters. A user can specify an e-mail address for emailing a link to the results page. Maximal q value determines the range for calculating the profile (default qmax = 0.5 �−1). A user can also control the sampling resolution of the profile by setting the number of points in the profile. The profile will be sampled at the resolution equal to the maximal q value divided by the number of profile points. For example, if the qmax value is 0.5 �−1 and a user asks for 1000 profile points, the resulting profile will be uniformly sampled at the interval of 0.0005�−1. In addition, a user can also decide whether or not to include the hydration layer in the profile computation (included by default). It is also possible to decide whether or not to adjust the excluded volume of the protein (c1 value—adjusted by default) and the background of the experimental profile (not adjusted by default).
Once the inputs are defined, FoXS computes the SAXS profile of the input PDB structure(s) and fits it to the experimental profile, if provided. For fitting, the computed profile is resampled at the q values sampled by the experimental profile, with the computed intensities estimated using linear interpolation. The server does not modify the input experimental profile, unless background adjustment is requested.
The computation is performed in real time and the server page is updated once the calculation has finished. The typical running time is less than a second for a system of a thousand of atoms, and can extend to a few minutes for tens of thousands of atoms.
The output page displays a plot of the computed profile as well as a plot of the computed profile fitted to the experimental profile (Figure 1). In addition, the values of χ, c1 and c2 for the current profile fit are displayed. The profiles and their fit can be downloaded. In case of multiple PDB files in the input, the server will display computed profile plots for each PDB file, as well as plots with their fit to the experimental profile. In addition, a single plot with all the computed profiles and a plot with computed profiles fitted to the experimental profile are displayed.
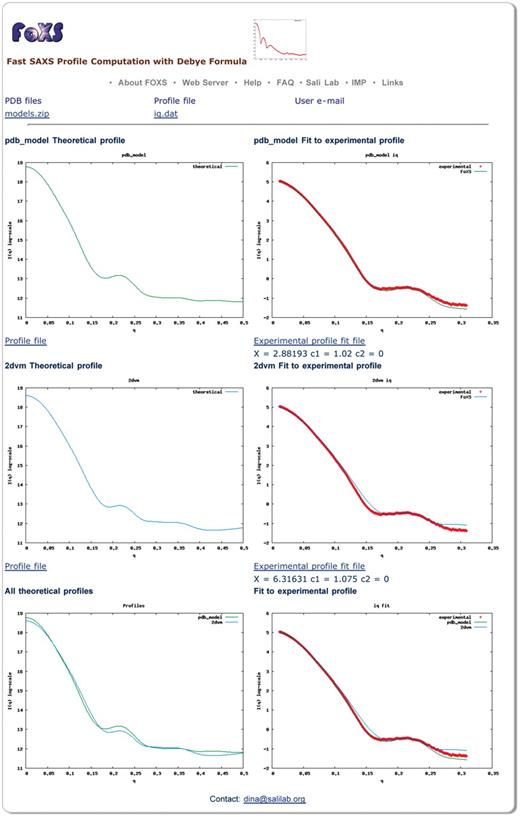
Snapshot of a FoXS output page. Computed profiles of two PDB files are compared to the experimental SAXS profile of malic enzyme (data from http://bioisis.net/, PF1026). The first structure (pdb_model) includes a model of the unfolded His tag region (35 residues), while the second structure (2dvm) does not. The server was run with the default parameters and the hydration layer modeling was disabled. Plots on the left display the theoretical profiles and plots on the right display their fit to the experimental profile. The top two plots are for the structure with the modeled unfolded region (pdb_model), the middle two plots are for the original PDB file (2dvm), the bottom left plot overlay the profiles for the two input structures, and the bottom right plot shows their fit to the experimental profile. The structure with the modeled unfolded region shows a better fit to the experimental profile with the value of χ = 2.88, compared to χ = 6.33 for the original crystallographic structure. The user can follow the links to download the computed profiles and their fittings.
CONCLUSIONS
A SAXS profile can provide significant insight into the structures of macromolecules, especially when combined with other information. SAXS experiments are gaining in popularity due to the technological advances that allow rapid and accurate data collection for a relatively small amount of the sample. Rapid and accurate computational methods are required for interpretation of the SAXS profiles. Here, we described a rapid, accurate, and user-friendly web server for calculating a SAXS profile of a given atomic structure and its fitting to the experimental profile. The web server can be used in a wide range of SAXS, such as comparing solution and crystal structures, modeling of a perturbed conformation (e.g. modeling active conformation starting from non-active conformation), structural characterization of flexible proteins, assembly of multi domain proteins starting from single domain structures, assembly of multi protein complexes, fold recognition and comparative modeling, modeling of missing regions in the high-resolution structure, and determination of biologically relevant states from the crystal.
FUNDING
Weizmann Institute Advancing Women in Science Postdoctoral Fellowship to DSD; Sandler Family Supporting Foundation, National Institutes of Health (R01 GM083960); National Institutes of Health (U54 RR022220); National Institutes of Health (PN2 EY016525); DOE program Integrated Diffraction Analysis Technologies (IDAT), Pfizer Inc. SIBYLS beamline at Lawrence Berkeley National Laboratory. Funding for open access charge: National Institutes of Health (R01 GM083960).
Conflict of interest statement. None declared.
ACKNOWLEDGEMENTS
The authors are grateful to Dr Hiro Tsuruta for discussions about SAXS. The authors thank Ursula Pieper for help with the server setup. The authors are also grateful for computer hardware gifts from Ron Conway, Mike Homer, Intel, Hewlett-Packard, IBM and Netapp.

Comments