


Abstract
Evolutionary conservation analyses are important for the identification of protein–protein interactions. For protein complex structures, sequence conservation has been applied to determine protein oligomerization states, to characterize native interfaces from non-specific crystal contacts, and to discriminate near-native structures from docking artifacts. However, a user-friendly web-based service for evolutionary conservation analysis of protein complexes has not been available. Therefore, we developed ConPlex (http://sbi.postech.ac.kr/ConPlex/) a web application that enables evolutionary conservation analyses of protein interactions within protein quaternary structures. Users provide protein complex structures; ConPlex automatically identifies protein interfaces and carries out evolutionary conservation analyses for the interface regions. Moreover, ConPlex allows the results of the residue-specific conservation analysis to be displayed on the protein complex structure and provides several options to customize the display output to fit each user’s needs. We believe that ConPlex offers a convenient platform to analyze protein complex structures based on evolutionary conservation of protein–protein interface residues.
INTRODUCTION
Functionally important amino acids in a protein sequence are conserved through selective evolutionary pressure, such as constraints on protein folding, involvement in enzymatic activity, and the maintenance of ligand binding or protein–protein interactions. Evolutionary conservation analyses have been widely applied to characterize functionally/structurally important residues, to identify protein–protein interfaces, or to predict interactions between a protein and its ligand (1–3). Various methods to automatically calculate conservation scores from the primary amino-acid sequences or protein structures have been developed. Rate4Site was developed to identify functionally important regions in proteins by estimating the evolutionary rates of each amino acid among homolog proteins (2). Based on Rate4Site, a web-based tool, called ConSeq, was introduced to perform conservation analysis of protein sequences (4). Furthermore, ConSurf was developed to enable automation of the conservation analysis of protein tertiary structures (a single chain of a protein structure) (5,6).
When it comes to protein ‘quaternary’ structures, evolutionary conservation analysis has been successfully applied to predict interfaces of protein complex structures. For example, McCammon’s and Thornton’s groups showed that analyses of protein interface conservation is effective for the identification of protein oligomerization states and discrimination of true oligomeric contacts from non-specific crystal contacts (7,8). Additionally, our previous study proved that protein interfaces are more conserved than the rest of the surface (ROS) and revealed that docking artifacts could be effectively eliminated by comparing conservation levels between the interface and the ROS in a protein docking complex (9). Furthermore, Guharoy and Chakrabarti demonstrated that within a protein–protein interface measuring the distinct conservation levels between fully buried residues upon binding (core) and partially buried residues (rim) is an effective means to discriminate biological interfaces from crystal contacts, because core residues are significantly more conserved than the rim residues (10). Therefore, a web application that automatically identifies interface, ROS, core and rim residues within protein complex structures, and calculates evolutionary conservation scores for these residues would be very useful for characterizing protein oligomerization states, identifying native interfaces from crystal contacts, and discriminating near-native structures from docking decoys.
In this report, we present the ConPlex server for evolutionary conservation analyses of protein complex structures. With ConPlex, the user inputs protein complex structures and the server automatically calculates position-specific conservation scores based upon evolutionary relationships among the query protein and its homologs. Then, ConPlex finds protein interfaces and other biologically important regions of the protein quaternary structure. By mapping the calculated residue-specific conservation scores onto the complex structure, ConPlex enables users to comprehensively analyze the evolutionary conservation of the protein interface, surface, rim and core regions. The results of the evolutionary conservation analyses are displayed on the 3D structures with a user-friendly interface. The ConPlex server also provides users with the results of each intermediate calculation, including compilation of primary amino acid sequences homologous to the query, a multiple sequence alignment, and the residue-specific evolutionary score. Finally, ConPlex has a flexible output display and an ability to use two different visualization scripts for further analyses on a user’s own computer. We believe ConPlex will be an essential web tool for protein biochemists in a wide range of fields, such as experimental biology and bioinformatics, to assess protein complex structures based on evolutionary conservation.
METHODS
A brief description of the methodology is provided here. More detailed information is available at http://sbi.postech.ac.kr/ConPlex/, under the ‘Instructions’ and ‘Output Example’ menus.
ConPlex input
ConPlex takes input as protein complex structures in a Protein Data Bank (PDB) format and chain identifiers indicating interacting partners. Users can either upload the PDB format file or input the four-letter PDB accession number. For evaluation of protein docking models, ConPlex also allows users to upload multiple docking decoys in a compressed file.
ConPlex protocol
Using a protein complex structure as an input, ConPlex automatically carries out the following processes itemized below (Figure 1). To analyze the evolutionary conservation of the protein complex, ConPlex performs two separate calculations; (i) residue-specific conservation scores and (ii) interface residue identifications. Then, the results from these two separate calculations are integrated to perform more detailed analyses.
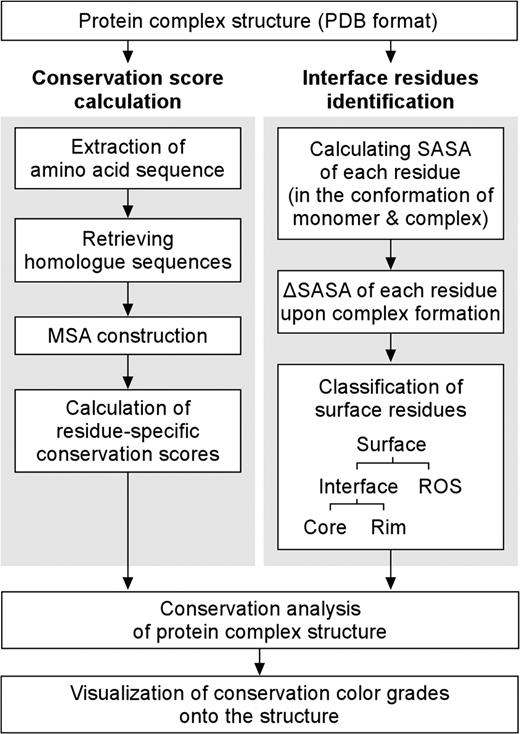
A flow chart of the ConPlex calculation processes.
To calculate the sequence conservation scores, the amino-acid sequence of each chain is extracted from the PDB file.
Based on the extracted sequence, homolog sequences are collected from the SWISS-PROT database (11) using PSI-BLAST (12). For identification of homologous sequences both E-values and sequence identities are considered. The default E-value cutoff is 0.001, and only proteins having sequence identity over 20% with the query sequence were selected. Cutoff values are adjustable through the advanced options. If insufficient numbers of homologs are identified, then additional PSI-BLAST iterations can be carried out. The default cutoff for the minimum number of homologs is five and default PSI-BLAST iteration number is one; however, both values are adjustable through advanced options.
A multiple sequence alignment (MSA) of retrieved homolog sequences is constructed by MUSCLE (13), which is one of the most rapid and accurate sequence alignment programs available (14).
Using the MSA, residue-specific conservation scores are calculated by Rate4Site (2), a tool that determines the evolutionary rate of each amino-acid positions using the maximum likelihood principle.
ConPlex simultaneously identifies interface residues from the query protein complex structure. Solvent accessible surface area (SASA) of each residue is calculated for both the monomer and complex states (9). Based on differences in the SASA for each residue upon binding (ΔSASA), surface residues are classified into interface and ROS. If the ΔSASA of a residue is >1 �2, then the residue is classified as an interface residue as used in other studies (8,15).
Interface residues are sub-classified into core and rim residues based upon following criteria: if a SASA of a residue after complex formation is <10 �2, then it is defined as a core residue (fully buried interface residues), otherwise it is classified as a rim residue (partially buried interface residues). The SASA thresholds for core and rim residues are adjustable through advanced options.
- Evolutionary conservation analyses of the protein complex structure are carried out by combining the identified interface residues and residue-specific conservation scores. The conservation score of the protein interface (CSVint), ROS (CSVros) and core (CSVcore), rim residues (CSVrim) are calculated as described in our previous study (9).

where i indicates the residue in the region of interest, ΔSASAi is the SASA of residue i that becomes buried upon binding, and CSVi is the conservation score of residue i. In case of residues in the ROS, where ΔSASAi = 0, SASA of unbound state would be calculated instead. The weighted average of conservation score of all residues participated in the defined region (i.e. interface, ROS, rim and core) was considered. All the defined regions are basically surface patches that are composed of the residues whose ΔSASAi is >1 upon complex formation. The size of the patch is the sum of ΣΔSASAi, where each residue i contributes to the patch size by its ΔSASAi– In this way, we could weigh the contribution of each residue by its relative contribution to the total solvent accessible area of each defined region [see (7,9) for more details]. Note that a smaller CSV means a more conserved region (9).
- The ratios of the conservation level between interface and ROS residues [CSVratio(int,ROS)] and between core and rim residues [CSVratio(core,rim)] are calculated as follows:

For example, if CSVratio(int, ROS) is <1, the protein interface is considered evolutionary more conserved than the ROS. Otherwise, the protein interface is considered less conserved than the ROS.
Finally, the results from the conservation analyses are displayed on the 3D structure. Normalized residue-specific conservation scores are projected onto each residue in the protein complex structure using a 20-color gradient, from red (conserved) to blue (variable). Interface residues of each chain are represented as spheres.
Advanced input options
ConPlex provides a variety of advanced input options such as customizing the PSI-BLAST E-value cutoff, sequence identity cutoff, minimum/maximum number of homologs required, the maximum PSI-BLAST iteration number and core/rim SASA cutoff. Most advanced input options are for homologous sequence search, since retrieving proper homologous sequences is critical for the proper calculation of conservation scores. These options may need to be adjusted to obtain a sufficient number of proper homologous sequences to obtain reliable results.
OUTPUT
ConPlex provides a variety of output formats for the evolutionary conservation analyses of the protein complex (Figure 2). The main results page is divided into four sections: Output File, Intermediate File, Result Analysis and Structural Visualization (Figure 2A).
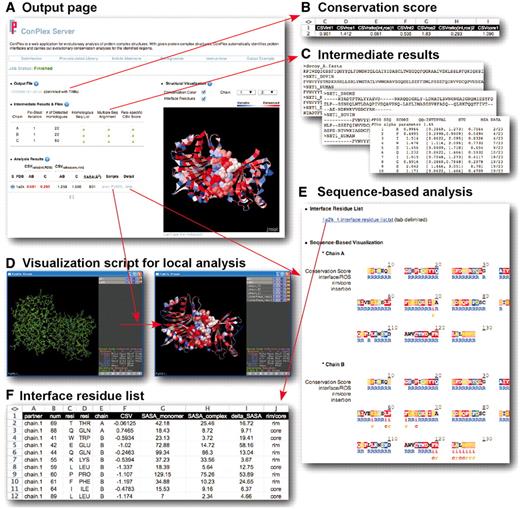
ConPlex Server outputs formats. (A) The main output page of ConPlex. (B) Conservation scores of interface, ROS, core and rim residues of the protein complex structure. (C) Intermediate calculation results, including homologous sequences, multiple sequence alignment and residue-specific conservation scores. (D) Visualization script for structure viewer programs. (E) Color-coded sequence conservation analyses of the primary amino-acid sequence. (F) List of the interface residues and their conservation scores.
Output file
In the ‘Output File’ section, users can download the conservation scores of the protein complexes (Figure 2B). The file contains the conservation scores of the interface (CSVint), the ROS (CSVROS) and CSV ratio of each binding partner [CSVratio(int, ROS)]. It also includes conservation scores of core (CSVcore), and rim residues (CSVrim), as well as their ratio [CSVratio(core, rim)]. For example, if the CSVratio(int, ROS) score is <1, it implies that the interface is more conserved than ROS (9). If the user uploaded an archived file containing multiple docking decoys, then the output file would have multiple lines of results. In that case, each line reveals the conservation analyses of each docking models. The file is delimited with TABs, to be easily analyzed using a spreadsheet programs.
Intermediate files
In the ‘Intermediate Files’ section, intermediate calculation results are provided (Figure 2C). Based on each sequence extracted from the query protein complex, ConPlex collects homologous sequences using PSI-BLAST (12), carries out a multiple sequence alignment using MUSCLE (13), and calculates the residue-specific evolutionary score using Rate4Site (2). Users can download these three intermediate calculation results and carry out more detailed analyses of each calculation in order to adjust the default setting in the advanced input options.
Result analysis and visualization scripts
In the ‘Result Analysis’ section, ConPlex provides various results for further analysis (Figure 2A). Both the CSVratio(int, ROS) and CSVratio(core, rim) scores are provide for the conservation analyses of interface/ROS and core/rim residues. If the interface is more conserved than the ROS, or the core residues are more conserved than the rim residues, then the value is represented in red. The analysis also provides the calculated results for the protein interface sizes (SASA), since the protein interface size is used as an important criterion to distinguish true protein–protein interactions from non-specific crystal contacts (16–18).
ConPlex also provides convenient visualization scripts so that users can visualize the results of the analyses on user’s local computers (Figure 2D). The default setting displays the complex structure in the webpage (‘structural visualization’ section). To provide added flexibility, users can download visualization scripts, enabling analysis of the results on their computer. Visualization scripts are provided for two structure viewer programs; Jmol (http://www.jmol.org/) and Pymol (http://pymol.sourceforge.net/). An example of applying the Pymol script is shown in Figure 2D, in which the residue-specific conservation scores and interface residues of each chain are automatically displayed (See http://sbi.postech.ac.kr/ConPlex/, under the ‘Output Example’ menu for detailed instructions). In this display, the degree of conservation is represented by a red-to-blue color gradient. A deeper red color indicates a more conserved residue and a deeper blue color represents a more variable residue. Interface residues are represented as spheres.
In the ‘Info’ menu, under the ‘Result Analysis’ section, users can open a popup window that shows detailed information on the residue-specific conservation scores for each chain (Figure 2E). At the top of the popup window, users can download the list of interface residues which includes the residue number, chain identifier, conservation score (CSV) and ΔSASA upon complex formation for each interface residue (Figure 2F).
Structural visualization
Under the ‘Structural Visualization’ section, the 3D complex structure displayed is color-graded according to the residue-specific conservation scores and visualized using Jmol (Figure 3). As indicated by the scale-bar, the degree of conservation is represented by a red-to-blue color gradient.
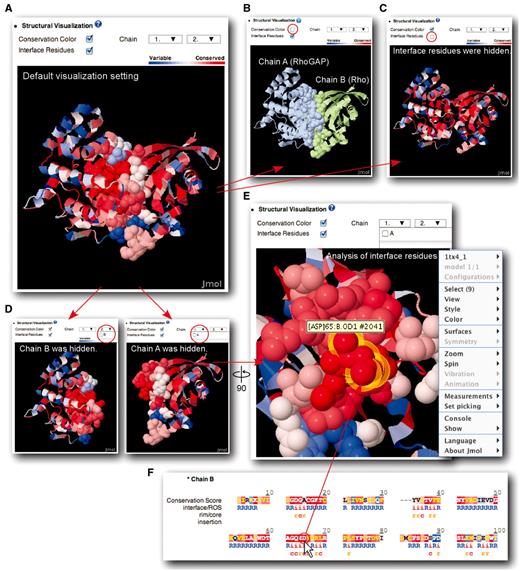
Display options for complex structure analysis. Rho–RhoGAP complex (PDB id: 1TX4) is used as example. (A) Default display format. Users have the option to toggle conservation colors (B), interface residues (C), and each chain in structures with two binding partners (D). (E) Users can rotate and enlarge/reduce the structure in the display. (F) Clicking a residue in sequence window will highlight the corresponding residue on the structure with a yellow outline.
In Figure 3, various display options for the structural analysis are shown with an example of Rho–RhoGAP complex (PDB id: 1TX4). Rho is a small G protein and a molecular switch to regulate phosphorylation pathways of cytoskeleton formation and cell proliferation. Through the interaction with RhoGAP, an active GTP-bound form of Rho is hydrolyzed to an inactive GDP-bound form (19). This Rho–RhoGAP interaction plays a crucial role in regulating Rho-mediated signaling pathways, which is evolutionary conserved across many species. ConPlex successfully visualize the highly conserved Rho–RhoGAP interface and should be useful to guide further analysis of the interface.
In the structural visualization, users can toggle the red-to-blue conservation color representation with the ‘Conservation Color’ option (Figure 3B). When conservation color is disabled, each chain of the complex is presented as a distinct color to easily differentiate each complex component. As a result, RhoGAP (chain A) and Rho (chain B) are shown in light blue and in light green, respectively. The ‘Interface Residues’ option toggles the display of the interface residues as sphere or in the ribbon representation (Figure 3C). Finally, ‘Chain’ option allow each chain to be shown or hidden (Figure 3D). Users can rotate and change the size of the protein structure to analyze the protein interface patch in detail (Figure 3E).
The protein sequences in the pop-up window, shown in Figure 2E, interfaces with the structure display, and if users click on a residue of interest in the primary sequence, the position of a corresponding residue will be highlighted in the structure with yellow outline (Figure 3F). Using the display options available in ConPlex, users can perform a detailed analysis of the complex structure and gain broader insights into the interactions.
PROGRAMMATIC INTERFACE
ConPlex provides programmatic interface using soaplib-based library using Web Service Description Language (WSDL). Users can automatically analyze large numbers of complexes either by using the script we provide or by modifying the script for their specific purpose. For advanced users who want to build their own ConPlex web-service client in other developmental environments, such as C++, Java or Ruby, supporting SOAP library, we provide a standard WSDL interface file in XML-Cascade. See ‘Programmatic Interface’ section in main webpage for more detailed information.
PRE-CALCULATED LIBRARY
ConPlex offers the library of the pre-calculated results for PDB binary complexes. Currently ConPlex stores pre-calculated results of 3376 PDB complexes (20) and provides the results under ‘Pre-calculated Library’ menu. The current results were calculated with default options. Moreover, the server stores the results from users’ PDB input so that it gives out result faster when it is found from the job history. When users submit a job with a PDB identifier, ConPlex searches for the same PDB complex from the pre-calculated library and job history without conducting redundant calculations. ConPlex start whole calculation processes when the submitted job is found to be new. Pre-calculated library will be expanded as the calculation results from users’ inputs are accumulated.
CONCLUSIONS
Evolutionary conservation has been widely applied to analyze protein sequences, as well as protein tertiary and quaternary structures. Currently, conservation analyses are shown to successfully identify functionally and structurally important residues (2,21), and several tools and web servers, such as Rate4Site (2), ConSeq (4), ConSurf (5,6) have been introduced to perform these calculations. However, a user-friendly web server for evolutionary conservation analyses of protein quaternary structures has not been available.
ConPlex is the first web application for evolutionary conservation analyses of protein–protein complex structures. It offers a one-stop calculation of residue-specific conservation scores within the quaternary structure by automatically collecting homologous sequences of the query protein chains and identifying biologically important regions of the complex structures. Additionally ConPlex provides a variety of display options that enable users to easily and thoroughly analyze their protein complex of interest. Furthermore, users are provided with the results of each intermediate calculation steps and visualization scripts for further analysis. Thus, ConPlex offers a convenient platform for biologists to perform evolutionary conservation analyses of protein complex structures.
FUNDING
National Research Foundation grant funded by the Korea government (MEST) (20090084155, 20090091503); FPR08B1-300 21st frontier functional Proteomics Project from the Korean Ministry of Education, Science and Technology; World Class University program (R31-2008-000-10100-0). Funding for open access charge: World Class University program (R31-2008-000-10100-0).
Conflict of interest statement. None declared.
ACKNOWLEDGEMENTS
The authors thank to the SBI lab members for critical discussion and comments on the manuscript.
REFERENCES
Author notes
The authors wish it to be known that, in their opinion, the first two authors should be regarded as joint First Authors.

Comments