


Abstract
Computational RNA secondary structure prediction approaches differ by the way RNA pseudoknot interactions are handled. For reasons of computational efficiency, most approaches only allow a limited class of pseudoknot interactions or are not considering them at all. Here we present a computational method for RNA secondary structure prediction that is not restricted in terms of pseudoknot complexity. The approach is based on simulating a folding process in a coarse-grained manner by choosing helices based on established energy rules. The steric feasibility of the chosen set of helices is checked during the folding process using a highly coarse-grained 3D model of the RNA structures. Using two data sets of 26 and 241 RNA sequences we find that this approach is competitive compared to the existing RNA secondary structure prediction programs pknotsRG, HotKnots and UnaFold. The key advantages of the new method are that there is no algorithmic restriction in terms of pseudoknot complexity and a test is made for steric feasibility. Availability: The program is available as web server at the site: http://cylofold.abcc.ncifcrf.gov.
INTRODUCTION
The variety of biochemical functions that are being carried out by RNA molecules is mesmerizing. Many RNAs such as ribosomal RNA, RNAase P or tRNA attain a defined secondary and tertiary structure that is vital to their function. Experimentally determined structures are only available for a small fraction of RNAs that are of interest. This makes the computational prediction of the base-pairing pattern (the secondary structure) of RNA an important problem. One major breakthrough was the development of dynamic programming algorithms that could predict the minimum free energy secondary structure of RNA sequence assuming that the structures are non-nested (1–5). Subsequently, dynamic programming algorithms have been extended to allow certain classes of pseudoknots (6,7).
Many RNA secondary structure prediction algorithms (including the one presented here) are based on the idea of iteratively adding substructures to an initially unfolded sequence (8,9). Genetic algorithms are an example of such algorithms and have proven very useful for exploring pseudoknotted structures and sub-optimal RNA structures (10–14).
Allowing pseudoknots is desirable simply because RNA structures determined by X-ray crystallography or NMR revealed that many RNAs contain non-nested base pairing interactions. Allowing all possible base pairing interactions leads to the potential problem for structure prediction approaches that not only are there many more conformations to consider, but also many conformations are not sterically feasible. Here, we describe a computational approach for RNA secondary structure prediction that has no restriction in terms of pseudoknot complexity, but additionally checks the steric feasibility of the considered conformations.
ALGORITHM
The described approach of RNA secondary structure prediction is based on the idea of maximizing matching helices in a secondary structure (10). A flow chart of the algorithm is shown in Figure 1. Briefly, the method works as follows: Initially, a list (called a stem-list) of all possible helices with more than 3 bp is generated. Helices can contain Watson–Crick and GU–wobble base pairs. The secondary structure prediction is performed by picking the best-scoring structure obtained after 50 folding simulation runs. The score is set to be the sum of the free energy contribution of the already placed helices. Each folding simulation run is performed by picking helices from the stem list with a Boltzmann-weighted probability. Estimating the free energy contribution of an RNA double-helix is accomplished using the RNA Vienna package (2). Each chosen helix is represented by a very coarse-grained 3D representation in a virtual 3D workspace. An RNA double helix is represented by a cylinder (using a radius of 6.5 � and a length of 2.7 � times the number of base pairs) that is capped with a half-sphere on both ends. This shape is called a capsule. A schematic diagram of the mapping of an RNA secondary structure into a highly coarse-grained 3D representation is shown in Figure 2. The main reason for choosing capped cylinders over regular cylinders is the computational efficiency of collision detection. Single stranded regions between helices are represented as constraints for the maximum distance between the ends of the capped cylinders. A newly chosen capped cylinder is placed into the 3D simulation space at a random position such that the distance-constraints are fulfilled. The distance constraints are a function of the single-stranded sequence lengths between connected helices. The maximum distance between helix ends is 2.0 � + n*8.0 � with n being the sequence separation. The minimum distance is 2.0.
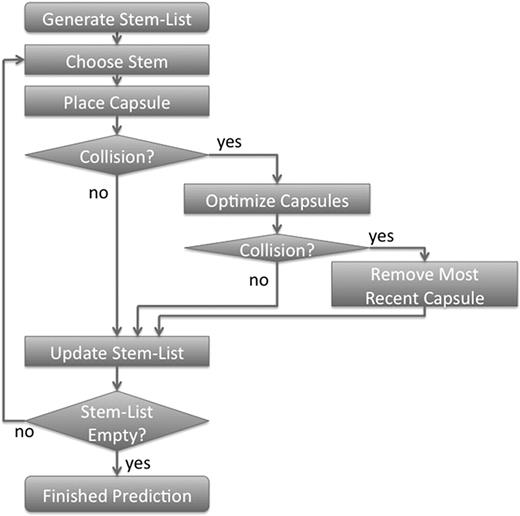
A flow-chart depicting the algorithm for predicting RNA secondary structures.
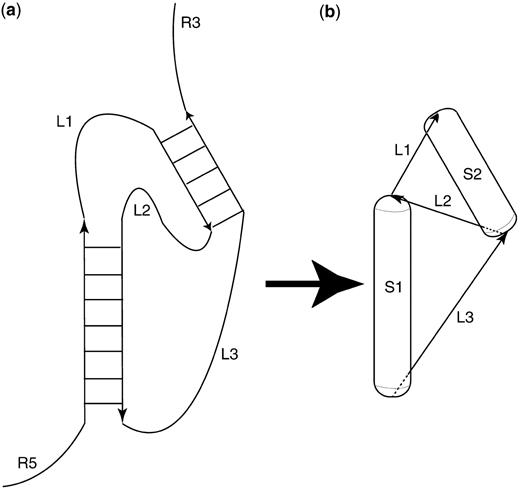
Scheme for mapping between an RNA secondary structure (a) and the used 3D coarse-grained representation (b). Each helix is represented as a capped cylinder (‘capsule’). Single-stranded regions between helices are represented as distance constraints. Only those RNA secondary structures can be a (partial) solution of a secondary structure prediction, for which the algorithm succeeds in placing the corresponding capped cylinders such that they do not collide and do not violate distance constraints.
If cylinders collide, the newly placed capped cylinder is placed at a different random position. If after 20 attempts the newly placed capped cylinder is still colliding with previously placed capped cylinders, the positions of all capped cylinders are optimized in order to minimize collisions and constraint violations. If no collision-free position can be found, the newly chosen helix and its capped cylinder representation is discarded. Otherwise, the found collision-free position is stored. Helices that are part of the stem-list and that share bases with the newly placed helix are removed from the stem-list. In the next iteration the next helix is chosen until no more helices can be placed. Once no more helices can be placed, one simulation run is completed. Fifty simulation runs are performed and the overall best-scoring structure is returned to the user.
IMPLEMENTATION
The folding algorithm is implemented as a C++ program. The web server has been implemented using the Grails framework (18), which is based on the Groovy programming language. For a secondary structure prediction request, the web server launches the cylofold binary on a Linux compute cluster. After the prediction result has been generated, the program VARNA (19) is launched to generate an image of the secondary structure prediction. The prediction results are temporarily stored in a relational database.
Usage
A user of the CyloFold prediction web server can start a secondary structure prediction request by entering (‘pasting’) a nucleotide sequence (as raw characters or in FASTA form, both ACGU and ACGT alphabets are accepted) into the web form and pressing ‘submit’. The maximum sequence length that is currently accepted by the web server is 300 nt. The initial return of the web server is a unique id, which is needed if one wants to access results at a later time. Due to the compute-intensive approach for the prediction, it can take several minutes for the server to finalize a secondary structure prediction. The user can access the results by one of three methods: a simple ‘reload’ of the initial result page will update the status of the prediction and will eventually contain the prediction results. Alternatively, the user can bookmark the initial result page in the web browser and return to it at a later time. Lastly, the unique id provided after submitting the secondary structure prediction compute request can be used to access the results using another web form available on the server home page.
A typical output from a completed RNA structure prediction is shown in Figure 3. The prediction result is presented to the user in three different formats: (i) An image of the predicted RNA secondary structure created by VARNA (19); (ii) An extended bracket notation in which nested base pairs are denoted as pairs of nested parentheses and helices corresponding to pseudoknot interactions are denoted as letters; (iii) The ‘CT’ file format that is also generated by other programs such as mfold (5). This format contains a list of the indices of the bases and their predicted base-pairing partners.
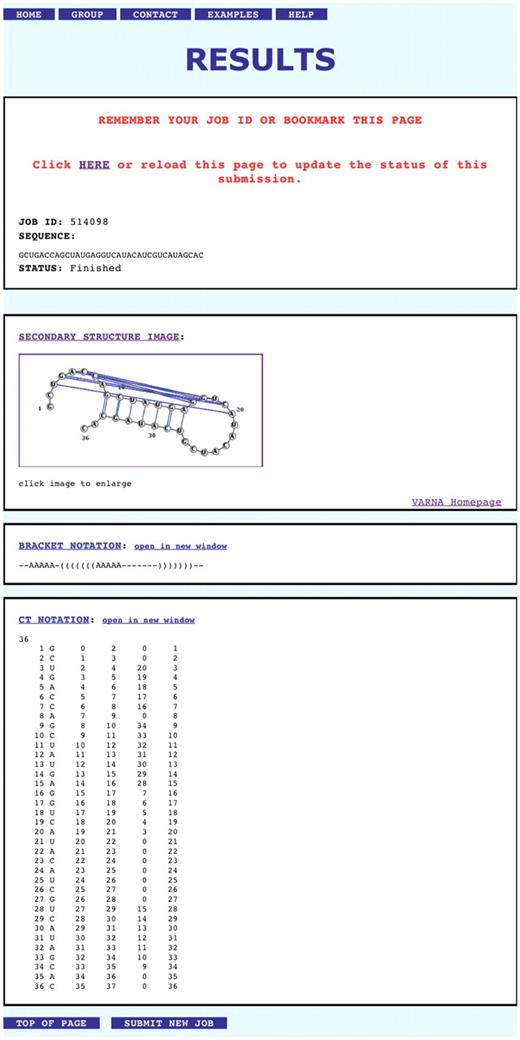
Screenshot of a typical prediction result returned by the CyloFold web server. The shown sequence corresponds to the bacteriophage T2 gene 32 mRNA pseudoknot (PDB 2TPK).
RESULTS AND DISCUSSION
The performance of the new RNA secondary structure prediction method was evaluated using two different data sets. Data set 1 (corresponding to the results shown in Table 1) consists of 26 RNA sequences, whose tertiary structure is available in the Protein Data Bank (PDB). The reference secondary structure was obtained by extracting the base pair information from the PDB coordinate file using the program RNAview (20). Data set 2 consists of 241 RNA sequences and secondary structures originating from PseudoBase (21,22).
Prediction results corresponding to 26 RNA structures that are available in the Protein Dank Bank
| PDB | Description | L | PKF | CF | PK | HK | UF | ||||||||
|---|---|---|---|---|---|---|---|---|---|---|---|---|---|---|---|
| MCC | SNS | PPV | MCC | SNS | PPV | MCC | SNS | PPV | MCC | SNS | PPV | ||||
| 1A60 | TYMV tRNA-like structure | 44 | 13.6 | 0.74 | 0.77 | 0.71 | 0.96 | 1.00 | 0.93 | 0.83 | 0.77 | 0.91 | 0.83 | 0.77 | 0.91 |
| 1CX0 | HDV ribozyme | 72 | 22.2 | –0.01 | 0.00 | 0.00 | –0.01 | 0.00 | 0.00 | –0.01 | 0.00 | 0.00 | –0.01 | 0.00 | 0.00 |
| 1E95 | SRV-1 pseudoknot | 36 | 33.3 | 1.00 | 1.00 | 1.00 | 1.00 | 1.00 | 1.00 | 1.00 | 1.00 | 1.00 | 0.70 | 0.50 | 1.00 |
| 1HVU | HIV RT bind. pseudoknot | 30 | 26.6 | 0.95 | 1.00 | 0.91 | 0.95 | 1.00 | 0.91 | 0.56 | 0.40 | 0.80 | 0.56 | 0.40 | 0.80 |
| 1KAJ | MMTV RNA pseudoknot | 32 | 25.0 | 0.85 | 1.00 | 0.73 | 0.85 | 1.00 | 0.73 | 0.85 | 1.00 | 0.73 | 0.53 | 0.50 | 0.57 |
| 1KH6 | HCV IRES domain | 42 | 0.0 | 0.74 | 0.77 | 0.71 | 0.55 | 0.54 | 0.58 | 0.53 | 0.54 | 0.54 | 0.92 | 0.93 | 0.93 |
| 1KPY | PEMV-1 P1P2 pseudoknot | 27 | 22.2 | 0.89 | 1.00 | 0.80 | 0.94 | 1.00 | 0.89 | 0.79 | 0.62 | 1.00 | 0.79 | 0.63 | 1.00 |
| 1KXK | GroupII self-splic. intron | 70 | 0.0 | 0.91 | 0.87 | 0.95 | 0.81 | 0.83 | 0.79 | 0.81 | 0.83 | 0.79 | 0.96 | 0.96 | 0.96 |
| 1L2X | Viral RNA pseudoknot | 27 | 22.2 | 0.94 | 1.00 | 0.89 | 0.94 | 1.00 | 0.89 | 0.79 | 0.63 | 1.00 | 0.79 | 0.63 | 1.00 |
| 1Q9A | 23S rRNA sarcin/ricin | 27 | 0.0 | 0.91 | 0.83 | 1.00 | 0.77 | 0.83 | 0.71 | 0.86 | 1.00 | 0.75 | 0.77 | 0.83 | 0.71 |
| 1U8D | Guanine riboswitch | 67 | 11.9 | 0.87 | 0.87 | 0.87 | 0.88 | 0.78 | 1.00 | 0.88 | 0.78 | 1.00 | 0.88 | 0.78 | 1.00 |
| 2A43 | Luteoviral pseudoknot | 26 | 23.0 | 0.93 | 1.00 | 0.88 | 0.93 | 1.00 | 0.88 | 0.75 | 0.57 | 1.00 | 0.75 | 0.57 | 1.00 |
| 2G1W | tmRNA pseudoknot | 22 | 18.1 | 0.81 | 1.00 | 0.67 | 0.86 | 1.00 | 0.75 | 0.81 | 0.67 | 1.00 | 0.81 | 0.67 | 1.00 |
| 2GIS | SAM- riboswitch | 94 | 8.5 | 0.80 | 0.76 | 0.85 | 0.80 | 0.76 | 0.85 | 0.86 | 0.86 | 0.86 | 0.55 | 0.55 | 0.55 |
| 2HOO | thi-box riboswitch | 83 | 0.0 | 0.70 | 0.67 | 0.74 | 0.58 | 0.62 | 0.54 | 0.58 | 0.62 | 0.54 | 0.58 | 0.62 | 0.54 |
| 2K95 | P2B-P3 telo-merase RNA | 48 | 37.5 | 0.89 | 0.80 | 1.00 | 0.89 | 0.80 | 1.00 | 0.75 | 0.8 | 0.71 | 0.54 | 0.40 | 0.75 |
| 2OIU | L1 Ribozyme Ligase adduct | 71 | 0.0 | 0.86 | 0.78 | 0.95 | 0.98 | 0.96 | 1.00 | 0.98 | 0.96 | 1.00 | 0.98 | 1.00 | 1.00 |
| 2QUS | Hammerhead Ribozyme | 68 | 2.9 | 0.95 | 0.91 | 1.00 | 0.95 | 0.91 | 1.00 | 0.95 | 0.91 | 1.00 | 0.95 | 1.00 | 1.00 |
| 2QWY | SAM-II riboswitch | 52 | 26.9 | 0.48 | 0.46 | 0.50 | 0.48 | 0.46 | 0.5 | 0.34 | 0.31 | 0.4 | 0.35 | 0.31 | 0.40 |
| 2RP0 | PEMV1 mRNA pseudoknot | 26 | 15.3 | 0.88 | 1.00 | 0.78 | 0.88 | 1.00 | 0.78 | 0.84 | 0.71 | 1.00 | 0.84 | 0.71 | 1.00 |
| 2TPK | T2 gene 32 mRNA p.k. | 36 | 27.7 | 1.00 | 1.00 | 1.00 | 1.00 | 1.00 | 1.00 | 0.71 | 0.58 | 0.88 | 0.63 | 0.58 | 0.70 |
| 361D | Domain E of 5S rRNA | 19 | 0.0 | 0.86 | 1.00 | 0.75 | 0.86 | 1.00 | 0.75 | 0.83 | 0.83 | 0.83 | 0.83 | 0.83 | 0.83 |
| 3DIG | Lysine Riboswitch | 173 | 30.1 | 0.89 | 0.85 | 0.93 | 0.74 | 0.72 | 0.76 | 0.74 | 0.72 | 0.76 | 0.74 | 0.72 | 0.76 |
| 3FU2 | class-I preQ1 riboswitch | 32 | 18.8 | 0.79 | 0.63 | 1.00 | 0.79 | 0.63 | 1.00 | 0.79 | 0.63 | 1.00 | 0.79 | 0.63 | 1.00 |
| 3PHP | TYMV p.k. hairpin | 23 | 0.0 | 1.00 | 1.00 | 1.00 | 1.00 | 1.00 | 1.00 | 1.00 | 1.00 | 1.00 | 1.00 | 1.00 | 1.00 |
| 437D | rib. frame-shifting p.k. | 27 | 22.2 | 0.94 | 1.00 | 0.89 | 0.94 | 1.00 | 0.89 | 0.79 | 0.63 | 1.00 | 0.79 | 0.63 | 1.00 |
| Mean | All | 0.83 | 0.85 | 0.83 | 0.82 | 0.84 | 0.81 | 0.75 | 0.71 | 0.83 | 0.73 | 0.65 | 0.83 | ||
| Mean | No pseudoknots | <5.0 | 0.87 | 0.85 | 0.89 | 0.81 | 0.84 | 0.80 | 0.82 | 0.84 | 0.81 | 0.87 | 0.90 | 0.87 | |
| Mean | Pseudoknots | >5.0 | 0.81 | 0.84 | 0.80 | 0.82 | 0.84 | 0.82 | 0.73 | 0.65 | 0.84 | 0.66 | 0.55 | 0.80 | |
L, Sequence length; PKF, fraction of pseudoknot interactions; For each of the four different prediction methods (CF, Cylofold; PK, pknotsRG; HK, HotKnots 2.0; UF, UNAFold) we report three different measures of prediction quality (SNS, sensitivity; PPV, positive predictive value).
In order to quantify the time-complexity of the folding method, we fitted a function of the form a*Nb (with N being the number of residues in the input sequence) to the execution time needed for the cases of the 241 sequence set. We found that the execution time (measured in seconds) of the structure prediction is well described by the function 2.74*10−8*N4.47. The timing evaluation was performed on a computer with 4 GB of RAM and an Intel 64-bit Xeon processor (3.0MHz).
We report in Tables 1 and 2 prediction results for these two data sets together with the corresponding results obtained by running the RNA secondary structure prediction programs HotKnots 2.0 (8), pknotsRG (7) and UNAFold (23).
| MCC | SNS | PPV | |
|---|---|---|---|
| CyloFold | 0.752 | 0.763 | 0.747 |
| pknotsRG | 0.748 | 0.753 | 0.756 |
| HotKnots 2.0 | 0.611 | 0.565 | 0.684 |
| UNAFold | 0.597 | 0.532 | 0.692 |
| MCC | SNS | PPV | |
|---|---|---|---|
| CyloFold | 0.752 | 0.763 | 0.747 |
| pknotsRG | 0.748 | 0.753 | 0.756 |
| HotKnots 2.0 | 0.611 | 0.565 | 0.684 |
| UNAFold | 0.597 | 0.532 | 0.692 |
SNS, sensitivity of predicted base pairs; PPV, positive predictive value.
| MCC | SNS | PPV | |
|---|---|---|---|
| CyloFold | 0.752 | 0.763 | 0.747 |
| pknotsRG | 0.748 | 0.753 | 0.756 |
| HotKnots 2.0 | 0.611 | 0.565 | 0.684 |
| UNAFold | 0.597 | 0.532 | 0.692 |
| MCC | SNS | PPV | |
|---|---|---|---|
| CyloFold | 0.752 | 0.763 | 0.747 |
| pknotsRG | 0.748 | 0.753 | 0.756 |
| HotKnots 2.0 | 0.611 | 0.565 | 0.684 |
| UNAFold | 0.597 | 0.532 | 0.692 |
SNS, sensitivity of predicted base pairs; PPV, positive predictive value.
The average Matthews correlation coefficient (MCC) obtained by comparing the base pairing pattern of the predicted secondary structures with their respective reference secondary structure is for data set 1 and CyloFold 0.83; this can be compared to pknotsRG (0.82), HotKnots 2.0 (0.75) and UNAFold (0.73) (see row of Table 1 named ‘All’).
We divided this data set into two subsets according to the fraction of pseudoknot base pairs in the respective structures. The results can be seen in the last two rows of Table 1. The eight PDB structures with <5% pseudoknotted base pairs correspond to an average MCC of 0.87 for CyloFold compared to 0.81 for pknotsRG, 0.82 for HotKnots 2.0 and 0.87 for UNAFold. The 18 structures listed in Table 1 that have a pseudoknot amount >5% correspond to an average MCC of 0.81 for CyloFold, 0.82 for pknotsRG, 0.73 for HotKnots 2.0 and 0.66 for UnaFold.
Using the larger data set 2, one obtains an average MCC of 0.752 for CyloFold and 0.748 for pknotsRG (Table 2). In Table 2 one can see the RNA secondary structure predictions obtained by CyloFold correspond to the highest MCC (compared to the programs pknotsRG, HotKnots 2.0 and UNAFold). It also has the highest average base pair prediction sensitivity (0.763). For another measure, the positive predictive value (how often are predicted base pairs part of the reference secondary structure), all programs obtain averages between 0.68 and 0.76 for data set 2 with pknotsRG leading with a value of 0.756. It should be noted that the MCC is often used as an overall measure of prediction quality, while sensitivity, specificity and positive predictive value capture certain other aspects of the prediction quality.
These results indicate that the prediction accuracy of CyloFold compared to pknotsRG is similar. The key advantage of CyloFold is that there is no restriction in terms of the classes of pseudoknots that are being considered. Also, it should be noted that the employed model of simulated RNA folding by placing helices with a probability according to their free energy contribution is in essence very simple (24). In that sense it is surprising how well the method performs, and it should be an encouragement to continue to develop RNA folding algorithms that are substantially different from established approaches.
CONCLUSION
CyloFold is a new method for RNA secondary structure prediction. We show using two different data sets that the prediction accuracy (MCC) is comparable to the RNA secondary structure prediction program pknotsRG. The search algorithm has no restriction in terms of pseudoknot complexity. Another novel aspect is that at each step during the simulated folding process, the steric feasibility of the predicted structures is checked for steric feasibility using a highly coarse-grained 3D representation. The method is made available in the form of a user-friendly web server.
FUNDING
This project has been funded in whole or in part with federal funds from the National Cancer Institute, National Institutes of Health, under contract HHSN26120080001E. This Research was supported by the Intramural Research Program of the NIH, National Cancer Institute, Center for Cancer Research. Funding for open access charge: National Cancer Institute.
Conflict of interest statement. None declared.
ACKNOWLEDGEMENTS
We wish to thank the Advanced Biomedical Computing Center (ABCC) at the NCI for their computing support. The content of this publication does not necessarily reflect the views or policies of the Department of Health and Human Services, nor does mention of trade names, commercial products, or organizations imply endorsement by the U.S. Government. The funders had no role in study design, data collection and analysis, decision to publish, or preparation of the manuscript.

Comments