


Abstract
waviCGH is a versatile web server for the analysis and comparison of genomic copy number alterations in multiple samples from any species. waviCGH processes data generated by high density SNP-arrays, array-CGH or copy-number calls generated by any technique. waviCGH includes methods for pre-processing of the data, segmentation, calling of gains and losses, and minimal common regions determination over a set of experiments. The server is a user-friendly interface to the analytical methods, with emphasis on results visualization in a genomic context. Analysis tools are introduced to the user as the different steps to follow in an experimental protocol. All the analysis steps generate high quality images and tables ready to be imported into spreadsheet programs. Additionally, for human, mouse and rat, altered regions are represented in a biological context by mapping them into chromosomes in an integrated cytogenetic browser. waviCGH is available at http://wavi.bioinfo.cnio.es.
INTRODUCTION
Classic comparative genomic hybridization (CGH) techniques were developed to compare the copy number of differentially labeled test and normal reference DNAs using fluorescence in situ hybridization (FISH) in metaphase chromosomes (1). Later on, the technique was improved (2,3) using microarrays (aCGH). Nowadays, multiple microarray platforms exist to directly measure genomic DNA copy number [see (4) for a review] including the recent adaptation of SNP arrays for copy number variants (CNV) detection (5). aCGH and SNP arrays have become the standard techniques for the detection chromosomal copy number alterations at high resolution in many laboratories. However, the statistical analysis of genomic copy number data is not straightforward for researchers without bioinformatics expertise.
waviCGH is a web server application aimed to help researchers to perform all the steps of genomic copy number analysis detected by microarrays:
Normalization.
Pre-processing.
Segmentation.
Calling of gains and losses.
Minimal common regions (MCR) determination over a set of experiments.
A number of related public systems for the analysis of this type of data are available (6–9), including several web servers (10–16). Most of the existing applications only cover only some of the analytical steps, and require the user to input data at one specific stage of processing, not allowing to catch up the analysis at previous or later steps. Major improvements offered by waviCGH are: a flexible and user-friendly interface, state-of-the-art methods, and organization of the methods and their results into multiple-step protocols that can be accessed at different stages of the analysis process. In addition, waviCGH accepts not only log-ratios, which are the usual form of starting input, but also data already called as gained/lost/no-changed. Copy number calls are the natural form to represent final results, as calls have a clear biological interpretation and can be compared between different experiments and platforms. Moreover, for human, mouse and rat, all individual altered segments and MCRs can be easily explored in a chromosomal context by using the integrated cytogenetic browser. Finally, waviCGH can produce summary karyotypes with the results, which is the most common way of presenting genomic copy number results in publications.
DESCRIPTION OF THE TOOL
waviCGH has been built as a logical multi-step but simple protocol to facilitate the usability of the most common copy number analytical procedures. A protocol, or workflow, is simply a series of analysis steps. Users can choose between two protocol types: log-ratios and copy-numbers. When a protocol is selected and the input data is uploaded into waviCGH, a new project is created and the URL of the project is provided. The results obtained in a project can be accessed for 5 days.
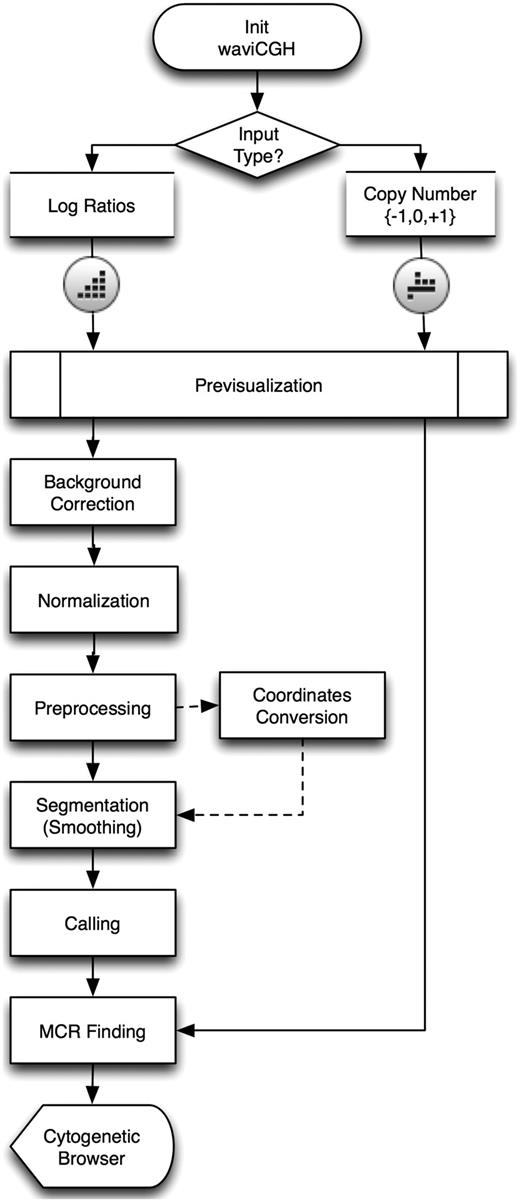
A flow diagram of all analysis steps in waviCGH showing the commonalities and differences of the protocols is presented in Figure 1. Each protocol automatically directs the user to the adequate set of steps, according to the nature and format of the initial data. In both protocols users can analyze dataset files as big as 400 Mb. Users with datasets exceeding this limit are invited to contact us.
The log-ratios protocol includes all the possible analysis steps. The log-ratios workflow begins with a simple table of log-ratios that reflect the difference in intensity between two samples hybridized in a two-color array (aCGH, like Agilent or Nimblegen) or hybridized in independent arrays (SNP-arrays, like Affymetrix or Illumina). The log-ratios of intensities need to be normalized, preprocessed and segmented before calling of chromosomal gains and losses; all these steps are performed by waviCGH in the log-ratios protocol.
The copy number protocol takes called probes that were already segmented and translated into copy number alteration states (–1 for losses, 1 for gains and 0 for normal). waviCGH will search MCRs altered across the different samples and will display altered regions and MCRs on chromosomes, providing links to visualize the corresponding genomic regions in EnsEMBL (17). This type of protocol can be especially useful for researchers who have data already analyzed and need to visualize their results and compare copy numbers among multiple samples.
aCGH analysis protocols and methods as implemented in waviCGH.
The interface of waviCGH is divided into four major sections: the Control Panel, the Results window, the Protocol Sidebar and the Help frame. The Control Panel is a button bar where the users can control the flow of the analysis protocol. The Results Window displays the results of each analysis step in a different tab; all numerical results can be downloaded as text files for easy perusal, or import into other applications. The Protocol Sidebar contains option boxes that correspond to the analysis steps of that protocol, and each one shows the parameters specific for that step. From each analysis step box you can directly access the help section that explains both the methods and the results. In addition, a complete manual with tutorials is available at http://wavi.bioinfo.cnio.es/waviCGH_guide.pdf.
ANALYSIS METHODS
The methods available in waviCGH protocols are schematically summarized in Figure 1. As mentioned above, the protocol depends on the type of input data, which in turn defines the available methods. We have optimized many of the methods to increase their speed and performance (see ‘Implementation details’ section).
Genomic coordinates
After data upload, waviCGH can update the genomic position of microarray probe annotations from old NCBI assemblies the human and mouse genomes to the current reference genome versions (GRCh37 and NCBIM37, respectively).
Normalization and preprocessing
Log-ratios can be median-normalized, thus setting the log-ratio median at zero (18). Averaging duplicated probes and missing value imputation are done with aCGH (Fridlyand and Dimitrov, www.bioconductor.org) and snapCGH (Smith, Marioni, McKinney, Hardcastle and Thorne; http://www.bioconductor.org). Genomic waves can be adjusted using the method of Diskin et al. (19).
Segmentation
We define ‘segmentation’ as the process of smoothing the observed/normalized log-ratios, so probes predicted to be in the same chromosomal segment have the same value. Translating these smoothed ratios into gain/no-change/loss states is a different step that is generally named ‘calling’ (of gains and losses). Segmentation methods available are: HaarSeg (20), DNAcopy (21), GLAD (22), wavelets (23), HMM (24), BioHMM (25) and CGHseg (26).
Calling
After segmentation, users can select between two alternative calling methods: segmentation-based or probability-based. Segmentation-based calling is done after DNAcopy, HMM and BioHMM using mergeLevels algorithm (27). In the case of GLAD, we use its own region assignment algorithm (22). For wavelets, CGHseg and HaarSeg, users can follow the recommendation from the HaarSeg authors of using a median absolute deviation (mad) cut-off of their choice (20). Probability-based calling is done using CGHcall package (28). Both strategies will give calls in a numerical format of 0/–1/1 (and optionally 2 for amplifications, in the case of probability-based calling), with CGHcall additionally providing probabilities.
MCRs
Two different strategies can be used to find MCRs: SuperSORI and Permutations. SuperSORI is a fast method that detect all MCRs shared by at least two individuals, also called smallest regions of imbalance (SORI) (29,30). SuperSORI performs a curation of the calls to generate consistent segments before searching MCRs. First, it filters out segments of a given number of probes and joins segments separated by gaps of less than a given size (in base pairs or number of probes). Then, MCRs are found by obtaining the intersection of the curated segments. Permutations method is a user-friendly implementation similar to previous approaches (31,32) but with a different permutation schema designed to deal with high density array data (see Supplementary Data for details). Briefly, it computes for each probe a P-value that tests the significance of the alteration of that probe across the set of samples. This P-value is based on a permutation test that assumes that the alterations found are randomly located in the genome. Then, the consecutive probes with P-values lower than a cut-off are merged in a common region.
Cytogenetic browser
MCRs and individually gained and lost regions in human, mouse or rat genomes are finally sent to the Cytogenetic Browser. The aim of this tool is to show all cytogenetic alterations obtained from the aCGH analysis in a simple and manageable way, so users can easily compare results among samples. If the user wants to explore any region in more detail, a simple click will directly link to Ensembl genome browser (16), which will display a genomic window size corresponding to that region. Finally, a summary karyotype/ideogram image with results for all chromosomes can be automatically generated (Figure 2).
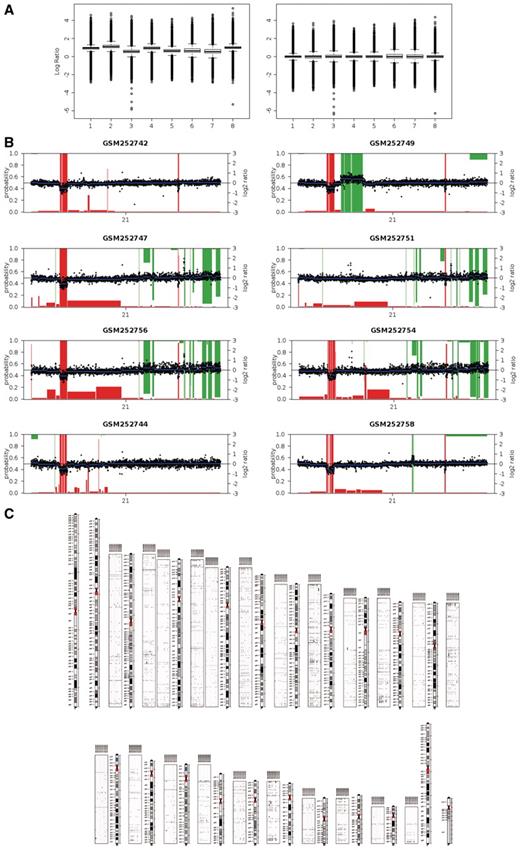
Example results from a typical analysis. Log-ratios corresponding to the eight samples from Kidd et al. (33) were analyzed. (A) Boxplots of log-ratios after (rigth) and before (left) median normalization. (B) Probability-based calling results for chromosome 21. Black points: normalized log-ratios. Blue lines: DNAcopy-segmented log-ratios. Red bars: loss probability. Green bars: red probability (inverted scale). (C) Karyotype including panels with gains (green, above chromosomes) and losses (red, below chromosomes).
EXAMPLE PROJECTS
We have included pre-ran example projects, which present all results for selected datasets. waviCGH users can also download these datasets in waviCGH format, and follow the tutorials included in the guide to learn how we selected appropriate parameters.
We will use the aCGH data from Kidd (33) to illustrate waviCGH functionality. Kidd and co-workers used Agilent aCGH 244K custom arrays for the validation of 512 previously discovered copy number variant (CNVs) regions in the genome of eight healthy individuals of diverse geographic ancestry. The complete results of our analysis are available in waviCGH web site as an example project at http://wavi.bioinfo.cnio.es/?ProjectNumber=EXAMPLE/ProjectLogRatiosKIDD.
We downloaded the raw data from GEO (accession GSE10008) and selected samples with reference in Cy3 (green). Log-ratios were calculated using processed red and green signals, and the log-ratios were uploaded to waviCGH (Figure 2). As boxplots showed differences between the samples log-ratios distribution, we median-normalized them (Figure 2A). We then did the Preprocessing step: 2815 duplicated probes were averaged, probes outside autosomes were removed (1276) and missing values were imputed. The remaining 208 428 probe log-ratios were segmented using DNAcopy. We called gains and losses with the probability-based method (CGHcall) obtaining an average of 470 gains and 210 losses per sample. Figure 2B shows segmentation and calling results for the eight samples in chromosome 21. We then looked for significant MCRs using Permutations method. We found 284 MCRs with adjusted P-value lower than 0.05, with sizes ranging between 5 bp and 1.66 Mb (median 2.18 kb), and frequencies ranging between 0.375 and 1 (median 0.5). These results are in agreement with the results reported in Kidd (32) where they observed that 50% of the discovered CNVs were present in more than one individual. Finally the results were displayed in the Cytogenetic Browser, where we generated a Karyotype showing all gains and losses detected in the eight individuals (Figure 2C).
CONCLUDING REMARKS
The goal of waviCGH is to facilitate researchers the aCGH analytical process by meeting their copy number variation analysis needs in an easy-to-use web server application. waviCGH provides a fundamentally different approach to aCGH analysis. We have implemented a useful workflow than can be accessed at different steps depending on the type of input data. The different input types will determine the analysis protocols and both protocols converge at the two last analysis steps: MCR finding and Cytogenetic Browser results visualization tool. All results can be easily explored using the integrated Cytogenetic Browser, which facilitate their interpretation by mapping all regions into human, mouse or rat chromosomes.
Usage of waviCGH is free and open to all, and that there is no login requirement.
IMPLEMENTATION DETAILS
waviCGH has been optimized to use with the multi-platform browser Mozilla Firefox v3.x, and it works with Mac Safari v4, Google Chrome v4 and Opera v10. Microsoft Internet Explorer is not supported. waviCGH client side is an Ajax rich user interface implemented with HTML, CSS and Javascript, using mainly YUI (Yahoo! User Interface) v2.6. The server side is implemented in perl 5.8.8 and python 2.4. The back end analysis logic runs on a cluster of 30 nodes, with two dual-core AMD Opteron CPUs each. We use R 2.10, and segmentation methods are parallelized via Rmpi (Yu, cran.r-project.org), snow (Tierney, Rossini, Li and Sevcikova, cran.r-project.org), and snowfall (Knaus, cran-r-project.org). For detailed description of segmentation methods implementation and the default parameters we used, please see Appendix of the guide (http://wavi.bioinfo.cnio.es/waviCGH_guide.pdf). To allow the handling of very large data sets in R, and to minimize sending large objects via MPI, we use the ff R library (Adler, Glaeser, Nenadic, Oehlschlaegel and Zucchini, cran.r-project.org) for memory-efficient storage of large data on disk and fast access functions. CGHcall (28) is run by chromosome in serialized fashion using the Sun Grid Engine batch-queuing system. SuperSORI was written in perl. Genomic waves adjustment is done using perl scripts kindly provided by the authors (19). Cytoband-region mapping of the Cytogenetic Browser are done using the Ensembl API (34).
FUNDING
National Institute for Bioinformatics (www.inab.org), a platform of ‘Genoma Espa�a’; Fundacion de Investigacion Medica Mutua Madrile�a (partial); Spanish Ministry of Science and Innovation (MICINN) (Project BIO2009-12458 and PTA2009-2853-I partial funding to A.C.). Funding for open access charge: Project BIO2009-12458 of MICINN.
Conflict of interest statement. None declared.
ACKNOWLEDGEMENTS
We thank all CNIO researchers from the Human Cancer Genetics and Molecular Pathology Programs who tested the application; we appreciate their suggestions to improve the user interface. Eduardo Andres for his help deploying the web server. We are grateful to Kay Wang for all his help with the genomic waves adjustment method. Ana�s Baudot, Gonzalo Gomez and Alfonso Valencia for their helpful suggestions after reading the manuscript.
REFERENCES
Author notes
The authors wish it to be known that, in their opinion, the first two authors should be regarded as joint First Authors

Comments