


ABSTRACT
Recent advances allow tracking the levels and locations of a thousand proteins in individual living human cells over time using a library of annotated reporter cell clones (LARC). This library was created by Cohen et al. to study the proteome dynamics of a human lung carcinoma cell-line treated with an anti-cancer drug. Here, we report the Dynamic Proteomics database for the proteins studied by Cohen et al. Each cell-line clone in LARC has a protein tagged with yellow fluorescent protein, expressed from its endogenous chromosomal location, under its natural regulation. The Dynamic Proteomics interface facilitates searches for genes of interest, downloads of protein fluorescent movies and alignments of dynamics following drug addition. Each protein in the database is displayed with its annotation, cDNA sequence, fluorescent images and movies obtained by the time-lapse microscopy. The protein dynamics in the database represents a quantitative trace of the protein fluorescence levels in nucleus and cytoplasm produced by image analysis of movies over time. Furthermore, a sequence analysis provides a search and comparison of up to 50 input DNA sequences with all cDNAs in the library. The raw movies may be useful as a benchmark for developing image analysis tools for individual-cell dynamic-proteomics. The database is available at http://www.dynamicproteomics.net/.
INTRODUCTION
To study the proteome of living human cells requires quantification of the levels and localization of thousands of proteins in space and time (1–4). Proteome dynamics are crucial for understanding, for instance, the effects of drugs on cells (5–7). A recent advance in molecular cell biology and image analysis, reported by Cohen et al. allows measuring the proteome dynamics in individual living human cancer cells (1). Cohen et al. studied the levels of over a thousand unique proteins in single cells of a human lung carcinoma line treated with the anti-cancer drug, camptothecin (CPT) (1). The study was focused on a library of annotated reporter cell clones (LARC), in which each clone has a fluorescently tagged protein expressed form its native chromosomal location. The LARC library was created using the ‘CD tagging’ approach (2–4,8–12), in which a retrovirus inserts a fluorescent label (for example, enhanced yellow fluorescent protein, eYFP or Venus) into the intron of a protein-encoding gene. Protein identity was established by sequencing the mRNA downstream of the eYFP insertion site (3′ RACE). The LARC library contains about 1200 unique tagged proteins. Cohen et al. used the time-lapse fluorescence microscopy to study protein fluorescence levels and changes in the subcellular localizations for 48 hours after drug treatment (1).
We present here the Dynamics Proteomics database, which is a compendium of endogenously tagged human proteins studied by Cohen et al. (1), and their time-lapse microscopy movies that illustrate the protein dynamics in space and in time in individual living human cancer cells in response to an anti-cancer drug CPT (1–4). The database provides the annotation of the tagged proteins, alignment of protein dynamics for proteins of interest, sequence search and comparison of up to 50 input sequences to all the cDNAs in the library. The web interface enables a visual overview of the available proteins in the library, fluorescent and phase images of their intracellular localizations and time-lapse microscopy movies.
DATABASE CONTENT AND STATISTICS
The database version 1.0 incorporates the LARC library (1), which includes 2189 cell-line clones, 1144 unique characterized proteins and over 150 uncharacterized proteins. Each clone contains a different protein fused to a fluorescent protein (eYFP or Venus), expressed from its endogenous chromosomal location under its natural regulation (1).
The Dynamic Proteomics annotation is produced by the similarity search of cDNA sequences against public databases of human DNA sequences using BLAST-Like Alignment Tool (BLAT) (13). For each database entry, all BLAT hits are recorded with database IDs, and information in text is used for the manual QA process. Additional automatic PERL programs produce an extended protein annotation from the Ensembl (14) and Entrez (NCBI) databases for entries selected according to QA standards.
A database entry contains a protein description, cellular process and function, and the chromosomal position of the integrated fluorescent tag. Moreover, the entry page includes phase and fluorescence images of protein localization in the cell, a manual annotation of the observed localization patterns, time-lapse movies, and protein dynamics. The protein dynamics is a quantitative trace of the tagged-protein fluorescence levels in the nucleus and cytoplasm obtained by image analysis of the movies over time (1).
Tagged proteins in the library have different cell localizations, including cytoplasm, cytoskeleton, nucleus, nucleolus, endoplasmic reticulum, Golgi, mitochondrion, plasma membrane and others (Figure 1A). These localizations are distributed among the clones similarly to the distribution of known human proteins annotated in the GO database (Figure 1B). We found that the uncharacterized proteins tagged in the library (proteins annotated as hypothetical, or proteins encoded from regions in the genome denoted as ESTs and mRNAs), have a distribution of localizations similar to that of the characterized proteins in the library (Figure 1C).
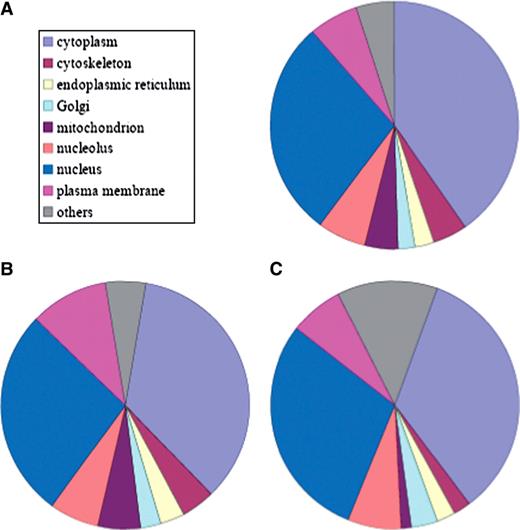
Tagged proteins in the LARC library are found across all cellular localizations. The localization distribution is similar to that of all known proteins. Represented are distributions of cellular localizations for: (A) all proteins in the Dynamic Proteomics database with published localizations; (B) all proteins in the GO database; (C) uncharacterized proteins in the database based on manual inspection. These proteins have no available published localization.
DYNAMIC PROTEOMICS INTERFACE
The Dynamic Proteomics interface (based on MySQL) is designed to make it easy for users to find genes of interest. The database offers a search for gene names (e.g. LMNA), DNA sequences (e.g. ATGGGAAAGAAAACCAAGCGGAC), protein description (e.g. ‘synthetases’), image or published localization (e.g. ‘cytoplasm’), exon-tag insertion point (e.g. ‘intron 1’). In addition, it provides an alignment of protein dynamics for user-defined gene names (e.g. ACTN4 GARS TOP1, separated by ‘space’) from the ‘Search Dynamics’ page. When a gene of interest has been selected, or if a query that entered matches a certain gene, the user is directed to the database entry page (for example, LMNA, Figure 2). This page is the primary interface for viewing the annotation of tagged proteins in the library, its fluorescent and phase images, protein dynamics, exon-tag insertion point, a protein sequence and references to the time-lapse microscopy movies. In addition, protein movies and dynamics can be viewed from the ‘All Movies/Dynamics’ page linked from the menu. It provides a list of all available movies for library clones, a search and an alignment of dynamics for the proteins of interest (Figure 3). Usually, one to six movies are presented for each protein in the database. Movies were selected manually according to QA standards (e.g. sufficient number of cells per field of view). Quantitative protein dynamics are displayed for available movies.
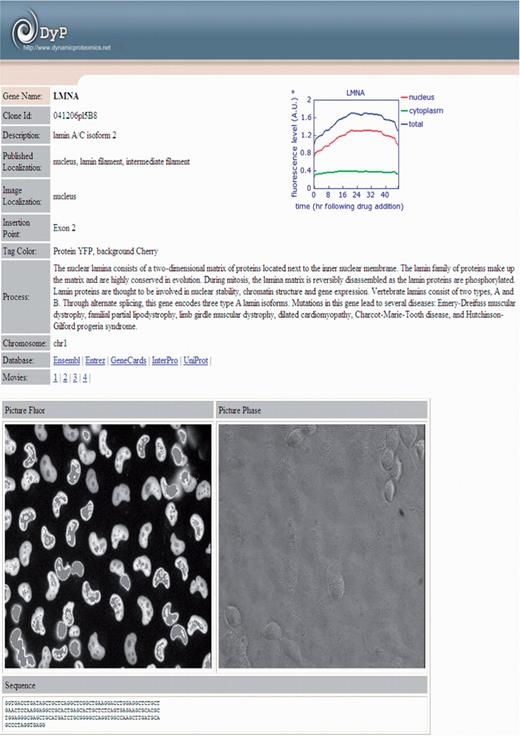
Example of the database entry page with a detailed protein annotation for LMNA (Lamin A/C isoform 2). The protein is localized in nucleus as it can be seen on the fluorescent image (white ‘beans’). This entry includes links to four microscopy movies. In addition, the clone ID, the published and image localizations, the protein description and annotation, the eYFP insertion point, the protein dynamics following drug addition, and links to other public databases are shown on the database entry page.
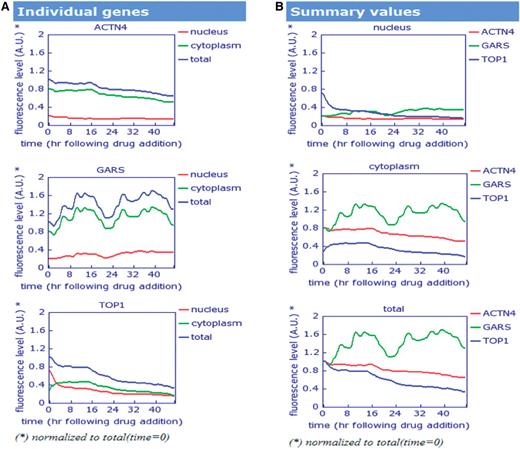
The alignment of protein dynamics for ACTN4 (actinin, alpha 4), GARS (glycyl-tRNA synthetase) and TOP1 (DNA topoisomerase I). (A) The dynamics is presented for the individual proteins normalized to the total fluorescence at time t = 0. (B) The alignment of protein dynamics in cytoplasm, nucleus and total protein dynamics are presented for all three proteins together.
LINKS TO OTHER DATABASES
Each entry in the Dynamic Proteomics is associated with a cDNA sequence, a detailed protein annotation obtained from the Ensembl (14) and Entrez (NCBI) databases. In additional, each protein has links to GeneCards (15), InterPro (16) and UniProt (17) for the complete protein sequence information.
QUANTITATIVE PROTEIN DYNAMICS
The presentation and alignment of protein dynamics are produced by PERL script running online. The protein dynamics alignment is obtained by placing each profile onto a common time scale (hours, following drug addition) with zero corresponding to the drug-addition time point for the corresponding clone. All fluorescence levels are normalized to the total fluorescence at time point zero (t = 0) (Figure 3). Such normalization is helpful because fluorescence levels vary between different proteins. Details on the image analysis methods used for producing protein dynamics is presented by Cohen et al. and Sigal et al. (1–4). Figure 3 displays the protein-dynamics alignment results for proteins: ACTN4 (actinin, alpha 4), GARS (glycyl-tRNA synthetase) and TOP1 (DNA topoisomerase I).
SEQUENCE COMPARISON TOOL
Using the MySQL database and the FASTA sequence comparison tool (18), the ‘Sequence Analysis’ page provides a powerful search engine for user sequences. Users can enter up to 50 different DNA sequences and search over all cDNAs in the database. The query parameters are passed to the search engine using CGI. Query results are presented with a corresponding query or gene name. The results refer to the proteins in the Dynamic Proteomics database, links to their movies and dynamics. The alignment of proteins dynamics can be obtained from the result page.
RAW MOVIES DATA
The Dynamic Proteomics database provides the raw data of the time-lapse microscopy experiments for 50 proteins at the ‘Raw Data’ page. For all other proteins, the data are available from the authors. The data includes three types of movies: cell background (fluorescently mCherry-colored), the protein fluorescent (eYFP- or Venus-colored) and phase (1). The raw movies may be useful as a benchmark dataset for developing image analysis tools.
DATABASE ACCESS AND FEEDBACK
The Dynamic Proteomics databases can be accessed online (http://www.dynamicproteomics.net or http://www.weizmann.ac.il/mcb/UriAlon/DynamProt/). The database is regularly updated with new clones, images, movies and dynamics. The ftp access to a bulk download of all images and movies in the database is provided from the public directory: ftp://alon-serv.weizmann.ac.il/pub/dynamprot/. Statistics are available with each update at the ‘Statistics’ page. We consider user feedback as extremely valuable. Please contact us at [email protected].
OUTLOOK
The Dynamic Proteomics version 1.0 database contains more than 2180 fluorescently tagged proteins in the H1299 non-small lung cell carcinoma line. We expect this number to increase, and new cell lines to be tagged. We invite other authors to submit their measured or calculated protein dynamics using the raw data provided by the database.
ACKNOWLEDGEMENTS
The authors thank the Kahn Family Foundation and the Israel Science Foundation for the project support. M.F.M. and E.E. are supported by the Horowitz Center for Complexity Science. The authors also thank Pierre Choukroun and Michael Green for the UNIX system administration; Malka Cymbalista and Shlomit Afgin for a technical help in the website and database construction.
FUNDING
Funding for open access charge: The Kahn Family Foundation and the Israel Science Foundation.
Conflict of interest statement. None declared.
REFERENCES
Author notes
Present address: Milana Frenkel-Morgenstern, CNIO, C/Melchor Fernandez Almagro, 3, Madrid, E-28029 Spain.

Comments