


ABSTRACT
The internal transcribed spacer 2 (ITS2) is a widely used phylogenetic marker. In the past, it has mainly been used for species level classifications. Nowadays, a wider applicability becomes apparent. Here, the conserved structure of the RNA molecule plays a vital role. We have developed the ITS2 Database (http://its2.bioapps.biozentrum.uni-wuerzburg.de) which holds information about sequence, structure and taxonomic classification of all ITS2 in GenBank. In the new version, we use Hidden Markov models (HMMs) for the identification and delineation of the ITS2 resulting in a major redesign of the annotation pipeline. This allowed the identification of more than 160 000 correct full length and more than 50 000 partial structures. In the web interface, these can now be searched with a modified BLAST considering both sequence and structure, enabling rapid taxon sampling. Novel sequences can be annotated using the HMM based approach and modelled according to multiple template structures. Sequences can be searched for known and newly identified motifs. Together, the database and the web server build an exhaustive resource for ITS2 based phylogenetic analyses.
INTRODUCTION
The internal transcribed spacer 2 (ITS2) of the nuclear rDNA cistron is a widely used phylogenetic marker. In its early years it was specifically used for low-level phylogenetic analyses, i.e. of species within the same genus. At that time, only nucleotide information of the fast evolving sequence was used. With analyses of the two-dimensional structure of the molecule it became evident that the structure is highly conserved throughout the eukaryotes (1–3). The combination of a fast evolving sequence with a slow evolving structure within one molecule suggested its capability for higher level classifications (4). In the last years, the ITS2 has been revealed to be more than just an excellent phylogenetic marker. Its applications include usage as a marker for species identification in environmental samples (phylochips) (5,6), as a target molecule for barcoding (7,8) and for distinguishing species (9). In many of these cases, the structure plays a fundamental role.
Even though sequence databases typically include a large quantity of ITS2 sequences, no coherent information source existed so far including both sequence and structure information, with ITS2 specific annotations. As a consequence of this lack, every scientist had to predict the structure of each molecule in his/her dataset more or less manually. Even worse, in the majority of phylogenetic procedures as e.g. alignment or tree calculation the structure could not be used at all as the corresponding software was not capable of integrating the structure information. In order to tackle these problems and to be better able to exploit the power of this intriguing molecule, we have developed the ITS2 Database. Its goal is to provide a valid structure for every ITS2 sequence within GenBank and thereby to become an exhaustive data source for sequence/structure based phylogenetic analyses, as well as offering tools capable of exploiting the information surplus obtained by these secondary structures. In this article, we describe additions to the ITS2 Database in terms of (i) new developments in automated structure prediction, (ii) new features for the access to the data via the Web interface and (iii) new tools for the analysis of ITS2 sequences.
DATA GENERATION
In the previous version of the database, we used a BLAST (10) based approach for the detection of ITS2 in un-annotated GenBank (11) sequences. We were able to predict the structure of more than 35 000 ITS2 where the start- and end-positions were either lacking or misidentified. As BLAST per se is a local alignment tool (hence the name) and the sequence length is very variable throughout the eukaryotes, heuristics had to be implemented to identify the start and end points of the ITS2. To improve this approach, we have recently developed a Hidden Markov Model (HMM) based method for the correct delineation of the ITS2 (12). Start and end position are inferred from the surrounding 5.8S and 28S regions, that are highly conserved. This method initiated a complete re-design of data generation for the ITS2 Database (Figure 1). In the initial step, we searched through the complete nucleotide database (nt) of GenBank for potential ITS2 sequences using hmmsearch (13). Simultaneously, all annotated ITS2 were extracted from GenBank. In cases where both methods were informative about the position of the ITS2, the HMM based information superseded that from GenBank. This led to 196 697 sequences with positional information of the ITS2 (Database accessed at the 22 June 2009). In the second step, all retained sequences were folded using UNAfold (14). Typical ITS2 features were shown by 63 645 structures, namely the conserved core of four helices with the third as the longest. This was a substantial increase compared to the previous approach where only GenBank annotations were taken into account. This indicated the necessity of a correct delineation for the folding step. In the next step, these structures served as templates in the homology modelling process. In contrast to the previous approach, we iterated the homology modelling process until no further new correct structures were identified. This resulted in an additional 99 010 predicted full-length structures, further underlining the presence of a conserved structural core of the ITS2 throughout all eukaryotes. Remaining sequences which could either not be homology modelled or where start and end position could not be predicted run through a final step resulting in partial structures. A BLAST search against all identified sequence structure pairs was performed. All significant hits (E-value < 10−10) were extended in both directions by five bases. Finally, we applied a less strict homology modelling which required at least two concatenated helices with a transfer larger than 75% each. This resulted in more than 50 000 partial structures. Using the modified pipeline, which would run in a single core 1221 days, we now provide structural information for over 210 000 ITS2, doubling the number of the previous version. As a detailed taxonomic breakdown (Table 1) the best coverage is found in fungi and plants with 80 and 93%, respectively. Only for ∼25% of the metazoan ITS2 sequences, a structure could be predicted. This could indicate a deviation from the ‘common core’. It could also be caused by problems of UNAfold to identify the correct fold, leading to a paucity of templates for homology modelling. Additionally, the ITS2 Database now contains a record for each GenBank entry which was identified either via textual annotation or our HMM based annotation tool, rendering it as an exhaustive resource for ITS2 sequences and structures.
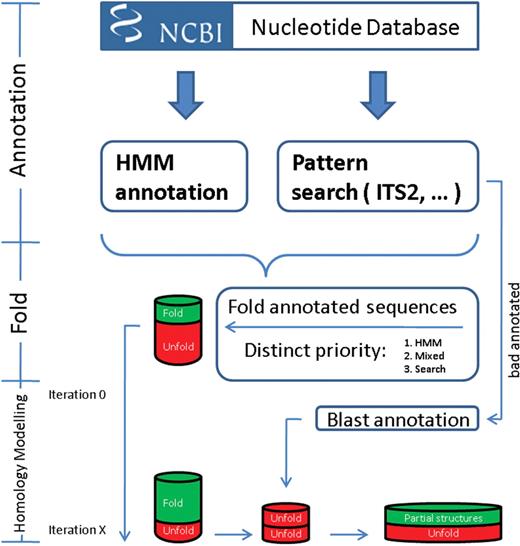
Flow chart of the new pipeline for the ITS2 annotation.
Taxonomic breakdown of predicted ITS2 structures
| Structure | Partials | All | ||||
| Count | Percentage | Count | Percentage | Count | Percentage | |
| Alveolata | 1750 | 34.67 | 947 | 18.76 | 5048 | 53.43 |
| Amoebozoa | 19 | 13.01 | 9 | 6.16 | 146 | 19.18 |
| Apusozoa | 0 | 0.00 | 0 | 0.00 | 35 | 0.00 |
| Choanoflagellida | 0 | 0.00 | 0 | 0.00 | 1 | 0.00 |
| Cryptophyta | 25 | 38.46 | 17 | 26.15 | 65 | 64.62 |
| Environmental samples | 26 | 28.26 | 7 | 7.61 | 92 | 35.87 |
| Euglenozoa | 3 | 0.62 | 191 | 39.71 | 481 | 40.33 |
| Fornicata | 0 | 0.00 | 0 | 0.00 | 3 | 0.00 |
| Fungi | 79 251 | 59.14 | 28 124 | 20.99 | 134 005 | 80.13 |
| Fungi/Metazoa incertae sedis | 2 | 2.86 | 0 | 0.00 | 70 | 2.86 |
| Haptophyceae | 6 | 19.35 | 3 | 9.68 | 31 | 29.03 |
| Heterolobosea | 1 | 0.59 | 1 | 0.59 | 170 | 1.18 |
| Metazoa | 4754 | 20.14 | 1357 | 5.75 | 23 603 | 25.89 |
| Nucleariidae | 0 | 0.00 | 0 | 0.00 | 2 | 0.00 |
| Parabasalidea | 1 | 0.51 | 0 | 0.00 | 197 | 0.51 |
| Rhizaria | 12 | 2.66 | 2 | 0.44 | 451 | 3.10 |
| Rhodophyta | 27 | 3.52 | 28 | 3.65 | 768 | 7.16 |
| Stramenopiles | 4441 | 52.01 | 2537 | 29.71 | 8539 | 81.72 |
| Viridiplantae | 72 322 | 72.95 | 20 488 | 20.67 | 99 141 | 93.61 |
| Sum | 162 640 | 59.61 | 53 711 | 19.69 | 272 848 | 79.29 |
WEB INTERFACE
Search tab
In addition to a search for sequences and structures with GenBank identifiers or species information, we now also provide a BLAST based search. However, standard BLAST procedures are frequently not able to identify distantly related ITS2 sequences because of their high sequence divergence. To overcome this hindrance, we have implemented a sequence and structure based BLAST search that includes information about the highly conserved structure for the homology search. The sequence-structure BLAST uses an ITS2 specific 12 × 12 scoring matrix representing each nucleotide/structure combination as tuple. This matrix is also used in 4SALE (15) and, as corresponding rate matrix, in ProfDistS (16) for automatic sequence-structure alignment and phylogenetic reconstruction, respectively. Thus, species sampling that starts with any sequence of interest and covers broad taxonomic ranges has become as simple as a BLAST search.
Annotate tab
The web interface does not only present access to the information stored in the database. Further, it provides tools for researchers to process newly determined sequences and to integrate them with already published ones. As shown in the data generation pipeline, correct delineation of the ITS2 sequence can be crucial for structure prediction. We therefore have implemented a web-based interface for the HMM based annotation. It integrates five taxon-specific HMMs for searches and several individually selectable parameters, as e.g. cut-off E-value or size limitation. As a result, delimited ITS2 sequences are shown as well as the predicted hybrid of 5.8S and 28S rRNA as a confirmation of the HMM annotation's accuracy (12).
Model tab
After annotation of newly retained ITS2 sequences and selection of a taxon sampling from the ITS2 Database, secondary structures may be determined by two means: First, prediction may be accomplished by homology modelling with the complete set of sequences and structures of the database serving as templates (Predict tab). A second approach is to identify the best template structure within the taxon sampling and use it for homology modelling of the remainders (Model tab). To date, one had to manually run through all possible templates and select the one which resulted in the highest helix transfer percentages. To avoid this tedious and somewhat arbitrary procedure, we now provide the possibility to use multiple sequence-structure pairs to model multiple target sequences. The database will calculate all against all structures and select the template which resulted in the homology prediction with highest percentages of helix transfers for all target sequences.
Similarly, suboptimal structures of a sequence as e.g. retained from minimum free energy folding software, may be given as template input for a set of sequences. As a result, the database will model the structure for all requested sequences with the best fitting suboptimal secondary structure. This is needed, as sometimes the energetically best structure is not the biologically correct one. As the complete homology modelling approach is independent of the ITS2, it may be used to predict the secondary structure of any RNA given a homologous molecule with a known structure.
Motif tab
In addition to the overall structure, conserved motifs like an UGGU sequence preceding the apex of the third helix and a pyrimidine–pyrimidine mismatch in the second helix have been described for the ITS2 (2). In the aforementioned study, identification of these motifs was based on a small dataset and performed mainly by manual inspection. With the availability of the large set of ITS2 sequences in our database, we searched in an automatic way (17) for highly conserved motifs in the ITS2. From our pool of homology models, we randomly extracted a set of unique species. Analysing separately fungal and plant alignments, known and novel motifs were identified. Although the UGGU motif 5′ side to the apex of helix III differs in its composition for fungi, it is located in a corresponding position. For both kingdoms, the U–U mismatch is surrounded by two motifs: one to the left of helix II and one to the right between helix II and III with additional AAA (Figure 2). Having transformed these sequence motifs into HMMs, we now provide identification of these motifs in sequences of interest (Motif tab).
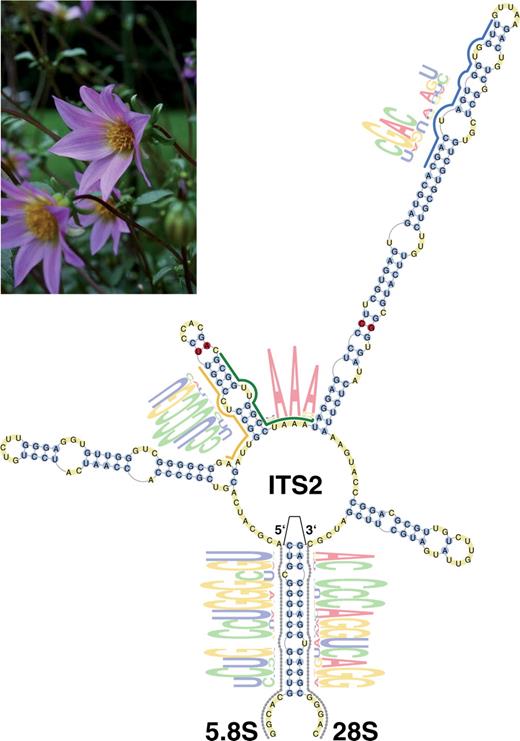
General ITS2 topology and visualization of plant HMM motifs for the secondary structure of D. brevis (gi: 31281745). Annotation from HMMs of 5.8S and 28S are displayed as dotted lines tracing the outline of their position, whereas the ITS2 motif HMMs are represented by coloured lines. In parts of these motifs, nucleotide frequencies are presented (21,22). Nucleotides are coloured yellow in unpaired regions, whereas paired nucleotides are blue. CBCs between secondary structures of D. brevis and D. scapigeroides (gi: 31281755) are shown in red.
The ITS2 of Dahlia brevis as an example
As an example to illustrate the information that can be extracted from the database and the Web interface we analysed the ITS2 of D. brevis (18). Looking up the entry for the GenBank identifier 31281745 in the ITS2 Database revealed a stereotypical ITS2 structure (Figure 2). It adopts the common four helix structure with the third as the longest. Additionally, all sequence motifs characteristic for plants are present. In a comparison with another species, here D. scapigeroides (gi: 31281755), two Compensatory Base Changes (CBCs) could readily be identified. Indeed, two sequences belong with a probability of 93% to two different species, if at least one CBC is present (9). It should be mentioned, that the CBC criterion works only in one direction. The presence of more than one CBCs indicates with high probability two different species, if there is no CBC, there still could be two species. As D. brevis follows all the stereotypes of an ITS2 as the best scoring sequence resulting from all motif searches, it was selected as the ‘May 2009’ ITS2 in the newly added rubric ‘ITS2 of the Month’.
CONCLUSIONS
With the new pipeline for structure prediction, the ITS2 Database now provides information about the structure of more than 210 000 ITS2 molecules, nearly 80% of all ITS2 sequences in GenBank, covering all major taxonomic units. Having the structure available is only the first step for a successful phylogenetic analysis. It would be a pity to use the structure only for the manual refinement of an alignment and neglect it in all other steps. We thus have developed additional stand-alone programs for the entire procedure, which includes automatic alignment calculation [4SALE (15)] as well as tree reconstruction [ProfDistS (16)] considering both, sequences AND secondary structures (these programs have to be downloaded separately). Together, they are seamlessly integrated into a pipeline from sequence through structure and finally to the phylogenetic tree (19). Finally, species boundaries in the dataset can be estimated using the CBCanalyzer [(20), meanwhile also implemented in 4SALE].
The application of secondary structures for the reconstruction of phylogenies improves not only the stability of resulting trees, but more importantly increases the accuracy of phylogenetic estimations (muanuscript under preparation). Thus, it would be desirable to include structural information not only for the ITS2, but also for other frequently used phylogenetic RNA markers.
ACKNOWLEDGEMENTS
We would like to thank Art Vogel (Hortus botanicus Leiden) for permission to use his beautiful photography of Dahlia brevis.
FUNDING
Deutsche Forschungsgemeinschaft (DFG) (grant Mu-2831/1-1 to C.K. and T.S.); BIGSS graduate school (to A.K.); Bundesministerium für Bildung und Forschung (BMBF) (grant FUNCRYPTA to F.F.).
Conflict of interest statement. None declared.
REFERENCES
Author notes
The authors wish it to be known that, in their opinion, the first two authors should be regarded as joint First Authors.
Present address: Roland Schwarz, Cancer Research UK Cambridge Research Institute, Li Ka Shing Centre, Robinson Way, Cambridge, CB2 0RE, UK.

Comments