


Abstract
The mouse genome database (MGD, Author Webpage), the international community database for mouse, provides access to extensive integrated data on the genetics, genomics and biology of the laboratory mouse. The mouse is an excellent and unique animal surrogate for studying normal development and disease processes in humans. Thus, MGD's primary goals are to facilitate the use of mouse models for studying human disease and enable the development of translational research hypotheses based on comparative genotype, phenotype and functional analyses. Core MGD data content includes gene characterization and functions, phenotype and disease model descriptions, DNA and protein sequence data, polymorphisms, gene mapping data and genome coordinates, and comparative gene data focused on mammals. Data are integrated from diverse sources, ranging from major resource centers to individual investigator laboratories and the scientific literature, using a combination of automated processes and expert human curation. MGD collaborates with the bioinformatics community on the development of data and semantic standards, and it incorporates key ontologies into the MGD annotation system, including the Gene Ontology (GO), the Mammalian Phenotype Ontology, and the Anatomical Dictionary for Mouse Development and the Adult Anatomy. MGD is the authoritative source for mouse nomenclature for genes, alleles, and mouse strains, and for GO annotations to mouse genes. MGD provides a unique platform for data mining and hypothesis generation where one can express complex queries simultaneously addressing phenotypic effects, biochemical function and process, sub-cellular location, expression, sequence, polymorphism and mapping data. Both web-based querying and computational access to data are provided. Recent improvements in MGD described here include the incorporation of single nucleotide polymorphism data and search tools, the addition of PIR gene superfamily classifications, phenotype data for NIH-acquired knockout mice, images for mouse phenotypic genotypes, new functional graph displays of GO annotations, and new orthology displays including sequence information and graphic displays.
INTRODUCTION
The mouse genome database (MGD) is a comprehensive, integrated system for exploring genetic, genomic and biological information for the laboratory mouse (1–3). MGD facilitates the study of human biology and disease by supporting the mouse as an exquisite model system and enables hypothesis generation through its integration of diverse data and use of semantic standards. Core data include sequences, maps, genes, gene function, gene families, strains, mutant phenotypes, disease models, mammalian orthologies, single nucleotide polymorphisms (SNPs) and other polymorphisms (Table 1). Data are integrated through a combination of expert human curation and automated processes that determine object identities and shared relationships and use a variety of controlled/structured vocabularies (ontologies), including the Gene Ontology (GO), Mammalian Phenotype (MP) Ontology, Anatomical Dictionary for Mouse Development, OMIM, InterPro and PIR super families. Collaborative efforts with other large genome informatics resources increase data accuracy through joint curation to resolve inconsistencies. MGD provides authoritative data for the research community on nomenclature for mouse genes, alleles, and strains, and GO annotations for mouse gene function. MGD also is the hub for mouse phenotype information, providing robust access to phenotypic data for human users and for computational applications.
Snapshot of data content in MGD: October 2, 2006
| MGD data statistics | October 2, 2006 |
|---|---|
| Number of genes with sequence data | 27 906 |
| Number of genes (including uncloned mutations) | 30 893 |
| Number of markers (including genes) | 57 375 |
| Number of markers mapped | 55 326 |
| Number of genes with protein sequence information | 20 247 |
| Number of genes with GO annotations | 17 304 |
| Number of mouse/human orthologies | 15 672 |
| Number of mouse/rat orthologies | 14 758 |
| Number of genes with one or more phenotypic alleles | 6717 |
| Number of cataloged phenotypic alleles | 16 416 |
| Number of references | 107 170 |
| Number of RefSNPs | 6 348 628 |
| Number of mouse nucleotide sequences integrated into the MGI system (includes ESTs) | >8 400 000 |
MGD data available via the website are updated daily. MGD exchanges data with genome resources such as NCBI and UniProt weekly. Software releases that occur as projects are completed, generally 4–6 times annually. A recent snapshot of MGD content is shown in Table 1. MGD continues to evolve, expanding its data coverage, improving data access, and providing new data query, analysis and display tools. Computational users and genome centers can access MGD data through daily file reports available via FTP and through direct SQL.
MGD is a core component of the Mouse Genome Informatics (MGI) database resource (Author Webpage) hosted at The Jackson Laboratory (Author Webpage). Other projects and resources that are part of the MGI system include the Gene Expression Database (GXD) (Author Webpage) (4) and the Mouse Tumor Biology (MTB) Database (Author Webpage) (5). All MGI component groups participate actively in the development and application of the GO (Author Webpage) (6).
IMPROVEMENTS DURING 2006
Mouse SNPs integrated in MGD
Mouse SNPs have been incorporated into MGD. A comprehensive summary report is provided that gives an overview of SNP numbers by strain, by chromosome and by SNP data submitter (Author Webpage). Users can query for SNPs by strain, strain comparisons, SNP attributes (variation type and functional class), map position, marker range, or by association to MGD genes and genetic markers. Output can be customized, for example to display SNPs among strains or SNPs showing only differences compared to a specific strain. A tab-delimited output option is available for visualizing presumptive haplotype blocks. Figure 1A displays output searching for a simple search of all SNPs detected for the Fgf1 gene. For each SNP, the nucleotide present at each site for each strain is given, color-coded by nucleotide. Links are provided to a MGI SNP Detail page (Figure 1B), as well as to the Mouse Phenome Database (MPD), NCBI's dbSNP database and to the MGI Gene Detail page for the gene in which the SNP is detected.
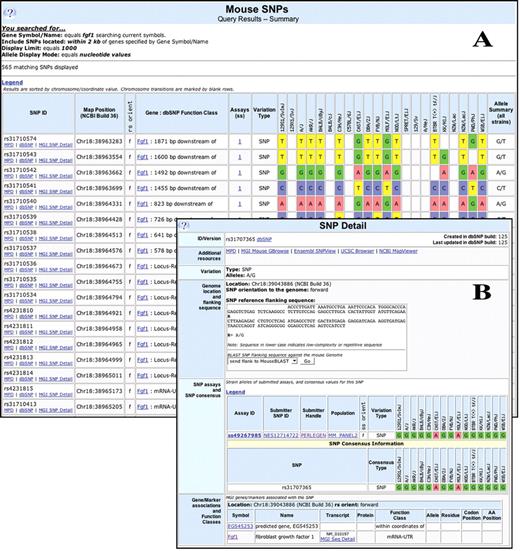
SNP searches and displays: (A) A partial screen shot showing 18 lines (of 565) returned after searching MGI SNP data for SNPs for the gene Fgf1. (B) Details of one of the SNPs for Fgf1.
Protein Superfamily Vocabulary Browser
For locating links between MGD mouse genes and the protein classes, MGD now incorporates UniProt PIRSF (Protein Information Resource Superfamily) protein classifications into a Protein Superfamily Vocabulary Browser (Author Webpage). Figure 2 shows a protein superfamily detail page for the pepsin genes, listing the mouse superfamily members and any human and rat orthologs. Options on this page also provide users the opportunity to download available sequences in FASTA format or forward them to the MouseBLAST tool.
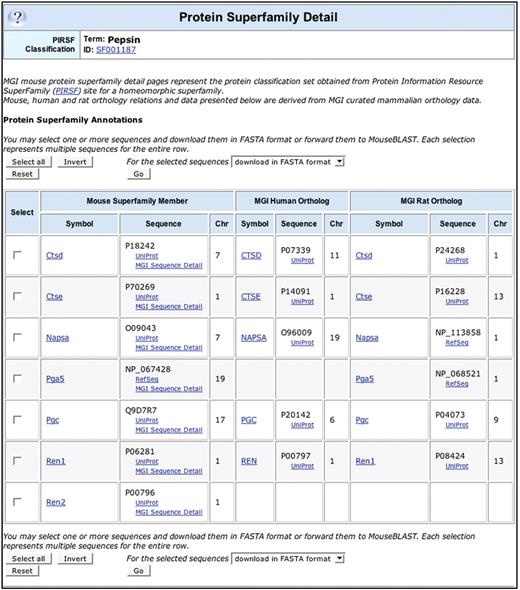
Protein Superfamily: MGI Pepsin superfamily page showing mouse superfamily members with associated UniProt protein links and orthologs of each gene member in human and rat. Protein sequences from this page may be downloaded in FASTA format or forwarded to the MouseBLAST tool.
Phenotype data for NIH-acquired knockout mice
In 2006, the NIH reached an agreement that has allowed the distribution of mutant mice and frozen embryos from two private collections of knockout mice developed by Deltagen, Inc., and Lexicon Genetics, Inc. The data characterizing and phenotyping these animals have been deposited with MGD and are available through our web interface (WI). By integrating this phenotype data with MGD, users can search simultaneously for all phenotype data, regardless of its source. A list of these NIH-acquired mutants can be found at Author Webpage; to search all phenotypes in MGD, use the phenotype search form at Author Webpage.
Images of phenotypic genotypes of mice
MGD now adds image data to phenotypic descriptions of mutant genotypes whenever available. Although current images focus on visible external phenotypes, such as pigmentation changes, limb, eye, or ear abnormalities, and coat texture, future images will also include histology, pathology, x-rays and whole animal imaging. Figure 3 shows an allele record for Mregdsu (the dilute suppressor allele of the melanoregulin gene) with a thumbnail representative image in the allele page and a link to additional images available for this phenotypic mutant.
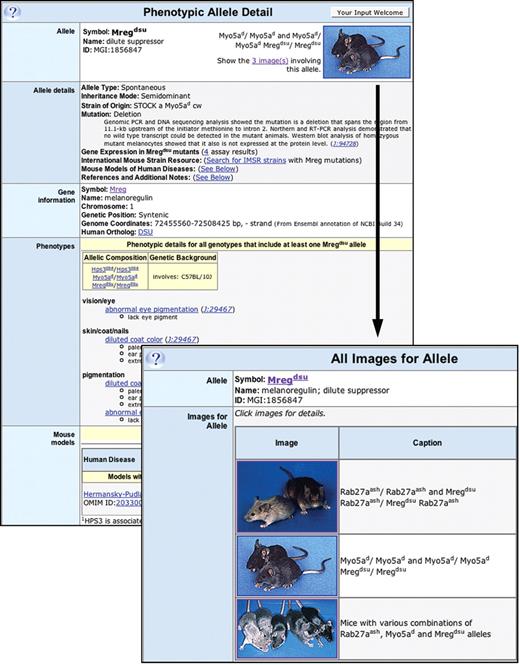
Images of phenotypic genotypes of mice: images are being incorporated into the allele detail page for phenotypic mutants. While these currently are limited to external visible phenotypes of whole mice, in the future other relevant images such as histological or microscopic or whole animal imaging will be available. This example shows the Mregdsu allele record and its associated thumbnail image, with links to all images currently available for this mutation.
Graph representation of GO annotations
MGD now provides an additional way to view functional (GO) annotations of genes. Previously, GO annotations were available in a standard tabular form and as computer generated text paragraphs. This year we have added a graphical view, where users can view the path from the term annotated, up the GO graph to the root terms (molecular function, cellular component and biological process) (Figure 4). This view allows users to visualize how terms are related and the granularity of the particular GO annotations.
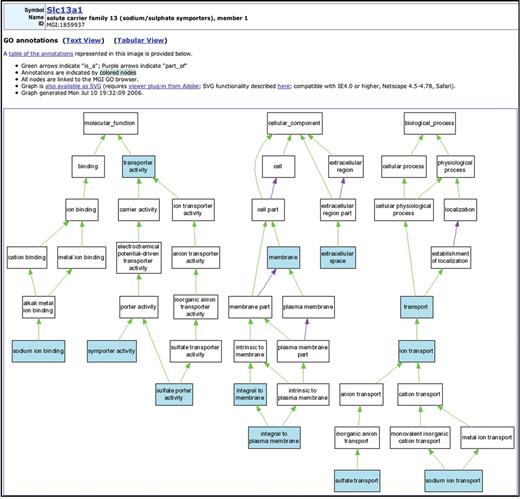
GO annotations as graphs: we provide a tabular presentation of GO information as well as a computationally generated text form of GO annotations. A new format is now available for users to visualize these data graphically. Here, a graphical view is presented for GO annotations to the Slc13a1 gene.
Enhanced mammalian orthology reports
The display of mammalian orthology has been enhanced to include a primary nucleotide and protein sequence for each ortholog and the ability to download these sequences as FASTA files or to forward them to the MGD MouseBLAST tool. In addition, new links are provided to VISTA homology plots, HomoloGene and to MGD's new mouse–human–rat comparative GO graph (Figure 5).
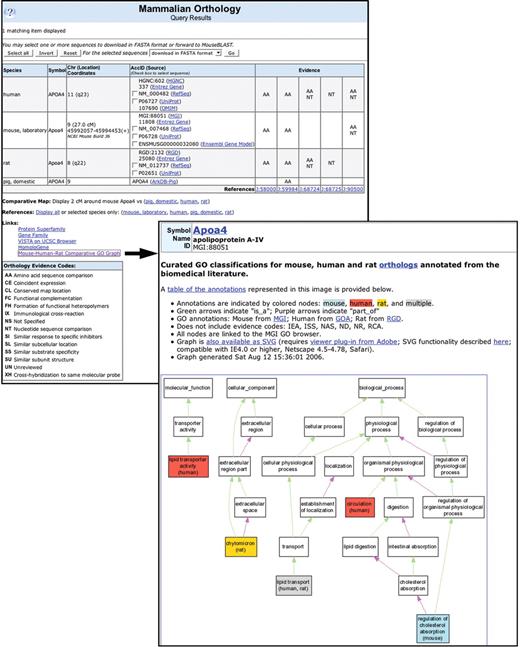
Enhanced orthology reports and comparative graphs: orthology pages now display nucleotide and protein sequences representative of the gene orthologs. These can be downloaded in FASTA format or forwarded to the MouseBLAST tool. A new mouse–human–rat comparative GO graph allows users to see similarities and differences in gene function as annotated by the respective species databases for the ortholog group being viewed. Here an example of the Apoa4 gene is shown.
OTHER ACTIVITIES OF NOTE IN 2006
MIT marker files and genome coordinates
MIT markers are commonly used STS markers, particularly for mapping QTL (quantitative trait loci). MGD now provides the original files from the Broad Institute (formerly the Whitehead Institute at MIT) including marker name, assay, primers and full assay sequences. In addition, genome coordinates for all MIT markers are available, thus making these markers accessible for searching the mouse genome assembly.
Electronic publication
We now have posted an electronic publication of Origins of Inbred Mice edited by Herbert C. Morse III. This out-of-print book, originally published in 1978, provides an historical perspective on the development of inbred mice. It is thoroughly indexed and linked to appropriate terms in MGD. This book joins other out-of-print classics of mouse genetics in electronic publication at MGD.
OTHER INFORMATION
Mouse gene, allele and strain nomenclature
The MGD gene annotation group assigns unique symbols and names to mouse genes, alleles and strains following the guidelines set by the International Committee on Standardized Genetic Nomenclature for Mice (Author Webpage). The official nomenclature for mouse genes, allele and strains is becoming widely disseminated through regular data exchange and curation of shared links between MGI and other bioinformatics resources, and increasing adherence of journal publications to nomenclature standards. The MGI nomenclature group works closely with nomenclature specialists for human (Author Webpage) and rat (Author Webpage) to provide consistent nomenclature for mammalian species. The mouse and human nomenclature committees collaborate with scientific experts in specific domain areas to develop a systematic nomenclature for those genes that should be grouped together in a family, such as the ARID family (7) or to revise the nomenclature for an already established gene family, such as the ACOT family (8). Scientists can contact the MGD nomenclature coordinator by email ([email protected]) and can reserve symbols prior to publication using the electronic nomenclature submission form (Author Webpage).
Electronic data submission
Any type of data that MGD maintains can be submitted as an electronic contribution. Over the last year, the most frequent submissions have been of mutant and phenotypic allele information originating with the large mouse mutagenesis centers and repositories that contribute data sets to the International Mouse Strain Resource (IMSR, Author Webpage) (9). Other common types of submission include mutant and QTL mapping data. Each electronic submission receives a permanent database accession ID. All data sets are associated with their source, either a publication or an electronic submission reference. MGD reference pages provide links to associated data sets. On-line information about data submission procedures is found at Author Webpage.
Community outreach and user support
MGD provides extensive user support through on-line documentation and easy email or phone access to User Support Staff.
User Support can be accessed by:
World wide web: Author Webpage
Email access: [email protected]
Telephone access: +1 207 288 6445
FAX access: +1 207 288 6132
Other outreach
MGI-LIST (Author Webpage) is a moderated and active email bulletin board supported by the MGI User Support group.
HIGH LEVEL OVERVIEW OF THE MAIN COMPONENTS AND IMPLEMENTATION
Here, we summarize the high level functionality of the major components of the system. At the heart of MGD is the database itself. MGD is implemented in the Sybase relational database management system. Its ∼180 tables form the core within which the biological information is stored. Additional sequence data such as BLAST-able databases and genome assembly files are stored outside the relational database. There are two primary vehicles by which data are entered into MGD: the editing interface (EI) and automated load programs. The EI is an interactive, graphical application. Curators use the EI to enter new data from the literature, to verify the results of automated loads and to correct errors. The automated load programs integrate larger data sets from many sources into the database. Automated loads involve quality control (QC) checks and processing algorithms that integrate the bulk of the data automatically and identify issues to be resolved by curators or the data provider. Through these two vehicles, the EI and automated loads, we are able to acquire and integrate large amounts of data into high-quality, curated information.
There are several different routes for public data access. The WI is the main tool allowing users to query interactively and display our data through a web browser. MouseBLAST allows users to do sequence similarity searches against a variety of rodent-relevant sequence databases that are built weekly from selected sequence databases from NCBI, UniProt and other providers. Mouse GBrowse allows users to visualize mouse data sets against the genome as a series of linear tracks. Supplementing these three interactive tools is a large collection of public database reports generated nightly. These reports provide concise listings of large subsets of data, for example, all mouse/human homologies. They are a major source for other data providers who link to or use MGD data in their products and for computational biologists who use MGD data in their analyses. Direct SQL access to the database is available for sophisticated users who wish to construct custom queries or to perform analyses not possible through the WI. Finally, we are developing a web services API that will provide another programmatic route into MGD.
CITING MGD
For a general citation of the MGI resource, please cite this article. In addition, the following citation format is suggested when referring to datasets specific to the MGD component of MGI: mouse genome database (MGD), MGI, The Jackson Laboratory, Bar Harbor, Maine (URL: Author Webpage). [Type in date (month, year) when you retrieved the data cited.]
The Mouse Genome Database is supported by NIH/NHGRI grant HG000330. Funding to pay the Open Access publication charges for this article was provided by The Mouse Genome Database.
Conflict of interest statement. None declared.
REFERENCES
Author notes
†The Mouse Genome Database Group: M. T. Airey, A. Anagnostopoulos, R. Babiuk, R. M. Baldarelli, M. Baya, J. S. Beal, S. M. Bello, D. W. Bradt, D. L. Burkart, N. E. Butler, J. Campbell, L. E. Corbani, S. L. Cousins, D. J. Dahmen, H. Dene, M. E. Dolan, H. J. Drabkin, Kim L. Forthofer, K. S. Frazer, P. Frost, D. E. Geel, J. R. Lewis, I. Lu, L. J. Maltais, M. McAndrews-Hill, S. McClatchy, M. J. McCrossin, D. B. Miers, L. A. Miller, L. Ni, H. Onda, J. E. Ormsby, T. B. K. Reddy, D. J. Reed, B. Richards-Smith, D. R. Shaw, R. Sinclair, C. L. Smith, P. Szauter, M. Tomczuk, M. A. Updegraaf, L. L. Washburn, I. T. Witham and Y. Zhu

Comments