


Abstract
Multi-locus and multi-species nucleotide diversity studies would benefit enormously from a public database encompassing high-quality haplotypic sequences with their associated genetic diversity measures. MamPol, ‘Mammalia Polymorphism Database’, is a website containing all the well-annotated polymorphic sequences available in GenBank for the Mammalia class grouped by name of organism and gene. Diversity measures of single nucleotide polymorphisms are provided for each set of haplotypic homologous sequences, including polymorphism at synonymous and non-synonymous sites, linkage disequilibrium and codon bias. Data gathering, calculation of diversity measures and daily updates are automatically performed using PDA software. The MamPol website includes several interfaces for browsing the contents of the database and making customizable comparative searches of different species or taxonomic groups. It also contains a set of tools for simple re-analysis of the available data and a statistics section that is updated daily and summarizes the contents of the database. MamPol is available at Author Webpage and can be downloaded via FTP.
INTRODUCTION
Nucleotide sequences available in public databases for different organisms can be used to describe the general patterns of genetic diversity in natural populations across a wide spectrum of different taxa (1) and to infer the molecular evolutionary forces that shape the observed patterns (2,3). For this endeavor, a secondary database that provides searchable collections of polymorphic sequences with their associated genetic diversity measures would greatly facilitate both multi-locus and multi-species diversity studies. However, population geneticists still lack this basic resource.
Databases of genetic polymorphisms such as Popset (4), ALFRED (5) and dbSNP (4) rely on author submissions and contain little additional data analysis. On the contrary, Polymorphix (6) is a database that collects eukaryotic genomic DNA sequences available in EMBL/GenBank and groups them by similarity and bibliographic criteria, but does not provide any measure of sequence diversity. The only database that provides genetic diversity estimates and also permits queries about polymorphic sequences by such estimates is the Drosophila Polymorphism Database, DPDB (7). DPDB stores all the well-annotated nuclear sequences of the Drosophila genus available in GenBank, grouped by organism, gene and degree of similarity in polymorphic sets, and provides the commonly used measures of diversity. Database building and updating is totally automated using PDA software (8).
The Mammalia class is the taxonomic group with the largest amount of nucleotide information. Most intraspecies nucleotide variation in this taxon comes from the analyses of haplotypic sequences for one or more genes in a given species, but no database permits searches for polymorphic sets in accordance with different parameter values of nucleotide diversity, linkage disequilibrium or codon bias. Here we present a new database containing polymorphism data for the Mammalia class, including both nucleotide sequences and their associated diversity estimates, which was built using the DPDB database as a reference. Human data have not been included, because an extensive SNP database for human polymorphism already exists (HapMap) with more than 11 million SNPs positioned in the genome (4,9).
The MamPol database provides estimates of both one-dimensional and multi-dimensional measures of nucleotide diversity in polymorphic sets. One-dimensional measures, such as the distribution of Nei's diversity values (10) along sliding windows, permit the detection of differently constrained regions (11). Multi-dimensional measures of diversity permit searches for association among variable sites, as summarized by linkage disequilibrium estimators, providing key information on the effective recombination and evolution of a DNA region (12).
The MamPol database was built using an optimized version of PDA v. 2 (8) that runs on a computing grid. We have also included a manually curated list of synonyms for mammalian gene names in order to detect and collect together sequences of the same gene that have been annotated differently. The database includes both nuclear and mitochondrial nucleotide sequences that can be queried independently in order to emphasize differences in their evolution due to their different origins (1). Another major improvement with respect to DPDB is the comparative search module, in which different taxa can be compared for diversity levels. All the data and results are stored in various MySQL databases that can be freely downloaded via FTP.
DATABASE BUILDING
Data retrieving
Data retrieving, calculation of the diversity measures and updating are performed by PDA (8), a pipeline made up of a set of Perl modules that automates the mining and analysis of data. PDA provides all the well-annotated genomic DNA sequences available in GenBank for mammals except for the genus Homo, as well as their associated information, and cross-references to Popset. To ensure that the sequences obtained are reliable, those coming from the CON, EST, GSS, HTC, HTG, PAT, STS, SYN and TPA sections are excluded before being downloaded. Entries matching the keyword ‘geneID’ are also excluded.
Gene synonyms and creation of polymorphic sets
Sequences are grouped by name of species and gene to create ‘polymorphic sets’ (7). As this process is totally automated, sequences corresponding to the same gene but with different gene names are placed in different groups. To avoid this, a list of synonymous gene names was manually created. The product of each gene name was searched in GenBank to facilitate the identification of synonymous gene names. Most of the synonymous gene names found differed only very slightly in terms of punctuation (e.g. beta casein versus beta-casein) or the order and/or length of the components (e.g. beta2 adrenergic receptor versus adrenergic receptor beta 2). Totally different gene names with the same product were putative synonymous gene names. To confirm that they correspond to the same gene, the names were consulted in the Entrez Gene section of GenBank (4) or in the BioThesaurus website (13). Both databases give species-specific gene aliases and because of that, gene aliases for one species might not be shared with others. To ensure that gene aliases comprised sequences from a single gene, a similarity search among the sequences was performed. Sequences for the same organism with 95% similarity or higher were considered as synonymous gene names and up to the 5% difference was attributed to population polymorphism. The final list available in the search pages of the website contains synonymous gene names taken from our data (except those that differ only in terms of punctuation or other small differences), the aim is to manage the database content properly without creating an extensive list.
Grouping by similarity and length
For each polymorphic set, subgroups of homologous sequences are created corresponding to the different functional regions (genes, CDSs, exons, introns, UTRs and promoters) found in the sequence annotations. Note that only sequences with functional regions in their annotations will be downloaded and grouped. Subgroups are aligned with ClustalW (14). ClustalW uses a fast and reliable multiple alignment algorithm to align sequences that supposedly are not very distant, as is the case with polymorphic sequences. ClustalW parameter values were optimized for alignments of polymorphic sequences. A 95% similarity between each pair of sequences in the alignment was fixed as the minimum percentage score (15). If the score assigned to a sequence is lower in comparison to any of the others, the sequence is extracted from the alignment. Sequences can also be substructured in different subsets. In this case, subsets are first made by considering the highest scores among the pairs of sequences, and second, their length in base pairs. Extraction from the group is random only when two sequences have the same score and length, since they supposedly contain the same amount of information.
By using this filter, most data heterogeneity can be avoided, e.g. two sequences corresponding to different genes but with the same gene alias are separated or two sequences corresponding to different parts of the same gene. However, paralogous genes, such as pseudogenes, with the same gene name annotation and those that have diverged by <5% will still be grouped together. On the other hand, highly polymorphic genes such as genes from the MHC will be grouped separately since their similarity is <95%. The reanalysis option (see Analysis Tools below) is useful for these special cases.
In order to increase the quantity of informative sites in the alignments, short sequences might be excluded from the alignments following the estimate optimization method (8). On these grounds, two or more subsets of sequences can be obtained from a given polymorphic set if sequences differ considerably in similarity and/or length. The final sets of sequences, on which estimates are performed, are called ‘analysis units’.
Diversity measures and data storage
Commonly used diversity measures are calculated on these analysis units, including polymorphism at synonymous and non-synonymous sites, linkage disequilibrium and codon bias [see Table 1 in Ref. (15) for a detailed description of all the estimates].
Both primary and secondary information is stored in relational MySQL databases (for structure see the Help section of the website). Sequences, polymorphic sets and analysis units are given a single identification number to facilitate cross-database referencing. The information is divided into three databases: (i) for primates, (ii) for rodents and (iii) for all other mammals. This division is the same as that made by GenBank to store the CoreNucleotide information and the sole intention is to make searches faster and at the same time totally transparent to the user.
The databases are updated daily, searching for new sequences in GenBank and reanalyzing only the affected polymorphic sets.
Computing grid
Creation of the complete database is a fully automated and highly time-consuming process, due to the large amount of sequences that must be retrieved and analyzed from GenBank. To cope with the computational burden, a pipeline has been implemented that is able to take advantage of the multiple computational resources available in the University's campus grid. These resources consist of more than 250 laboratory computers managed by Condor software (16), a high-throughput batch queuing system.
MamPol runs multiple instances of its internal modules on this computing pool during two specific stages of the creation of the database. These two stages were selected because they were suitable for a parallel decomposition that could achieve a significant reduction in computing time. First, concurrent access to sequences in GenBank is carried out by dividing the total set into small sequence subsets. Second, alignments in each subgroup of homologous sequences are executed concurrently by running multiple instances of ClustalW on different machines.
Significant improvements were achieved in the overall performance of our Condor-enabled version of MamPol when it was used to create the database for the Mammalia class. Over the course of the computation, up to 50 machines were used during the GenBank access stage (this took 1.5 h, in contrast to the 22 h taken by the sequential case) and up to 10 machines were used during sequence alignments (∼40 h, in contrast to 245 h in the sequential case).
While updating, if the number of sequences to retrieve and/or the number of polymorphic sets to reanalyze is high, the Condor-enabled version is used.
THE MamPol WEBSITE
The MamPol website (Author Webpage) integrates the information from the databases and offers several interfaces for browsing the contents of the database in different ways. It also includes tools for the reanalysis of polymorphic sets, a website Help section, a Statistics section in which the contents of the database are summarized and a series of links of interest classified by different categories. The database contents can also be downloaded via FTP.
Database queries and output
Queries about the contents of the database can be made using a web interface implemented as Perl CGI scripts based on SQL searches. The user can directly select the species of interest from the list of species or select a group in a higher taxonomic level in the taxonomic list. The latter is an expandable list, which includes all the taxonomic levels for the mammalian class and permits selection on any level. Gene names can also be selected from the list of genes or in the list of gene name aliases. In all these lists, mitochondrial and nuclear data are separated, as well as data for rodents, primates and all other mammals. These subdivisions are made to make searches faster and to facilitate searches of a particular subdivision, although combined queries can also be made.
General search
When selecting a polymorphic set, the user can also use filters for the diversity values and/or for the degree of confidence in the polymorphic set (see the Help section). The first output page lists all the polymorphic sets by organism, gene and analysis unit, showing additional information about the quality of the alignment, the confidence in the data source and the date of the last update. A complete report for each analysis unit can then be obtained through the corresponding link as well as access to the primary database (individual sequences, references and polymorphic studies in the Popset database). It is also possible to easily reanalyze any polymorphic set with PDA, including or excluding sequences or changing the default parameters. Furthermore, sequences can be directly downloaded in the FASTA format.
Graphical search
There is a graphical interface in which the user can select the graphical distribution of any of the diversity parameters estimated. Selection of the polymorphic sets and filters is the same as for the general search described above. The first output page shows the distribution of the selected parameter, which can be ordered by rank or by classes. Each class has a link for viewing the corresponding polymorphic sets as in the general search.
Comparative search
There is a totally new interface for making comparative searches among taxa (Figure 1). The user can select two or more species or taxonomic groups and compare the polymorphism levels at synonymous and non-synonymous sites, place filters for the quality of the alignments and select any functional region to be included in the search. The first output page gives the number of analysis units for each group and the mean values of the selected diversity values. Tajima's D estimates are divided into negative, zero and positive values. When the diversity mean value is different from zero and there are more than two analysis units, there is a link that displays the graphical distribution of the diversity parameter. There is also a link to the general search results page for each taxonomic group shown. Different functional regions are compared separately in order to avoid any overrepresentation of the same sequences (from different functional regions).
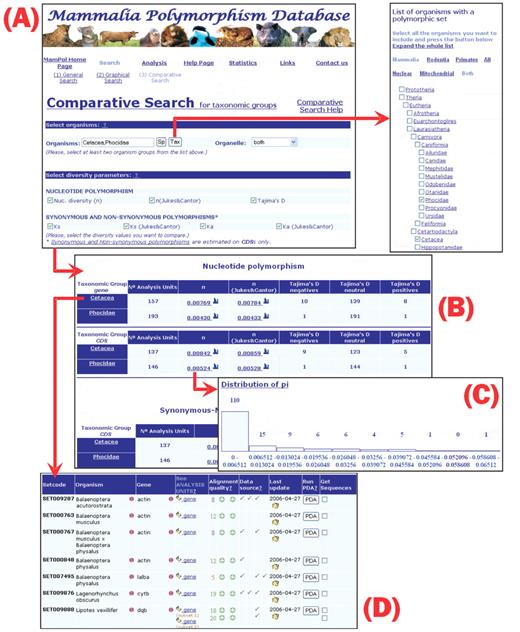
Example of the MamPol interface. We illustrate a comparative search comparing two distinct taxonomic groups: Phocidae and Cetacea. (A) Comparative Search page (with the taxon checking list window where the two taxa are selected). (B) First output page of the comparative query reporting all the analysis units and estimates of diversity for each taxon. (C) Distribution of Pi values for a taxonomic group and gene region. (D) Partial list of all polymorphic sets in the clicked Cetacea group, with its different analysis units.
Analysis tools
The website includes a set of common analysis tools running on our server, therefore avoiding the need for connection to other servers. These tools are divided into different modules for sequence comparison and the estimation of nucleotide diversity. The first module includes: (i) ClustalW software (v. 1.83), with the default parameters used to create the database; and (ii) Jalview (17), which makes it possible to display and edit sequence alignments. The second module includes two other tools: (i) SNPs-Graphic, which makes it possible to perform variation analysis using the sliding window method, obtaining both estimates in different regions of the alignment and graphic representations; and (ii) the PDA pipeline, whereby the user can reanalyze the polymorphic sets by adding or deleting sequences or changing the default parameters. This is a very useful tool, especially in cases where one polymorphic set erroneously includes different paralogous genes, or one polymorphic set should be split into different analysis units in accordance with the different origins of the source sequences.
Statistics
The Statistics section summarizes the contents of both the primary and secondary databases. It is updated daily, and includes tabular and graphic information. The information is divided for rodents, primates and all other mammals, and between mitochondrial and nuclear data.
The distributions of polymorphic sets in accordance with different parameters, such as species and genes, are shown. The number of analysis units per taxon can be viewed in the ‘Phylogeny of the Mammalia class’ graph. Analysis units are then classified by gene region, the quality of the alignments and the confidence in the data source. Average diversity estimates by gene regions are also given. Finally, certain important statistics on the primary database are displayed, such as the number of sequences, species, genes and references, in different classifications.
At the time of writing, MamPol contained 5021 polymorphic sets corresponding to 1555 different species and 1633 different genes. A total of 15 746 analysis units were analyzed, mostly corresponding to the gene (6855), CDS (5424) and exon (2526) regions.
The statistics on the quality of the alignments show that a high percentage of analysis units have less than six sequences (86%), but most contain few gaps within the alignment (98.8%), and sequences are generally of similar length (80%). Finally, according to the confidence in the data source, only ∼30% of the analysis units come from sequences whose primary focus is the study of polymorphism. Therefore, PDA has gathered the other 70% of the analysis units from sequences that would otherwise be overlooked if searching among polymorphism studies only, and it has therefore provided a notable increase in the amount of diversity data. Overall, these statistics highlight the amount and quality of the data used to estimate polymorphism in the MamPol database.
MamPol IN ACTION
The MamPol database provides estimates of nucleotide diversity for a large number of genes and species of mammals, and the website interface makes it possible to perform totally customizable queries in a single step. This greatly facilitates a wide range of large-scale analyses. For example, multi-locus polymorphic data can be used to detect adaptation on the population level and to discriminate between selection and demographic effects (18,19). On the other hand, multi-species polymorphic data make it possible to describe and compare the patterns of nucleotide diversity in organisms with different biologies, both for nuclear and mitochondrial genes. Both types of analyses may help, for example, to find a covariation between the coding and the non-coding regions of a gene, depending on different factors such as the complexity of expression [(20), Natalia Petit et al., personal communication].
As an example for the use of MamPol, we show a simple study searching for evidence relating nucleotide diversity and the risk of threatened species becoming extinct. It was made using comparative queries on the website interface. Independent evidence from stochastic computer projections has demonstrated that inbreeding depression increases the risk of threatened species becoming extinct in natural habitats when all other threatening processes are included in the models. Therefore, most taxa are not driven to extinction before genetic factors have an adverse effect upon them. Spielman et al. (21) have recently shown that threatened species exhibit lower levels of allozyme heterozygosity in comparison with taxonomically related non-threatened taxa. By using MamPol, we have compared the corresponding levels of nucleotide diversity for these two groups and found that threatened taxa have significantly less genetic diversity than comparable non-threatened taxa (Wilcoxon's signed rank test, one-tailed P = 0.0174, n = 55) (Supplementary Table S1 and Figure S1). Specifically, nucleotide diversity was lower in threatened taxa in 70.9% of all comparisons. These differences in both heterozygosity and nucleotide diversity indicate lower evolutionary potential, higher compromised reproductive fitness and a higher risk of extinction in the wild.
This example illustrates the power of MamPol. The wide range of potential queries that can be performed on nucleotide diversity greatly facilitate comprehensive metaanalyses involving both multi-locus and multi-species polymorphic data.
SUPPLEMENTARY DATA
Supplementary Data are available at NAR Online.
The authors would like to thank Natalia Petit, Elisa Heymann and two anonymous referees for valuable discussions, and David Owen for his critical reading of this manuscript. Computational resources used in this work were kindly provided by the Oliba Project of the Universitat Autonoma de Barcelona. R.E. was supported by the Departament d'Universitats, Recerca i Societat de la Informació de la Generalitat de Catalunya i el Fons Social Europeu (Grant 2005FI 00328). S.C. was supported by the Ministerio de Ciencia y Tecnología (Grant BES-2003-0416). This work was supported by the Ministerio de Educación y Ciencia (Grants BFU2006-08640/BMC and TIN 2004-03388). Funding to pay the Open Access publication charges for this article was provided by the Ministerio de Educación y Ciencia (Grants BFU2006-08640/BMC awarded to Antonio Barbadilla and TIN 2004-03388 awarded to Miquel Ángel Senar).
Conflict of interest statement. None declared.

Comments