


ABSTRACT
Much of our current knowledge about cellular RNA–protein complexes in bacteria is derived from analyses in gram-negative model organisms, with the discovery of RNA-binding proteins (RBPs) generally lagging behind in Gram-positive species. Here, we have applied Grad-seq analysis of native RNA–protein complexes to a major Gram-positive human pathogen, Clostridioides difficile, whose RNA biology remains largely unexplored. Our analysis resolves in-gradient distributions for ∼88% of all annotated transcripts and ∼50% of all proteins, thereby providing a comprehensive resource for the discovery of RNA–protein and protein–protein complexes in C. difficile and related microbes. The sedimentation profiles together with pulldown approaches identify KhpB, previously identified in Streptococcus pneumoniae, as an uncharacterized, pervasive RBP in C. difficile. Global RIP-seq analysis establishes a large suite of mRNA and small RNA targets of KhpB, similar to the scope of the Hfq targetome in C. difficile. The KhpB-bound transcripts include several functionally related mRNAs encoding virulence-associated metabolic pathways and toxin A whose transcript levels are observed to be increased in a khpB deletion strain. Moreover, the production of toxin protein is also increased upon khpB deletion. In summary, this study expands our knowledge of cellular RNA protein interactions in C. difficile and supports the emerging view that KhpB homologues constitute a new class of globally acting RBPs in Gram-positive bacteria.
INTRODUCTION
RNA–protein complexes serve important functions in all cellular processes associated with gene expression, from the regulation of transcription to protein synthesis. Unsurprisingly, there have been long-standing efforts to understand the number and nature of RNA-binding proteins (RBPs) in model systems of molecular biology. Thanks to several recently developed global techniques, nearly saturated RPB catalogues are now available for eukaryotic yeast and human cells (Huang et al. 2018; Queiroz et al. 2019; Shchepachev et al. 2019; Trendel et al. 2019). Ironically, even though bacteria are often considered much simpler organisms, their RBP repertoire seems to be much harder to catalogue (Holmqvist and Vogel 2018). The main reason being that as bacterial transcripts lack functional poly(A) tails, purification is less straightforward and global RBP co-purification after oligo(T)-based capture cannot be transferred from eukaryotes.
While Escherichia coli currently has ∼180 annotated RBPs, many of which have a ribosomal function (Holmqvist and Vogel 2018), far fewer RBPs are known in other bacterial species. These under-researched species broadly include Gram-positive bacteria, including many human pathogens of high medical interest. Important well-characterized RBPs of the Gram-negative model organisms E. coli and Salmonella enterica, such as Hfq, either are absent from Gram-positive bacteria (e.g.S. pneumoniae) or have different functions. For example, the RNA chaperone Hfq globally promotes small RNA (sRNA)-mediated regulation of mRNAs in Gram-negative enteric bacteria, and its deletion usually results in pronounced phenotypes (Chao and Vogel 2010). By contrast, many of the known sRNAs in Gram-positive bacteria seem to be Hfq-independent. In addition, hfq disruption in Listeria monocytogenes (Christiansen et al. 2004), Staphylococcus aureus (Bohn, Rigoulay and Bouloc 2007) or Bacillus subtilis (Rochat et al. 2015) produces no obvious growth defects or influences the intracellular stability of sRNAs (Geissmann et al. 2009; Toledo-Arana et al. 2009; Hammerle et al. 2014). The cellular RNA degradation enzymes and machinery also differ significantly in Gram-positive species (Durand et al. 2015), limiting extrapolation of established knowledge from E. coli or S. enterica. Therefore, systematic searches are needed to understand the general landscape of RNA–protein interactions in Gram-positive species, which includes the human pathogen Clostridioides difficile.
C. difficile is the leading cause of nosocomial diarrhoea following antibiotic treatment. Infections are inherently difficult to treat using conventional antibiotic therapy (Peng et al. 2017; Guery, Galperine and Barbut 2019), mainly due to C. difficile's ability to form resistant spores. This has led to heightened interest in the molecular biology of the species itself with a growing number of mechanistic studies on how C. difficile physiology and virulence are regulated (Paredes-Sabja, Shen and Sorg 2014; Smits et al. 2016; McKee, Harvest and Tamayo 2018). For example, numerous studies addressing the regulation of the clostridial toxins TcdA and TcdB, the central virulence factors of C. difficile responsible for the symptoms of C. difficile infections (CDI; Smits et al. 2016) have revealed a complex network of transcriptional regulators that control toxin expression in response to environmental signals (summarized in Bouillaut et al. (2015)).
Genome-wide profiling studies have provided general transcriptome maps (Scaria et al. 2011, 2013; Antunes et al. 2012; Janoir et al. 2013; Kansau et al. 2016; Jenior et al. 2017; Berges et al. 2018; Giordano, Hastie and Carlson 2018; Neumann-Schaal et al. 2018; Fuchs et al. 2020; Fletcher et al. 2021) and protein inventories (Otto et al. 2016; Neumann-Schaal et al. 2018) under several infection-relevant growth conditions. In contrast, experimental evidence for protein complexes, alone or with RNA, is still scarce in C. difficile (Jackson et al. 2006; Ciftci et al. 2019; Touchette et al. 2019; Unal et al. 2019), and given the bacterium's limited genetic tractability, often based on heterologous protein expression in E. coli or B. subtilis (Aboulnaga et al. 2013; Demmer et al. 2017; Valenčíková et al. 2018).
The limitations of working with C. difficile notwithstanding, this species offers promising leads towards a better understanding of functional ribonucleoprotein particles (RNPs) in bacteria. It is the only Gram-positive species in which the RNA chaperone Hfq significantly impacts gene expression and bacterial physiology, leading to increased sporulation rates upon hfq deletion (Boudry et al.2014; Maikova et al. 2019). Moreover, recent experimental annotation efforts have identified a large number of cis-regulatory RNA elements and sRNAs in this organism (Soutourina et al. 2013; Fuchs et al. 2020). In addition, Hfq exhibits a surprisingly broad RNA-binding activity, interacting with at least 10% of all C. difficile transcripts including dozens of sRNAs (Boudry et al.2021; Fuchs et al. 2020).
Grad-seq is a recently introduced approach to discover RBPs and their complexes in a poly(A)-independent manner (Smirnov et al. 2016). The method is based on the separation of soluble cellular complexes by a classical glycerol gradient, followed by high-throughput RNA-seq and mass spectrometry (MS) analyses of the individual gradient fractions. Potential RBPs are then predicted by a ‘guilt-by-association’ logic, searching for correlation between in-gradient behavior of cellular proteins and transcripts. Originally developed for S. enterica, Grad-seq guided the discovery of a hitherto overlooked global RBP, the FinO-domain containing protein ProQ (Smirnov et al. 2016). A more recent pioneering application of Grad-seq in a Gram-positive bacterium helped to identify a new mechanism of exonucleolytic sRNA activation in competence regulation of Streptococcus pneumonia (Hör et al. 2020b).
In the present study, we applied Grad-seq to systematically identify RNA–protein and protein-protein complexes in C. difficile. Using this new approach, we identify the broadly conserved KhpB homologue Jag (to which we will refer as KhpB), originally identified in S. pneumoniae (Ulrych et al. 2016; Stamsås et al. 2017; Zheng et al. 2017), as a new globally acting sRNA binding RBP in C. difficile. We show that the pervasive activity of KhpB resembles the scope of Hfq activity and includes the regulation of toxin expression. As such, our findings support a view that KhpB homologues constitute a new class of conserved bacterial RBPs with global RNA-binding activity.
RESULTS
Grad-seq analysis captures RNA-protein complexes in C. difficile
To capture the landscape of cellular complexes in C. difficile we applied Grad-seq to a native cell lysate of the 630 wild type (WT) strain grown to late-exponential phase in rich BHI broth. We chose the widely used reference strain 630, because it offers the most comprehensive genome annotation to date. We use the original, most familiar genome annotation (e.g. CD0001) throughout the manuscript but datasets can be searched using all three available gene identifiers (e.g. CD0001, CD630_00010 and CDIF630_00001; see Materials and Methods). Proteins, RNAs and complexes were biochemically separated on a linear glycerol gradient based on their size and shape yielding 20 individual fractions and a pellet (Fig. 1A).

Grad-seq visualizes the RNA/protein complexome of C. difficile. (A) Grad-seq workflow. (B) A260 absorbance profile of gradient fractions. Low-molecular-weight complexes (bulk peak) and ribosomal subunits (30S, 50S) are highlighted. (C) Ethidium bromide stained PAA gel showing gradient distribution of housekeeping RNAs (tmRNA, tRNAs, 5S rRNA, 16S rRNA and 23S rRNA) and RaiA. (D) Coomassie stained SDS gel showing gradient distribution of proteins. Ribosomal subunit proteins (30S and 50S) are highlighted. (E) Heatmaps showing normalized sedimentation profiles of selected housekeeping RNA-protein complexes. Data were obtained by RNA-seq and LC-MS/MS analysis of gradient fractions. Sedimentation profiles of proteins and transcripts are scaled in the range from 0 to 1. Fractions 1–20 and the pellet (P) are shown. *not available in previous genome annotations.
Conventional A260 nm analysis of the resulting gradient fractions showed a bulk peak at low-molecular weight fractions and two peaks for the small and large ribosomal subunits (Fig. 1B) which recapitulated Grad-seq profiles previously obtained for E. coli, Pseudomonas aeruginosa, S. enterica and S. pneumoniae (Gerovac et al. 2020a,b; Hör et al. 2020a,b; Smirnov et al. 2016). Separation of RNA-samples on a conventional ethidium bromide-stained polyacrylamide gel visualized the most abundant cytosolic RNAs that are associated with the 30S (16S rRNA) and 50S (5S/23S rRNAs) ribosomes as well as tRNAs (Fig. 1C). In addition, an abundant transcript likely corresponding to tmRNA is visible, suggesting its presence in a stable complex with its cognate protein partner SmpB. Complementing this picture are protein profiles characteristic of 30S and 50S ribosomal subunits that were obtained by SDS-PAGE analysis of the gradient fractions (Fig. 1D).
We noticed two additional highly abundant RNA species peaking in fractions 3–5, which could not be assigned to any known or predicted housekeeping RNA species (Fig. 1C, orange boxes). We propose that they correspond to RaiA (CDIF630nc_001), an exceptionally abundant sRNA recently identified by RNA-seq based annotation of the C. difficile strain 630 (Fuchs et al. 2020). The level of RaiA in the cell lysate is comparable to that of rRNA species (Table S1, Supporting Information), which would explain its potential detection by ethidium bromide-staining. Northern blot probing of RaiA in the gradient fractions revealed two strong signals at approx. 260 nt and 220 nt that matched the staining pattern in the RNA gel (Fig. 3B). Our RNA-seq based annotation of the raiA gene identified one TSS and two associated termination sites, which would account for the different lengths of the two detected transcripts. RaiA represents the first experimentally validated member of the ncRNA family RaiA (Weinberg et al. 2017) whose members can be found in Firmicutes and Actinobacteria. So far, their potential function(s) remains unknown. That said, our detection of RaiA in a stable RNP complex provides experimental evidence for this abundant ncRNA to be functional.
For a global high-resolution picture of the in-gradient behavior of individual RNAs and proteins, all fractions were analysed with RNA-seq and mass spectrometry (Fig. 1A and Table S1, Supporting Information). This analysis yielded sedimentation profiles for 3541 transcripts and 1867 proteins, corresponding to ∼87% of all cellular transcripts and ∼50% of the annotated proteome of C. difficile. Analysis of the RNA-seq data showed that different transcript classes exhibited distinct sedimentation profiles (Figure S1A, Supporting Information). Whereas mRNAs were abundant in the pellet containing 70S ribosomes as well as in 30S fractions, tRNAs peaked strongly around low-molecular weight (LMW) fraction 3. By contrast, non-coding RNAs (sRNAs, riboswitches, transcriptional attenuators residing in 5′UTRs and type-I antitoxins) showed a very broad gradient distribution indicating their existence in different molecular weight complexes.
Comparison of the sedimentation profiles of well-known RNA–protein complexes showed congruent profiles for the respective RNA and protein components, reflecting the preservation of complexes in the gradient. For example, profiles of SRP, the signal recognition particle formed by 4.5S RNA and protein Ffh, and of various tRNAs and their associated aminoacyl-tRNA synthetases were highly similar (Fig. 1E). Further, proteins of the small and large ribosomal subunits exhibited a strong correlation with their associated 16S and 5S/23S rRNAs, respectively (Fig. 1E).
Evidence for a functional 6S-RNAP complex in C. difficile
First discovered in E. coli (Wassarman and Storz 2000), functional associations of the abundant 6S RNA with RNA polymerase (RNAP) have been reported in multiple species, including the Gram-positive bacteria B. subtilis (Trotochaud and Wassarman 2005; Beckmann, Burenina and Hoch 2011) and S. pneumoniae (Hör et al. 2020b). Here, northern blot probing of 6S RNA in the gradient fractions revealed two different RNA species of approx. 200 nt and 175 nt (Figure S1B, Supporting Information), similar to previous signals in C. difficile (Soutourina et al. 2013), B. subtilis (Trotochaud and Wassarman 2005) and S. pneumoniae (Acebo et al. 2012). Importantly, these 6S RNA species clearly co-migrate with the subunits of C. difficile RNAP in the gradient (Fig. 1E), which strongly indicate that they are present in a stable complex. In addition, functional 6S RNA is known to be used by RNAP as a template, leading to the synthesis of 14–20 nt RNA products (pRNAs; Wassarman 2018). Importantly, our transcriptome mapping of C. difficile detects such pRNAs and shows that they do initiate within the central bulge, as expected (Figure S1C, Supporting Information; arrow; Fuchs et al. 2020). Combined, these data provide evidence for this to be a functional 6S RNA that associates with RNAP in vivo.
To facilitate a straightforward analysis of this complex RNA and protein data, all profiles can be viewed in an online browser, which is available at https://helmholtz-hiri.de/en/datasets/gradseqcd. The browser allows easy access and comparison with previously published Grad-seq datasets for other Gram-positive and Gram-negative species (Gerovac et al. 2020a,b; Hör et al. 2020a,b; Smirnov et al. 2016).
Functional implications of in-gradient protein profiles
Having established proof-of-concept for Grad-seq in C. difficile, we examined our data for potential new RBPs outside of conserved housekeeping RNPs. We focused on small proteins of <20 kDa; these typically fold into a single domain and would sediment in LMW fractions 1–3 (Erickson 2009) unless present in a larger complex, as exemplified by the classic r-proteins of the 30S or 50S subunits (Fig. 1E). In addition, known ribosome-associating proteins, such as InfC (translation initiation factor IF-3) and RbfA (ribosome-binding factor A), which both interact with disassembled 30S subunits, co-sedimented with the free 30S subunit (Fig. 2A). These examples illustrate the potential of Grad-seq to predict cellular interactions for proteins of unknown function.
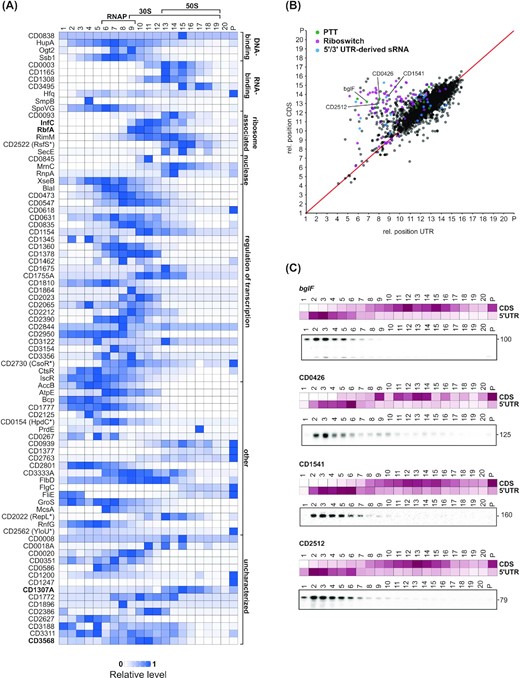
Grad-seq sedimentation profiles facilitate functional predictions for proteins and RNA transcripts. (A) Heatmaps showing normalized sedimentation profiles of small proteins (<20 kDa) with fast sedimentation behavior (main peak > fraction 3). A fast sedimentation of small proteins can indicate that the proteins are part of a larger complex. Predicted protein functions (Uniprot) and the positions of RNA polymerase (RNAP) and ribosomal subunits (50S and 30S) are indicated. Proteins discussed in the main text are indicated in bold letters. (B) Correlation of sedimentation profiles for UTR–CDS pairs reveals 5′/3′-UTRs with divergent sedimentation behavior. The relative position for each UTR was plotted against the relative position of its corresponding CDS. For calculation of relative positions see Materials and Methods. Data points are colored according to UTR association with a riboregulatory element. UTRs that were validated by Northern blot in (C) are labeled. (C) Heatmaps of normalized UTR/CDS sedimentation profiles and northern blot validation of gradient fractions using radioactively labeled DNA probes specific for the 5′-UTR regions of bglF (CDIF630nc_008, PTT), CD0426 (CDIF630nc_010, PTT), CD1541 and CD2512.
To extend on this theme, we observed the 10.1 kDa protein CD3568 (Q181H0) to sediment in ribosome-associated fractions. CD3568 belongs to the broadly conserved Veg domain protein family (PF06257) with members found in both spore-forming Gram-positive bacteria (e.g. Bacillus and Clostridium) as well as non-spore-forming bacteria (e.g. Lactobacillus; Figure S2A, Supporting Information). In B. subtilis (Fukushima et al. 2003; Lei et al. 2013) the Veg protein is expressed from a predicted σA-dependent promoter both during vegetative growth and sporulation, indicating a potential housekeeping function (Fukushima et al. 2003). Here, our Grad-seq profiles show a distinct peak of CD3568 in fractions 10 and 11 (Fig. 2A) containing the free 30S subunit along with many mRNAs which could point to a potential ribosome- or mRNA-associated regulatory function of CD3568 during vegetative growth and sporulation.
Another interesting example is CD1307A (Q18BH1), a 10.4 kDa protein of the COG2740 family which is characterized by a conserved motif GRGA(Y/W) (Figure S2B, Supporting Information). The S. pneumoniae homologue (PDB entry: 1G2R) is structurally dissimilar to any known protein but possesses a positively charged patch that suggests nucleic acid binding (Osipiuk et al. 2001). The B. subtilis homologue YlxR has recently been implicated in post-transcriptional regulation of the fructoselysine utilization operon (Ogura and Kanesaki 2018; Ogura, Sato and Abe 2019; Ogura, Shindo and Kanesaki 2020). Our Grad-seq analysis shows CD1307A to peak sharply in fraction 15 along with the 50S subunit (Fig. 2A), and this ribosome association might be considered additional support for a potential function in post-transcriptional control.
In-gradient RNA profiles reveal potential UTR-derived ncRNAs
Similarly to proteins, sedimentation profiles of transcripts can point at molecular functions. To illustrate this, we focused on the mRNA 5′UTRs and 3′UTRs, many of which harbor cis- and trans-acting regulatory elements with functions independent of their parental mRNAs (Serganov and Nudler 2013; Dar et al. 2016; Adams et al. 2021). Calculating the Spearman's rank correlation of sedimentation profiles for 5′/3′UTRs and their corresponding mRNAs revealed strong correlation for the majority of transcripts, i.e. a UTR and its associated CDS exhibited the same sedimentation profile (Fig. 2B). Interestingly, however, there were numerous UTRs showing a low correlation with their parental mRNA (R < 0.2); these often harbored a conserved riboswitch, a premature transcription termination (PTT) element, or a 5′/3′UTR-derived sRNA (Fig. 2B and Table S2, Supporting Information). A case in point are two recently identified premature termination events in the 5′UTRs of the bglF and CD0426 genes (Fuchs et al. 2020; Fig. 2C). Additional interesting UTR candidates include the 5′UTRs of CD1541 (putative drug/sodium antiporter of the MATE family) and CD2512 (PTS system, maltose-specific IIA component). Northern blotting of gradient fractions detected stable transcripts for all 5′UTRs that formed LMW complexes (Fig. 2C). While most of them likely represent stable products of transcription attenuation or mRNA degradation processes, this suggests that they could have additional functions in trans, independent of the translation of their parental mRNA.
Identification of KhpB as a non-coding RNA-binding protein in C. difficile
Next, we specifically searched for C. difficile non-coding RNAs with an unknown RBP partner. To find similarly behaving ncRNAs in our global RNA-seq data, we performed t-SNE (t-Distributed Stochastic Neighbor Embedding) dimension reduction (van der Maaten and Hinton 2008). Using this analysis, high dimensional datasets can be visualized by giving each datapoint a location within a two- or three-dimensional plot, with similarly behaving datapoints clustering together. This analysis revealed distinct clusters of functionally related housekeeping RNAs, such as the 5S/23S rRNAs, as well as tRNAs (Fig. 3A). As described above, their sedimentation behavior mirrored that of their corresponding RNPs (Fig. 1E). By contrast, sRNAs and PTTs displayed heterogeneous behavior. The normalized sedimentation profiles revealed one cluster of sRNAs/PTTs that peaked strongly in the pellet fraction, which contains not only 70S ribosomes but also Hfq (Fig. 3B). Importantly, all sRNAs/PTTs in this cluster were recently shown to associate with Hfq (Fuchs et al. 2020; Boudry et al.2021), reaffirming the role of Hfq as a general sRNA RBP in C. difficile. A second large sRNA cluster associated partially with the pellet fractions but also with 30S and contained several Hfq-dependent sRNAs. The co-sedimentation of Hfq-dependent sRNAs with 30S ribosomes suggests a classical mode-of-action, i.e. as modulators of mRNA translation initiation through their Hfq-facilitated binding to trans-encoded mRNA targets. A third cluster of sRNAs and PTTs was distinct from the ribosomal fractions (Fig. 3B). In silico profiles were readily confirmed by northern analysis of several selected sRNAs from all three clusters and 5S rRNA (Fig. 3C). In their sum, these results suggested the existence of another sRNA/PTT-binding RBP in C. difficile.
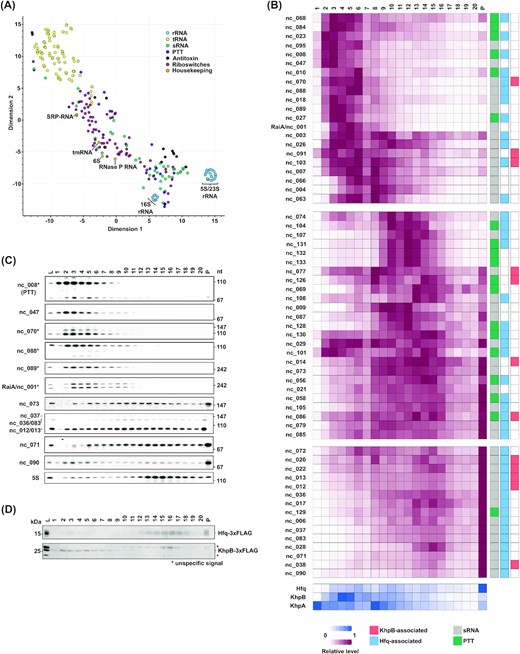
Analysis of ncRNA sedimentation profiles. (A) Scatterplot showing global RNA-seq data of all known ncRNA in C. difficile after dimension reduction with tSNE. ncRNAs with similar gradient sedimentation profiles cluster together, t-SNE perplexity = 40. Housekeeping genes are highlighted. (B) top: Heatmaps showing normalized sedimentation profiles of all predicted sRNAs and PTTs in C. difficile. sRNAs were clustered into three big clusters of similarity with k-means algorithm. Known Hfq-binding sRNAs are marked in light blue and transcripts enriched in KhpB-3×FLAG RIP-seq are marked in light red. Bottom: Heatmaps showing normalized sedimentation profiles of Hfq and the two putative RNA-binding proteins KhpB and KhpA are shown below. (C) Northern blots of gradient fractions. Blots were probed for different sRNAs with radioactively labelled DNA oligos. sRNAs marked with an asterisk were chosen for RNA-bait dependent pulldown. (D) Western blots of gradient fractions of C. difficile 630 Hfq-3×FLAG and C. difficile 630 KhpB-3×FLAG. Western blots were incubated with anti-FLAG antibody.
To identify this candidate RBP, we sought to co-purify proteins from C. difficile lysate with in vitro-transcribed sRNAs (Hör et al. 2020b). As bait RNAs we selected several sRNAs with peaks outside the ribosomal fractions (marked with an asterisk in Fig. 3C). This set included three Hfq-binding sRNAs (whose names are highlighted with blue boxes in Fig. 4A and Figure S3, Supporting Information) and two Hfq-independent sRNAs. Each of these bait sRNAs enriched several proteins (Fig. 4A, B and Figure S3, Supporting Information) and, reassuringly, all three Hfq-binding sRNAs enriched Hfq. While Spearman's correlation analysis showed good agreement (R > 0.8) for several proteins, the most convincing candidate from all pull-downs was the KhpB protein (Fig. 3B).
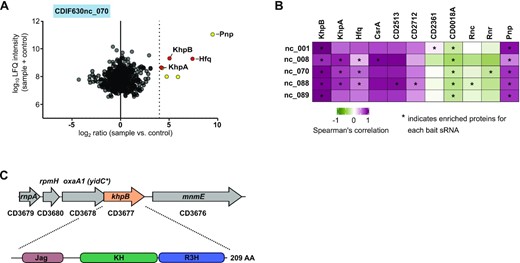
Identification of the RNA-binding protein KhpB. (A) LC-MS/MS analysis of RNA-bait dependent pulldowns with Hfq-dependent sRNA CDIF630_070. The Log10 LFQ intensities of the sample plus control were plotted against the log2 ratio for the sample versus control. Thresholds were set to log10 = 5 for LFQ intensity and to log2 = 4 for the ratio. All proteins significantly enriched are highlighted in yellow or red. RNA-binding proteins Hfq, KhpB and KhpA are highlighted in red. (B) Spearman's correlation coefficient matrix of sedimentation profiles of sRNA baits and proteins that were enriched in the RNA-bait dependent pulldown. Proteins that were specifically enriched with each bait sRNA are marked with an asterisk. (C) Genomic location and domain structure of the RNA-binding protein KhpB.
KhpB contains two RNA binding domains, a well characterized KH-domain and a putative R3H (Grishin 1998; Valverde, Edwards and Regan 2008; Nicastro, Taylor and Ramos 2015), as well as a Jag domain mediating protein-protein interactions (Winther et al. 2021; Fig. 3F). This domain composition together with our pull-down findings strongly suggests that C. difficile KhpB function as an RNA-binding protein. KhpB is broadly conserved having homologues, for example, in S. pneumoniae (a.k.a. EloR/KhpB) and Lactobacillus plantarum (EloR; Figure S4, Supporting Information). In S. pneumoniae it undergoes heterodimerization with another KH-domain containing protein, called KhpA, and binds a variety of transcript classes in vivo (Zheng et al. 2017; Winther et al. 2019). Interestingly, we also identified the C. difficile KhpA homologue CD1254 in our pulldowns (Fig. 4A, B and Figure S3, Supporting Information), but it was not always enriched above threshold (log2 = 4). Similar to KhpB homologues, gene synteny and sequence conservation is very high for KhpA homologues (Figure S5, Supporting Information); therefore, we will refer to this protein as KhpA hereafter. Since KhpA peaked predominantly in fraction 1 and in higher molecular weight (HMW) fractions, we decided to focus our further analysis on KhpB itself.
C. difficile KhpB is a global RBP
To determine potential in vivo target transcripts of KhpB, we took a RIP-seq (RNA immunoprecipitation followed by deep sequencing) approach after genetically tagging the protein with 3×FLAG epitope at the C-terminus as previously published for S. pneumoniae KhpB (Zheng et al. 2017). Western blot analysis showed KhpB-3×FLAG to be abundant throughout different phases of growth (Fig. 5A), and the KhpB-3×FLAG strain showed identical growth to the wild type in three different media (Figure S6A, Supporting Information). Western blot analysis of gradient fractions generated with the KhpB-3×FLAG strain revealed a sedimentation profile comparable to that of the WT protein (compare Fig. 3B and D) and confirmed its co-sedimentation with the bait RNAs. Overall, these data suggested that the recombinant protein behaved like WT KhpB and was suitable for RIP-seq analysis.

RIP-seq identifies KhpB as a global RNA-binding protein. (A) Western blot analysis of KhpB protein levels across different growth phases in BHI medium. Equal OD units of total cell lysates of C. difficile 630 WT and KhpB-3×FLAG were loaded. Western blot membranes were incubated with anti-FLAG antibody. As a loading control, the blotting membrane was stained with Ponceau S. EE-early exponential, ME—mid exponential, LE—late exponential, ST—stationary (B) Distribution of mapped reads across RNA classes in KhpB WT and KhpB-3×FLAG RIP-seq libraries. (C) Pie-chart with distribution of mapped reads in the KhpB-3×FLAG library across ncRNAs classes (sRNA, PTT, riboswitches and antitoxins). Distribution of mapped reads across significantly enriched sRNAs in KhpB-3×FLAG RIP-seq are shown as a stacked bar graph. Read counts are normalized to transcript per million. (D) Western blot (top) and Northern blot (bottom) analysis of KhpB-3xFLAG co-immunoprecipitation (co-IP). Lysates of C. difficile 630 WT (-) and KhpB-3×FLAG (+) grown to late-exponential phase were subjected to immunoprecipitation with anti-FLAG antibodies. Western blot analysis shows lysate, flowthrough, wash and eluates of co-IP. KhpB protein is highlighted. Additional bands in the eluates correspond to the anti-FLAG antibody used for co-IP. Northern blots show total RNA extracted from lysate and eluates of WT (-) and KhpB-3×FLAG (+) co-IPs. Blots were probed for indicated sRNAs with radioactively labelled DNA oligos.
RIP-seq revealed extensive RNA-binding by KhpB-3×FLAG with ∼1400 transcripts being significantly enriched (FC ≥ 5). Of the different transcript classes, CDS were clearly overrepresented, whereas enrichment of rRNAs or tRNAs was not observed (Fig. 5B). The large number of enriched CDS might be partially attributable to the fact that we often observed enrichment for all the genes of long operons, such as the flgB flagellar operon, the atpZ operon or the cooS operon, the latter of which functions in the Wood–Ljungdahl pathway (Figure S7C, Supporting Information).
Enriched transcripts encoded for various physiological functions including the related pathways for flagellar assembly and chemotaxis (Figure S7A and Table S3, Supporting Information). Further, we found several enriched mRNAs of cell division proteins, including ftsZ (Figure S7B, Supporting Information), minE, minC, sepF and ftsK (Table S3, Supporting Information), which was reminiscent of the previously described regulatory role of KhpB homologues in cell division in S. pneumoniae and L. plantarum (Ulrych et al. 2016; Stamsås et al. 2017; Zheng et al. 2017; Myrbråten et al. 2019; Winther et al. 2019). To test this further, we constructed a khpB null mutant (ΔkhpB). To acquire insight into potentially overlapping functions of KhpB and KhpA, we also included a khpA knockout strain. Both mutant strains phenocopied each other during growth, exhibiting a reduced growth rate during exponential phase in comparison to the WT (Figure S8A, Supporting Information). By contrast, cell morphology of the ΔkhpA strain essentially resembled WT, whereas the khpB mutant exhibited slightly increased cell lengths and widths (Figure S8B, Supporting Information).
Among enriched non-coding transcripts, reads mapping to sRNAs (10/42) and riboswitches (9/80) were overrepresented (compared to 4/15 type I antitoxins and 2/19 PTTs; Fig. 5C). Northern blot analysis of KhpB WT and KhpB-3×FLAG coIP fractions independently confirmed binding of KhpB to selected enriched sRNAs from the RIP-seq analysis (Fig. 5D). These included a group of sRNAs with highly similar primary sequence (nc012, nc013, nc036 and nc083). For the nc070 and nc077 sRNAs, we observed significant enrichment of only the larger or small transcript variants, respectively. Further, we confirmed KhpB binding to three of the bait sRNAs used to co-purify KhpB from C. difficile cytosol. Interestingly, these three sRNAs (nc008, nc070 and nc088) had also enriched KhpA in their pulldowns suggesting that KhpB and KhpA cooperate in RNA binding similarly to their homologues in S. pneumoniae (Zheng et al. 2017).
Impact of KhpB on cellular transcripts
Next, we investigated if and how KhpB might influence the fate of those transcripts found to be enriched in the RIP-seq experiment. We used rifampicin to determine RNA stability changes of KhpB-bound sRNAs. Northern blot analysis showed different stabilities between the WT and the khpB deletion strain (Fig. 6A), with KhpB appearing to exert both positive and negative effects on steady-state levels (see CDIF630nc_062 and CDIF630nc_070, respectively). In the case of the CDIF630nc_070 sRNA, we observed decreased stability only for the two larger transcripts of three detectable transcripts. Interestingly, only the larger transcript was enriched in the KhpB-3×FLAG pulldown (Fig. 5D), suggesting the short form of this sRNA represents a KhpB-independent stable degradation product. Together, the data pointed to a role of KhpB as an sRNA stability factor in C. difficile.
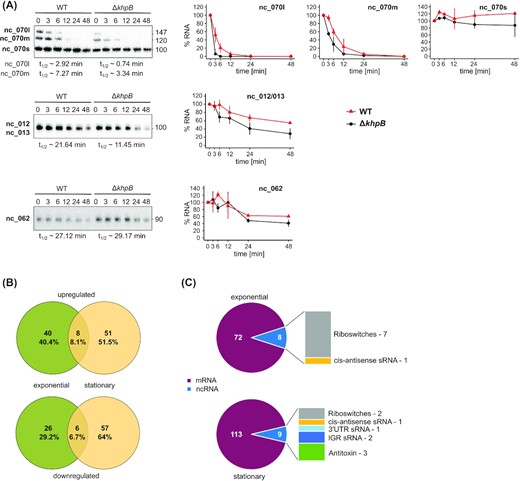
Impact of KhpB on cellular transcript levels and stabilities. (A) Rifampicin assay to determine half-lives of KhpB-bound sRNAs in vivo. Samples from C. difficile 630 WT and ΔkhpB were grown to late exponential phase. Samples were taken at the indicated timepoints after addition of rifampicin. Extracted RNA was analyzed by Northern blotting, a representative of three biological replicates is shown. Error bars show the standard deviation of the mean. Approximate half-lives were calculated with GraphPad Prism and are shown next to each corresponding Northern blot. (B) Venn diagrams for genes differentially expressed in C. difficile ΔkhpB compared to WT. Cultures were grown to late-exponential or stationary phase. Upper diagram shows upregulated genes, lower diagram shows downregulated genes. (C) Fractions of transcript classes that were significantly differentially regulated (up and down) between WT and ΔkhpB.
To obtain a global picture of KhpB-dependent transcript changes, we performed RNA-seq on ΔkhpB, comparing it to the WT strain in the late-exponential and stationary growth phases. Deletion of khpB impacted the steady-state levels of 80 transcripts in late-exponential phase (gradient condition) and 122 transcripts in stationary phase (log2 FC > 1 or log2 FC < −1; Fig. 6B and Table S4, Supporting Information). The large majority of differentially expressed genes were protein coding genes, but many riboswitches, type-I antitoxins and sRNAs were also affected; by contrast, housekeeping rRNAs or tRNAs showed no changes (Fig. 6C and Table S4, Supporting Information). Interestingly, the set of up- and down-regulated genes differed significantly between the two growth phases, suggesting that KhpB regulates distinct physiological pathways during growth.
Pathway enrichment analysis of regulated genes indicated increased transcript levels for metabolic pathways during stationary phase that cooperate in the fixation of atmospheric or glycolysis-derived CO2 into acetyl-CoA (Figure S9, Supporting Information): the Wood–Ljungdahl pathway and the glycine cleavage system (cooS-cooC-fhs-fchA-folD-metV-metF-lpdA, CD0724-acsD-acsC-acsE-cdhC-gcvH and gcvPB; Fonknechten et al. 2010; Kopke, Straub and Durre 2013; Song et al. 2020). In addition, the acetyl-CoA carboxylase (accBCDA) operon whose proteins catalyse the first step in fatty acid biosynthesis from acetyl-CoA showed reduced transcript levels during stationary phase along with the transcriptional repressor of fatty acid biosynthesis fapR. All these individual transcripts or operons, respectively, were also enriched in the RIP-seq dataset suggesting they might be directly regulated by KhpB. Further, the succinate to butyrate pathway (CD2344-cat1-sucD-abfD-CD2340-cat2) that promotes intestinal colonization of C. difficile in a mouse model of C. difficile infection (Ferreyra et al. 2014), was up-regulated during late-exponential growth, in addition to being enriched in the RIP-seq dataset (Figure S9, Supporting Information).
KhpB is a regulator of toxin A
Induction of the identified KhpB-dependent metabolic pathways were known to highly correlate with maximum production of the central virulence factors of C. difficile, the clostridial toxins TcdA and TcdB (Karlsson, Burman and Akerlund 2008). The tcdA mRNA (note that toxin A is annotated as toxA in CP010905.2) was also enriched in the RIP-seq dataset (log2 FC = 2.21; Fig. 7A) although slightly below the set cutoff (log2 FC = 2.5). However, considering that toxin genes are generally repressed during exponential growth in rich medium, it is possible that tcdA transcript levels were just too low for significant enrichment. Toxin synthesis is subject to control by multiple transcriptional regulators of the tcdA and tcdB toxin genes, which act in response to a variety of environmental signals (summarized in (Bouillaut et al. 2015)). By contrast, post-transcriptional mechanisms of these genes were unknown. Therefore, we sought to further explore the role of KhpB in tcdA regulation.
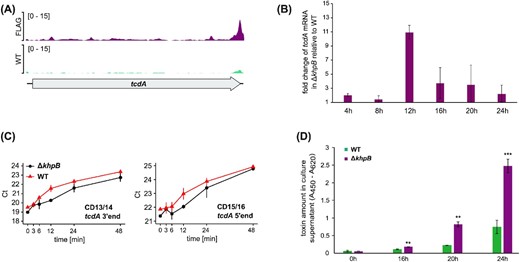
Functional characterization of KhpB identifies a role in toxin regulation. (A) Reads from KhpB WT (turquois) and KhpB-3xFLAG (magenta) RIP-seq libraries mapping to the tcdA region. (B) qPCR-based quantification of tcdA mRNA levels in C. difficile 630 WT and ΔkhpB across different growth phases. Error bars show standard deviation of the mean of three biological replicates. (C) Total RNA was extracted from C. difficile 630 WT and ΔkhpB samples that were taken at the indicated timepoints after inhibition of transcription by the addition of rifampicin in late-exponential growth phase. Transcript levels of tcdA were quantified by qPCR. Error bars show standard deviation of the mean Ct values of three biological replicates. (D) ELISA-based toxin quantification in culture supernatants of WT and ΔkhpB grown in BHI. Samples were taken at the indicated timepoints. Error bars show standard deviation of the mean of three biological replicates. P values were obtained by students t-test. *P < 0.05, **P < 0.01 and ***P < 0.001.
The tcdA mRNA was both enriched in the RIP-seq analysis and increased in the khpB deletion strain (Tables S3 and S4, Supporting Information). Quantification by RT-qPCR confirmed increased tcdA mRNA levels in the absence of KhpB predominantly in the early stationary growth phase (12 h; Fig. 6B). Next, we quantified the tcdA mRNA by qPCR in rifampicin-treated samples of the WT and ΔkhpB strains. Because of the large size of this transcript (∼ 8kb), we performed RT-qPCR with two different primer pairs in either the tcdA 5′ or 3′ region. Differences in Ct values over time confirmed general increases in tcdA levels in ΔkhpB and indicated slight changes in mRNA stabilities (Fig. 7C), although they did not clearly reveal a stabilizing activity of KhpB as observed for KhpB-bound sRNAs (Fig. 6A). Finally, to determine whether KhpB also impacts toxin production on the protein level, we quantified toxin levels by ELISA. In agreement with the RIP-seq, transcriptome and rifampicin data, toxin levels in culture supernatants were increased ∼3.3-fold in the khpB mutant (Fig. 7D). Taken together, these data point to a role of KhpB in toxin regulation, possibly through post-transcriptional regulation of toxin production, adding a new layer of complexity to virulence regulation in C. difficile.
DISCUSSION
The Grad-seq analysis of C. difficile presented in this paper provides the first global map of cellular RNA and protein complexes in this important human pathogen. In complementing published Grad-seq data sets for the three Gram-negative species E. coli, P. aeruginosa and S. enterica, and Gram-positive S. pneumoniae (Smirnov et al. 2016; Gerovac et al. 2020a; Hör et al. 2020a,b), it will be worthwhile to identify both commonalities and differences for orthologous proteins in these phylogenetically distant bacteria. Specifically, gradient sedimentation profiles add confidence to protein function annotations that are commonly achieved by homology-based inference. One such example is the 50S-ribosome associating heat shock protein Hsp15 in E. coli and its orthologues in S. pneumoniae and C. difficile. All of them were found to co-sediment with 50S ribosomes by Grad-seq which strongly suggests a conserved function of Hsp15 orthologues in these distantly related bacteria. In addition, the example of 6S RNA and its consistent co-detection with RNAP highlights that conserved functions of non-coding regulators can be inferred in the absence of existing primary sequence conservation (Figure S1, Supporting Information). Further, similarly to a recent comparative Grad-seq analysis of RNase-sensitive gradient profiles (GradR) in S. enterica (Gerovac et al. 2020a), comparative Grad-seq analysis could also be applied to bacterial cultures subjected to specific stress conditions. We are confident that this type of analysis will not only provide a comprehensive resource for the investigation of RNA-protein complexes in C. difficile but that it will shed light on conserved complexes among Gram-positive and Gram-negative bacteria.
Our study suggests that the widely conserved KhpB homologue in C. difficile acts as a second global RNA-binding protein, in addition to Hfq, and that one of its functions is to regulate toxin production. KhpB is part of an RBP family that is widely conserved among gram-positive bacteria, especially Firmicutes. This family is characterized by their shared domain structure (Fig. 4C) and conserved catalytic residues in 3 domains: the Jag domain and the well-established RNA binding KH and the R3H domains (Figure S4B, Supporting Information; Ulrych et al. 2016; Zheng et al. 2017), in addition to a conserved genomic location adjacent to rnpA and yidC (CD3678; Figure S4A, Supporting Information). Similar to previous observations with KhpB homologues in S. pneumoniae and L. plantarum (Stamsås et al. 2017; Myrbråten et al. 2019; Winther et al. 2019), we also find evidence that these RBPs impact cell division. In other words, KhpB homologues seem to be involved in the regulation of cell division in both ovococcoid and rod-shaped bacteria, which is quite astonishing given the great differences in the underlying cell division mechanisms (Massidda, Nováková and Vollmer 2013; Eswara and Ramamurthi 2017).
Our data reveal binding of KhpB and Hfq to an overlapping set of sRNAs which is reminiscent of the overlapping and competing roles of the global RNA chaperones Hfq and ProQ in E. coli and S. enterica (Holmqvist et al. 2018; Melamed et al. 2020). Currently, we still know too little about either Hfq- or KhpB-mediated regulation in C. difficile to draw precise conclusions on potential similarities or differences in their modes of action. However, both RBPs have the ability to stabilize their bound sRNA ligands. On the other hand, enrichment patterns in the RIP-seq data for Hfq (Fuchs et al. 2020,;Boudry et al.2021) and KhpB point towards some major mechanistic differences. While Hfq enriched for many sRNAs as well as predominantly 5′- and 3′-UTR regions of mRNAs, the vast majority of KhpB-bound transcripts comprises the CDS of mRNAs and even entire operons (Fig. 5B). Thus, unlike Hfq, KhpB might not function primarily in matchmaking of sRNA-target interactions. Also, the conserved regulatory function of KhpB in cell division sets it apart from Hfq. Therefore, at this early stage of our understanding of these two global RBPs it seems that they likely engage in different aspects of C. difficile RNA biology.
Further, the modular domain structure of KhpB with its two RNA-binding domains and the Jag domain that was recently shown to mediate protein–protein interactions in S. pneumoniae (Winther et al. 2021) suggests engagement of KhpB in various protein complexes. For example, proteins containing a single KH domain usually cooperate with other RNA-binding domains or proteins to achieve high-affinity and specific RNA binding (Valverde, Edwards and Regan 2008; Nicastro, Taylor and Ramos 2015). In line with that, streptococcal KhpB forms a heterodimer with another KH domain protein, KhpA, and both proteins bind to an overlapping set of sRNAs and mRNAs in vivo (Zheng et al. 2017). Since S. pneumoniae lacks homologues of the known global RBPs CsrA, Hfq and ProQ, the KhpA/B proteins have been suggested to serve a function analogous to Hfq. Interestingly, both proteins co-sedimented in fractions 2–4 in a Grad-seq analysis of S. pneumoniae (Hör et al. 2020b). Our RNA pulldown results suggest the existence of a potential KhpB/KhpA complex in C. difficile as well, since both proteins were enriched with 3 out of 5 bait RNAs. Their gradient profiles, however, are more complex, with KhpB showing a broader distribution between fractions 2–8, whereas the smaller KhpA protein peaked predominantly in HMW fractions 8–9 in addition to being present in fraction 1, possibly as unbound monomer or as a homodimer. Of course, this does not exclude a possible heterodimer formation between the two proteins, but it does suggest that these two proteins independently engage in additional complexes. Follow-up studies will be necessary to investigate the possibility that certain cellular pathways are regulated by their joint activity, while others might be regulated in a KhpB- or KhpA-specific manner. Our initial characterization of KhpA or KhpB deletion strains already suggests only partially overlapping functions in some cases.
Regarding the scope of RNA-binding and gene regulation by KhpB, our RIP-seq analysis suggests truly pervasive binding as inferred from the enrichment of transcripts from ∼37% of all genomic loci. In stark contrast with that, RNA-seq analysis of the ΔkhpB strain revealed only 188 genes to be differentially expressed in the absence of KhpB. This discrepancy could imply a large number of non-specifically bound targets in our RIP-seq analysis, as seen previously with cold shock domain proteins in S. enterica (Michaux et al. 2017). Alternatively, it could point to a complex situation where KhpB facilitates RNA-binding in the context of different complexes, with differential consequences on the respective target RNAs. In this scenario, KhpB itself might have high but unspecific RNA-binding activity which is changed through its interaction with other protein partners such as KhpA.
Altered steady-state levels were observed with some of the KhpB-bound mRNAs, and some of the KhpB-associated sRNAs exhibited reduced half-lives in the knockout strain. Integrating the RIP-seq and whole-transcriptome RNA-seq data points to several converging metabolic pathways as well as toxin A mRNA as targets of KhpB activity (Figure S9, Supporting Information). These included the Wood–Ljungdahl pathway along with the glycine cleavage system and succinate to butyrate pathway. The co-existence of these pathways is a unique metabolic feature of a limited number of bacteria such as C. sticklandii and C. drakei (Fonknechten et al. 2010; Song et al. 2020). These pathways enable C. difficile to grow autotrophically on CO2 and H2 (Kopke, Straub and Durre 2013), albeit only poorly, and likely provide an advantage during glycolytic growth as produced CO2 can be fixed and re-incorporated into carbon metabolites (Neumann-Schaal, Jahn and Schmidt-Hohagen 2019; Krautkramer, Fan and Bäckhed 2020). The regulation of these pathways along with succinate utilization and toxin production points toward a potential role of KhpB in regulating physiological adaptation to the intestinal environment and virulence. In S. pneumoniae KhpB also seems to be involved in the regulation of virulence. More precisely, a Tn-Seq screen of the TIGR4 strain showed that KhpB is required to cause disease in a murine model of pneumonia (van Opijnen and Camilli 2012). However, in both S. pneumoniae and C. difficile our understanding of the underlying mechanisms is still in its infancy.
We note that the majority of KhpB-bound transcripts showed no changes in steady-state levels, at least with the stringent threshold (log2 FC > 1 or log2 FC < −1) applied. While this does not exclude potential KhpB-dependent effects on the half-lives of those transcripts, it indicates that binding by KhpB might have different consequences, potentially depending on the type of complex that KhpB is involved in. A discrepancy between bound and differentially expressed transcripts could also be explained by indirect effects of KhpB activity, analogous to what was observed for KhpA in S. pneumoniae, where deletion of khpA resulted in cell wall stress that in turn induced expression of the two-component system WalRK (Zheng et al. 2017). At least under the conditions analyzed in our study, the transcriptome profiles of the khpB mutant did not reveal a clear stress signature.
However, we did observe increased expression of the sin locus (CD2214–2215, log2FC ∼ 3) in both growth conditions, which might provide an alternative explanation for the increased toxin production we observed in the khpB mutant. The sin locus encodes the transcriptional regulator SinR and its antagonistic partner SinR’ which blocks SinR activity through protein–protein interaction (Girinathan et al. 2018; Ciftci et al. 2019). However, deletion of the entire sin locus resulted in an asporogenes strain, which also produced less toxin in the hypervirulent isolate R20291 (Girinathan et al. 2018). Various transcriptome studies of regulator mutants including sigH (Saujet et al. 2011), tcdR (Girinathan et al. 2017), codY (Nawrocki et al. 2016), spo0A (Pettit et al. 2014) and fur (Berges et al. 2018), as well as two conserved oligopeptide permeases (Edwards, Nawrocki and McBride 2014), found the sin locus to be regulated, but changes in expression did often not correlate with sporulation phenotypes. The SinRR’ regulon has been determined in C. difficile R20291. Deletion of the sin locus, directly or indirectly, affects the expression of ∼1 000 genes including that of global transcriptional regulator CodY (Girinathan et al. 2018). If the observed increases of sinRR’ expression in our transcriptome analysis had functional consequences, one might expect broader changes in the overall transcriptome profile. Therefore, further experiments, such as a combined deletion of both khpB and the sin locus, are needed to clarify a potential involvement of the sin locus in KhpB-mediated toxin regulation.
Another interesting toxin-related observation from our study is that tcdA and tcdB are not equally regulated by KhpB. First, only tcdA was enriched in the RIP-seq analysis, and second, only tcdA transcript levels were increased in a khpB deletion strain. At least on the transcriptional level, both genes are generally considered to be coordinately regulated, although each is transcribed from its own promoter (Martin-Verstraete, Peltier and Dupuy 2016). Transcript levels of tcdA tend to be higher than those for tcdB (Dupuy and Sonenshein 1998), which might explain why we only observed enrichment of tcdA in the RIP-seq dataset. At this point, we cannot explain the seemingly differential regulation of tcdA and tcdB by KhpB. The data argue against an indirect effect through known global transcriptional regulators, because this would likely affect both toxin genes equally. However, examples for specific transcriptional regulation of tcdA over tcdB exist. For example, the global repressor of the SOS response network, LexA, binds only to the tcdA promoter region containing a LexA binding motif in the hypervirulent isolate R20291 (Walter et al. 2014; Walter et al. 2015). This interaction results in increased toxin A production upon lexA deletion and under specific stress conditions, such as the presence of sub-inhibitory levofloxacin concentrations.
Interestingly, khpB is co-transcribed in an operon along with yidC (CD3678) encoding the membrane protein insertase. Because this gene synteny is conserved, KhpB and YidC might be functionally related. Homologues of YidC play a central role in the insertion and/or folding of membrane proteins in bacterial membranes and eukaryotic organelles (Hennon et al. 2015) by facilitating co-translational insertion of membrane proteins together with the Sec machinery. Therefore, it is tempting to speculate that KhpB might interact with YidC to facilitate membrane targeting of transcripts whose protein products are the substrate of YidC. In such case binding by KhpB would not necessarily impact transcript stability. Indeed, we find several KEGG pathways with membrane-associated functions enriched in our RIP-seq dataset, including the KEGG pathways for flagellar assembly (e.g. flgB—flagellar basal-body rod protein), chemotaxis (e.g. CD0538—putative methyl-accepting chemotaxis receptor) and protein export (e.g.secY—pre-protein translocase, secA1–protein translocase subunit and ftsY—signal recognition particle receptor). Furthermore, we also observed KhpB binding to the yidC transcript itself, as well as to numerous other transcripts encoding (putative) membrane proteins, transporters, two-component sensor histidine kinases and ATPases (Table S3, Supporting Information).
Several open questions remain regarding the mechanisms of gene regulation by KhpB. What is the specific contribution of the KH and R3H domain, respectively, to the RNA-binding activity of KhpB? Whereas, almost nothing is known about R3H domains and their functions (Grishin 1998), there is a growing body of literature on the mechanism of RNA recognition by KH-domains revealing a broad landscape of sequences that can be bound. This is partially achieved by cooperative binding with other KH-domains (reviewed in (Nicastro, Taylor and Ramos 2015)) and is in line with the demonstrated dimerization between KhpB and KhpA, an interaction that is also suggested by our RNA pulldown results and initial functional characterizations of both corresponding deletion strains in C. difficile. However, how much of KhpB's RNA-binding activity relies on its interaction with KhpA remains unanswered. Another question is also whether it interacts with RNA-binding proteins other than KhpA? Finally, the function of the Jag domain is little understood so far, but recent work in S. pneumoniae suggests it acts as a protein–protein interaction domain, enabling incorporation of KhpB into different protein complexes. Specifically, the results suggest that the Jag domain is crucial for KhpB recruitment to the cell membrane by the transglycosylase MltG (Winther et al. 2021). MltG belongs to the YceG-like family (Pfam02618) of proteins which has a member also in C. difficile (CD1226). In addition, they show interaction of the Jag domain with the conserved membrane insertase YidC, which we discussed above, and whose gene is co-transcribed together with khpB in one operon in both S. pneumoniae and C. difficile. However, sequence identities between homologues are low (< 40%) for both proteins and therefore a conservation of these interactions in C. difficile will require careful experimental validation.
In conclusion, our analysis of the KhpB protein in C. difficile substantiates that homologues of the KhpB family are global RBPs that regulate conserved physiological functions in cell wall synthesis of Gram-positive bacteria. In addition, it shows that its individual members have evolved to also regulate species-specific functions such as the regulation of toxin production in C. difficile.
MATERIALS AND METHODS
Bacterial strains and growth conditions
A list of C. difficile and E. coli strains that were used in this study is provided in Table S5 (Supporting Information). The reference strain C. difficile 630 deposited at the German Collection of Microorganisms and Cell Cultures (DSM 27543) was used for all experiments. We chose this strain because it offers the most updated genome annotation (CP010905.2). However, we have used the familiar gene identifiers of the original genome annotation throughout the manuscript (e.g. CD0001) to facilitate accessibility of the data. Whenever a gene ID was not available for the original annotation, we have listed the new ID instead and marked it with an asterisk. Whenever the new annotation had a gene name that was not present in the original annotation, we added the gene name in brackets behind the original gene ID (marked with an asterisk; e.g. CD2522 (RsfS*)).
C. difficile was routinely grown under anaerobic conditions inside a Coy chamber (85% N2, 10% H2 and 5% CO2). Unless indicated otherwise Brain Heart Infusion (BHI) broth or BHI agar plates (1.5% agar) were used for C. difficile culture. If necessary, antibiotics were added at the following concentrations: thiamphenicol 15 μg/mL, cefoxitin 8 µg/mL, cycloserine 250 μg/mL. E. coli was grown in Luria-Bertani (LB) broth (10 g/L tryptone, 5 g/L yeast extract and 10 g/L NaCl) or on LB agar plates (1.5% agar) supplemented with chloramphenicol (20 μg/mL).
Plasmid and strain construction
Plasmids and oligos used in this study are listed in Table S5 (Supporting Information). All PCRs carried out for plasmid construction were done with Phusion High-Fidelity PCR Master Mix with GC Buffer (New England BioLabs, Ipswich, Massachusetts, USA). Plasmid propagation was done in E. coli TOP10 according to standard procedures (Sambrook, Fritsch and Maniatis 1989). In brief, 32 µL of competent cells were mixed with appropriate concentration of plasmid or ligation product and incubated on ice for 30 min. This was followed by a heat-shock for 1 min at 42°C with subsequent incubation on ice for 1 min. Recovery of transformed plasmids was done in LB for 1 h at 37°C before streaking. Plasmid DNA was isolated with Plasmid purification Kit (Macherey-Nagel, Düren, Germany) according to the manufacturer's protocol.
All in vitro transcription sRNA templates were cloned into Strataclone TA-cloning vector according to manufacturer's instructions (Strataclone PCR Cloning Kit, Agilent, Santa Clara, California, USA) using the oligos listed in Table S5 (Supporting Information; RNA-bait dependent pull down).
C. difficile mutant strains FFS-271 (630ΔkhpB), FFS-275 (630ΔkhpA) and FFS-273 (630::khpB-3×FLAG were constructed via homologous recombination as previously published (Cartman et al. 2012). In brief, allelic exchange cassettes were designed with approx. 1.2 kB of homology to the chromosomal sequence flanking the up- and down-stream regions of the knockout/insertion sites. Homology regions were amplified via high fidelity PCR with 5% DMSO and purified from 1% agarose gels with NucleoSpin Gel and PCR Clean-Up Kit (Macherey-Nagel, Düren, Germany). Ligation into PCR-linearized pMTLSC-7315 was done via Gibson Assembly (Gibson Assembly ® Master Mix, New England BioLabs, Ipswich, Massachusetts, USA) according to the manufacturer's instructions. Ligation products were transformed and propagated in E. coli TOP10 as described above. Plasmids were transformed into E. coli CA434. 80 µL of competent cells were mixed with 100–500 ng of plasmids in a pre-chilled electroporation cuvette and transformed by delivering a pulse of electricity (1.8 kV, 200 Ω, 4–5 s). Cells were recovered for 4 h at 37°C in 1 mL LB. Colonies harboring the plasmid were selected on LB with chloramphenicol (20 µg/ml).
For conjugation, C. difficile 630 and the CA434 strain harboring the plasmid were grown to exponential phase. Approx. 3 OD600 units of the CA434 strain was harvested via centrifugation at 4000 g for 2 mins. Supernatant was discarded. In the meantime, 200 µL of C. difficile culture was heat-shocked at 5°C for 5 min and subsequently cooled-down for 2 mins to 37°C. CA434 pellets were resuspended in 200 µL heat-shocked C. difficile culture and spotted on non-selective BHI plates. The plates were incubated at 37°C for 8 h before harvesting with 900 µL BHI broth. 50 µL of a 10−2 and 10−3 dilution was spread on selection plates containing thiamphenicol (15 μg/mL), cefoxitin (8 µg/mL) and cycloserine (250 μg/mL). The plates were incubated for 24–72 h until colonies appeared. When necessary, the colonies were re-streaked several times on selective plates for purity. Colonies were screened for the first recombination via PCR. Recombinants were broadly streaked on non-selective BHI and incubated for 2–3 days. Plates were harvested with 900 µL PBS. 50 µL of a 10−5 and 10−6 dilution of the mixture was streaked on C. difficile defined minimal medium (CDMM) supplemented with 50 μg/mL Fluorocytosine (Cartman and Minton 2010). Colonies were re-streaked to purity and tested for secondary recombination events via PCR. Additionally, strains were tested for plasmid loss on selective plates.
Glycerol gradient fractionation
Glycerol gradient fractionation was performed as recently described (Hör et al.2021). C. difficile was grown in 2 × 100 mL BHI to late-exponential phase. The cultures were cooled down for 15 min in ice-water slurry before harvesting by centrifugation for 20 min at 4°C and 4000 g. Pellets were washed three times with ice-cold, pre-reduced 1 × TBS before resuspension in 500 µL ice-cold 1 × lysis buffer (20 mM Tris-HCl (pH 7.5), 150 mM, KCl, 1 mM DTT, 1 mM PMSF, 0.2% Triton X 100, 20 U/mL DNase I (Thermo Fisher Scientific, Waltham, Massachusetts, USA), 200 U/mL RNase inhibitor). Cell lysis was performed in 2 mL tubes containing Lysing matrix E (MP Biomedicals, Santa Ana, California, USA) by using a FastPrep-24 (MP Biomedicals, Santa Ana, California, USA) machine at 6 m/s for 30 s. The lysate was centrifuged for 30 min at 4°C and 4000 g to remove beads and debris. For input controls 10 µL lysate was mixed with 1 mL TRIzol and 20 µL was mixed with 5× protein loading buffer.
The 10–40% (w/v) glycerol gradient (in lysis buffer without DNase I or RNase inhibitor) was formed in an open-top polyallomer ultracentrifugation tube (Seton Scientific, Petaluma, California, USA) by using a Gradient Station model 153 (Biocomp, Fredericton, Canada). A total of 200 µL of the cleared cell lysate was layered on top of the gradient. The gradient was centrifuged for 17 h at 4°C and 100 000 rcf with an SW 40 Ti rotor (Beckman Coulter, Brea, California, USA). Fractionation was done manually into 20 fractions with a volume of 590 µL. Additionally, the pellet fraction was collected. For quality control, all fractions were analysed with a NanoDrop (Thermo Fisher Scientific, Waltham, Massachusetts, USA) Spectrophotometer at 260 nm. A total of 90 µL of each fraction was mixed with 5x protein loading buffer to perform LC-MS/MS.
A total of 500 µL of the fractions was used for total RNA isolation. A total of 50 µL 10% SDS (25 µL for the pellet) and 600 µL of acidic phenol/chloroform/isoamyl alcohol (P/C/I, Roth, Karlsruhe, Germany, 300 µL for the pellet) was added to the fractions. After mixing for 30 s the mixture was incubated for 5 min at room temperature. Additionally, 400 µL chloroform was added to the TRIzol-dissolved lysate and mixed. The lysate was also incubated for 5 min at room temperature. Samples were centrifuged for 15 min at 4°C and 13 000 rpm. The aqueous phase of all samples was collected. For RNA precipitation 1.4 mL ice-cold 30:1 ethanol: 3M NaOAc (pH 6.5) and 1 µL GlycoBlue (Thermo Fisher Scientific, Waltham, Massachusetts, USA) co-precipitant was added. RNA was precipitated over night at −20°C. RNA was pelleted at 4°C for 30 min and 13 000 rpm and washed with 70% ice-cold ethanol, followed by centrifugation at 4°C for 15 min and 13 000 rpm. The pellet was air-dried and subsequently dissolved in 40 µL DEPC-H2O.
To digest DNA 0.5 µL RNase inhibitor, 5 µL DNase I buffer with MgCl2 (Thermo Fisher Scientific, Waltham, Massachusetts, USA), 4 µL DNase I (Thermo Fisher Scientific, Waltham, Massachusetts, USA) and 0.5 µL DEPC-H2O was added to each RNA sample. Digestion was performed for 45 min at 37°C. RNA was again purified as described above. This time 150 µL DEPC-H2O and 200 µL acidic P/C/I was added to the samples. RNA was finally dissolved in 35 µL DEPC-H2O and stored at −80°C.
Library preparation and RNA-sequencing of Grad-seq samples
A total of 5 µL of extracted RNA from gradient fractions were diluted in 45 µL DEPC-H2O. 10 µL of the diluted RNA was mixed with a 1:100 dilution of ERCC spike-in mix 1 (Thermo Fisher Scientific, Waltham, Massachusetts, USA). Library preparation and sequencing was carried out by Vertis Biotechnology AG, Freising, Germany. In brief, the RNA was fragmented using ultrasound (4 pulses of 30 s each at 4°C) followed by 3′ adapter ligation. First-strand cDNA synthesis was performed using M-MLV reverse transcriptase and the 3′-adapter as primer. After purification of the cDNA the 5′ Illumina TruSeq sequencing adapter was ligated to the 3′ end of the antisense cDNA. Amplification of cDNA (10–20 ng/µL) was done via PCR using high fidelity RNA polymerase and 12 sequencing cycles. cDNA purification was performed with Agencourt AMPure XP kit (Beckman Coulter, Brea, California, USA). The samples were pooled for sequencing. cDNA pool was eluted in the size range of 200–500 bp from a preparative agarose gel. Quality check of RNA was performed in between steps with capillary electrophoresis using a Shimadzu MultiNA microchip (Shimadzu, Kyoto, Japan). The cDNA pool was sequenced on an Illumina NextSeq 500 system (Illumina, San Diego, California, USA) using 75 bp read length.
Grad-seq data analysis
Read trimming and filtering was done with cutadapt (Martin 2011). For read mapping and calculation of read counts the READemption pipeline version 4.3 (Förstner, Vogel and Sharma 2014) was used. Reads were mapped on ERCC spike-ins and CP010905.2 with additional annotations for ncRNAs and UTR regions. Data analysis was performed with the GRADitude pipeline version 0.1.0 (https://github.com/foerstner-lab/GRADitude). Only transcripts with a sum of at least 100 reads in all fractions were used for further analysis. Normalization was done using the ERCC read counts after calculating a robust regression to find and discard outliers within the spike-in data. The normalization method of GRADitude is based on the size factor calculation of DESeq2 (Love, Huber and Anders 2014). Additionally, k-means clustering (Lloyd 2006) and tSNE (T-distributed stochastic neighbor embedding) dimension reduction (van der Maaten and Hinton 2008) using scikit-learn (Pedregosa et al. 2011) was done with all transcripts and a subset that only contained ncRNAs.
To analyse the correlation of the sedimentation behavior of CDS and their associated UTRs, the relative positions of the CDS and the corresponding UTR were calculated. The relative position of a transcript is defined as the centroid of its sedimentation behavior. All normalized read counts of the transcript were multiplied with their corresponding fraction number. This was summed up and divided by the sum of normalized read counts of all fractions. The shift of an UTR relative to its CDS is defined as the relative position of the CDS subtracted by the relative position of the UTR. Additionally, correlation of a CDS and its associated UTR was calculated by Spearman's rank correlation.
LC-MS/MS
Protein samples (90 µL of each fraction mixed with 5 × protein loading buffer) were homogenized with ultrasound (5 cycles, 30 s on, 30 s off, 4°C). Samples were subsequently centrifuged for 15 min at 4°C and 16 100 g. A total of 20 µL of each sample was mixed with 10 µL UPS2 spike-in (Sigma Aldrich, St. Louis, Missouri, USA) diluted in 250 µL 1.25 × protein loading buffer. To reduce proteins 50 mM DTT was added and the samples were incubated for 10 min at 70°C. Subsequently, proteins were alkylated with 120 mM iodoacetamide for 20 min at room temperature. Precipitation was done overnight at −20°C with 4-fold volume of acetone. The pellets were washed four times with acetone at −20°C and dissolved in 50 µL 8 M urea in 100 mM ammonium bicarbonate.
Proteins were digested for 2 h at 30°C with 0.25 µg Lys-C (FUJIFILM Wako, Neuss, Germany), followed by dilution with 150 µL 100 mM ammonium bicarbonate and further digestion overnight with 0.25 µg trypsin at 37°C. Peptides were desalted with C-18 Stage Tips (Rappsilber, Ishihama and Mann 2003). Each tip was prepared with three discs of C-18 Empore SPE Discs (3 M, Thermo Fisher Scientific, Waltham, Massachusetts, USA) in a 200 µL pipet tip. Elution of peptides was performed with 60% acetonitrile in 0.3% formic acid, subsequently followed by drying and storing at −20°C. Peptides were dissolved in 2% acetonitrile/0.1% formic acid.
NanoLC-MS/MS was performed on an Orbitrap Fusion (Thermo Fisher Scientific, Waltham, Massachusetts, USA) with PicoView Ion Source (New Objective, Woburn, Masssachusetts, USA) coupled to an EASY-nLC 1000 (Thermo Fisher Scientific, Waltham, Massachusetts, USA). The peptides were loaded on capillary columns (PicoFrit, 30 cm x 150 µm ID, New Objective, Woburn, Massachusetts, USA) self-packed with ReproSil-Pur 120 C18-AQ, 1.9 µm (Dr. Maisch, Ammerbuch-Entringen, Germany) and separated with a 140-minute linear gradient from 3 to 40% acetonitrile and 0.1% formic acid at a flow rate of 500 nL/min.
MS and MS/MS scans were conducted in the Orbitrap analyzer with a resolution of 60,000 for MS and 15,000 for MS/MS scans. HCD fragmentation with 35% normalized collision energy was applied. A Top Speed data-dependent MS/MS method with a fixed cycle time of 3 s was used. Dynamic exclusion was applied with a repeat count of 1 and an exclusion duration of 60 s whereas singly charged precursors were excluded from selection. The minimum signal threshold for precursor selection was set to 50,000. Predictive AGC was used with a AGC target value of 2e5 for MS and 5e4 for MS/MS scans. EASY-IC was used for internal calibration.
LC-MS/MS data analysis
MS data were analysed with MaxQuant version 1.5.7.4 (Cox and Mann 2008). Database search with Andromeda was performed against Uniprot Clostridium difficile UP000001978 (strain 630) and a database containing the proteins of the UPS2 proteomic standard. A database containing common contaminants was also used. Tryptic cleavage specificity was set to 3 allowed mis-cleavages. Protein identification was under control of a false discovery rate of 1% on protein and peptide level. MaxQuant was set to default setting except of: Protein N-terminal acetylation, Gln to pyro-Glu formation (N-term. Gln) and oxidation (Met). Carbamidomethyl (Cys) was set as fixed modification. For protein quantitation, the LFQ intensities were used (Cox et al. 2014). Proteins with less than two identified razor/unique peptides were dismissed.
RNA gel electrophoresis and northern blotting
RNA samples were separated on a denaturing 6% polyacrylamide gel with 7M Urea in 1 × TBE buffer. The gel was stained with ethidium bromide afterwards. For northern blot analysis unstained gels were transferred onto Hybond+ membranes (GE Healthcare, Chicago, Illinois, USA) at 4°C with 50 V (∼100 W) for 1 h. The blots were probed with 32P-labeled DNA oligonucleotides. Membranes were pre-incubated for 1 h with Roti® Hybri-Quick Buffer (Roth, Karlsruhe, Germany) at 42°C in a hybridization oven. Afterwards, appropriate volumes of labelled oligonucleotides were added and incubation was done overnight at 42°C. Membranes were washed three times with decreasing concentrations of SSC buffer (5 ×, 1 × and 0.5 ×). Imaging was done on a Typhoon FLA 7000 phosphor imager after at least 48 h of exposition to a phosphorimaging screen.
Protein gel electrophoresis and western blotting
Equal volumes of gradient fractions were separated by 12% SDS-PAGE. The gels were stained with Coomassie overnight. Appropriate destaining was performed with H2O.
For western blot analysis unstained gels were transferred to a PVDF membrane for 1 h and 20 min at 4°C and 0.35 mA. The membranes were blocked with skim milk (5% milk powder in 1% TBS-T) for 1 h at room temperature. The membranes were washed three times with 1 × TBS-T for 10 min on a shaker. For detection of FLAG tagged proteins, the membranes were incubated with anti-FLAG antibody (Sigma Aldrich, St. Louis, Missouri, USA) diluted 1:1000 in 1 × TBS-T with 3% BSA at 4°C overnight. After incubation, the membranes were washed again 3 × with TBS-T. Incubation with secondary antibody with anti-mouse-HRP (ThermoScientific) was done for another 1 h at room temperature. Secondary antibody was diluted 1:10 000 in TBS-T with 3% BSA. Before imaging, the membranes were washed 3 × with 1 × TBS-T. 2 mL of ECL substrate (GE Healthcare, Chicago, Illinois, USA) was added to the membrane. Chemiluminescence was measured with a CCD camera (ImageQuant, GE Healthcare, Chicago, Illinois, USA).
For western blot analysis of C. difficile lysate the appropriate volume of culture was harvested via centrifugation for 5 min at 5000 g. The pellet was frozen over night at −20°C. Cells were resuspended in 1 × PBS and incubated for 40 min at 42°C. This leads to consistent cell lysis as previously published (Fagan and Fairweather 2011).
RNA-bait dependent pulldown
RNA-bait dependent pulldown was performed using a modified version of a recently published protocol (Treiber et al. 2017; Treiber, Treiber and Meister 2018). Templates for in vitro transcription of RNA baits were generated with a 5′ overhang including the T7-promoter sequence (bold) and a 14-nt adapter sequence (5′- GTTT TTTTTAATACGACTCACTATAGGGAGACCTAGCCT). Primers used for the generation of the bait RNAs are listed in Table S5 (Supporting Information). PCR templates were generated using Phusion High-Fidelity PCR Master Mix with GC Buffer (New England BioLabs, Ipswich, Massachusetts, USA). Templates were cloned into Strataclone TA-cloning vector according to the manufacturer's protocol (Strataclone PCR Cloning Kit). Resulting vectors were used as template for final high-fidelity PCR to generate templates for in vitro transcription of RNA, which should prevent the production of side products during the in vitro transcription.
In vitro transcription was performed in 40 µL reactions using the Invitrogen MEGAscript T7 Transcription Kit (Thermo Fisher Scientific, Waltham, Massachusetts, USA) according to the manufacturers protocol. The RNA product was purified from a denaturing Urea PAGE with 6% polyacrylamide and 7 M Urea. The gel was stained with Stains-All solution (Sigma Aldrich, St. Louis, Missouri, USA) for 20 min on a shaker. The gel was washed twice with water and destained if necessary. The desired band was cut out and moved into a 2 mL tube. The gel was crushed into small pieces with a pipette tip before adding 750 µL RNA elution buffer (0.1 M NaAc, 0.1% SDS and 10 mM EDTA). The RNA was eluted overnight at 4°C on a shaker. Gel pieces were removed by centrifugation at 5000 g and 4°C for 5 min. A total of 750 µL P/C/I (Roth, Karlsruhe, Germany) was added to the supernatant and centrifuged in phase lock gel tubes (Eppendorf, Hamburg, Germany) at 13 000 rpm and 4°C for 12 min. The aqueous phase was separated and 1 mL EtOH:3MNaAc was added. RNA was precipitated over night at −20°C. Pelleting was performed at 13 000 rpm and 4°C for 40 min. The pellet was washed twice with EtOH (75% and 100%). RNA was dissolved in 50 µL H2O.
The pull-down was performed using Streptavidin Dynabeads (Dynabeads M-270, Thermo Fisher Scientific, Waltham, Massachusetts, USA). A total of 100 µL of Dynabeads were washed 3 times with 500 mL of lysis buffer (50 mM Tris-HCl, pH 8, 150 mM KCl, 5 mM MgCl2 and 10% glycerol) containing 0.01% Tween-20. For coupling of RNA baits to the Dynabeads, a 3′‐biotinylated, 2′‐O‐methyl‐modified RNA adapter complementary to the 14 nt tag of the bait RNAs (AGGCUAGGUCUCCC‐biotin) was used. A total of 4 µg of the adapter was diluted in 500 µL lysis buffer with 0.01% Tween-20. The adapter was added to the dynabeads and coupled for 1 h at 4°C on a rotator. The coupled beads were washed two times and resuspended in 1 mL Lysis buffer with 0.01% Tween-20.
For the pull-down 2 × 400 mL C. difficile 630 culture grown to late exponential phase were harvested. The cultures were cooled down in ice-water slurry for 20 min prior to centrifugation at 4000 g and 4°C for 20 min. Pellets were washed twice with ice-cold TBS. For every pull-down 50 units of OD600 were used. The cells were resuspended in 250 µL lysis buffer with 1 mM DTT and 1 mM PMSF. Cell lysis was performed in 2 mL tubes containing Lysing matrix E (MP Biomedicals, Santa Ana, California, USA, 1.4 mm ceramic spheres, 0.1 mm silica spheres and one 4 mm glass bead) by using a FastPrep-24 (MP Biomedicals, Santa Ana, California, USA) machine at 6 m/s for 30 s. The lysate was centrifuged for 30 min at 4°C and 4000 g to remove beads and debris. The volume of the supernatant was increased to 1 mL with lysis buffer containing 1 mM DTT and 1 mM PMSF.
For coupling of the bait RNAs to the adapter-coupled Dynabeads, 10 µg of each bait RNA was diluted in 500 µL lysis buffer containing 0.01% Tween-20. 200 U/mL of RNase inhibitor was added. To ensure proper folding of the RNAs, they were incubated for 1 h at 37°C. The baits were added to the Dynabeads and coupled for 2 h at 4°C on a rotator. Beads were washed 2 × with lysis buffer containing 0.01% Tween-20.
For the pull-down, the cell lysate was added to the coupled Dynabeads. 200 U/mL of RNAse inhibitor was added. Incubation was done for 2 h at 4°C on a rotator. The beads were washed one time with cold wash buffer 1 (lysis buffer, 1 mM DTT, 1 mM PMSF, 300 mM KCl and 0.01% Tween-20) and two times with cold wash buffer 2 (lysis buffer, 1 mM DTT, 1 mM PMSF and 0.01% Tween-20). The beads were resuspended in 35 µL 1 × LDS sample buffer with 50 mM DTT and boiled at 95°C for 5 min. After short centrifugation, the supernatant was transferred to a 1.5 mL tube.
Sample preparation and LC-MS/MS of pull-down samples
A total of 4.73 µL 1 M iodoacetamide was added to each pull-down sample for alkylation of the proteins. Alkylation was done for 20 min at room temperature. The proteins were separated on a 4–12% Bolt Bis-Tris plus gel (Thermo Fisher Scientific, Waltham, Massachusetts, USA) using MES buffer (Thermo Fisher Scientific, Waltham, Massachusetts, USA). The gel was stained with SimplyBlue Coomassie according to the manufacturers protocol (Thermo Fisher Scientific, Waltham, Massachusetts, USA). Every gel lane was cut into 11 pieces and destained with 30% acetonitrile in 0.1 M NH4HCO3 (pH 8). The pieces were shrunk with 100% acetonitrile and dried in a vacuum concentrator (Concentrator 5301, Eppendorf, Hamburg, Germany). Digestion was done by addition of 0.1 µg trypsin per gel band over night at 37°C in 0.1 M NH4HCO3 (pH 8). The supernatant was removed and the peptides were extracted with 5% formic acid. Extracted peptides were pooled with the supernatant. NanoLC-MS/MS analysis was performed as described above for Grad-seq sample, except that the dynamic exclusion was applied with a repeat count of 1 and an exclusion duration of 30 s.
LC-MS/MS data analysis for pull-down samples
Data analysis of MS for pull-down samples was performed as described above, except that MaxQuant Version 1.6.2.2 was used and the search against UPS2-spike ins was dismissed. Missing LFQ intensities in the control samples were imputed with values close to the baseline. Imputation was performed with values from a standard normal distribution with a mean of 5% quantile of the combined log10-transformed LFQ intensities and a standard deviation of 0.1. To identify enriched proteins, boxplot outliers were identified in intensity bins of at least 300 proteins. Log2 transformed protein ratios of sample versus control with values outside a 1.5 × (significance 1) or 3 × (significance 2) interquartile range (IQR), respectively, were considered as significantly enriched.
RIP-seq
C. difficile WT and FFS-273 (630::khpB-3×FLAG) was grown in 100 mL BHI to late exponential phase. In total, 50 OD were harvested and cooled-down on ice-water slurry. Cultures were centrifuged for 20 min at 4°C and 4000 g. Supernatant was discarded, pellets were snap frozen with liquid nitrogen and stored at −80°C.
Pellets were resuspended in 800 µL lysis buffer (20 mM Tris-HCl (pH 8.0), 1 mM MgCl2, 150 mM KCl, 1 mM DTT) and 1 µL DNase I (Fermentas, Waltham, Massachusetts, USA, 1 U/µL) was added to each sample. Cells were mixed with 800 µL of 0.1 mm glass beads and lysed in a RETSCH's Mixer Mill (30 Hz, 10 min and 4°C, Retsch, Haan, Germany). Lysates were cleared by centrifugation for 10 min at 14 000 g and 4°C. The supernatant was transferred to a new tube and the volume was adjusted to 900 µL with lysis buffer.
A total of 25 µL of anti-FLAG antibody (clone M2, #F1804, Sigma Aldrich, St. Louis, Missouri, USA) was added to each sample before rocking at 4°C for 1 h. In the meantime, 75 µL Protein A Sepharose beads (Sigma Aldrich, St. Louis, Missouri, USA) per sample were washed 3 times with 1 mL lysis buffer. The lysates were added to the beads and rocked for another h. Beads were washed 5 × with 500 µL lysis buffer and finally resuspended in 550 µL lysis buffer. A total of 50 µL of beads were transferred to a fresh tube and mixed with 1 × protein loading buffer for western blot analysis.
A total of 500 µL Phenol:Chloroform:Isoamylalcohol (25:24:1, pH 4.5, Roth, Karlsruhe, Germany) was added to the beads. The solution was mixed for 20 s, transferred to phase lock tubes (Eppendorf, Hamburg, Germany) and incubated at room temperature for 3 min. Tubes were spun for 30 min at 15 000 g and 15°C. The aqueous phase was transferred to a new tube, 3 µL Glycoblue (Thermo Fisher Scientific, Waltham, Massachusetts, USA) and 800 µL isopropanol was added. RNA precipitation was done overnight at −20°C.
Samples were centrifuged for 45 min at 15 200 rpm and 4°C. Supernatant was discarded. RNA was washed 1 × with 80% Ethanol and 1 × with 100% Ethanol (centrifugation for 10 min, 15 200 rpm, 4°C). The pellets were air-dried at room temperature and resuspended in 15.5 µL nuclease free water (65°C, 5 min, 600 rpm).
For DNase I treatment, 2 µL DNase I (Thermo Fisher Scientific, Waltham, Massachusetts, USA), 0.5 µL RNase inhibitor and 2 µL DNase buffer (Thermo Fisher Scientific, Waltham, Massachusetts, USA) was added to each sample. Incubation was done for 30 min at 37°C. To isolate the RNA, 100 µL nuclease free water and 120 µL Phenol:Chloroform:Isoamylalcohol (25:24:1, pH 4.5, Roth, Karlsruhe, Germany) was added to the samples. RNA isolation and precipitation was done as described before. RNA was resuspended in 20 µL nuclease free water.
RNA-sequencing was conducted by Vertis Biotechnology AG, Freising, Germany. In brief, quality of RNA samples was checked on a Shimadzu MultiNA microchip electrophoresis system (Shimadzu, Kyoto, Japan). Fragmentation was done using ultrasound (4 pulses of 30 s each at 4°C). Adapter was ligated to the 3′end. First-strand cDNA synthesis was performed using M-MLV transcriptase and the 3′ adapter as primer. cDNA was purified and 5′ Illumina TruSeq adapter (Illumina, San Diego, California, USA) was ligated to the 3′ end of the antisense strand. Amplification was done via PCR to 10–20 ng/µL using high fidelity protocol and 11 PCR cycles. The cDNA was then purified with Agencourt AMPure XP kit (Beckman Coulter, Brea, California, USA) and analyzed by capillary electrophoresis as stated above. For sequencing, the samples were pooled in equimolar amounts and sequenced on a Illumina NextSeq 500 system (Illumina, San Diego, California, USA), using 75 bp read length.
Raw reads were filtered and trimmed with BBDuk. READemption pipeline version 4.5 (Förstner, Vogel and Sharma 2014) was used for read mapping and calculation of read counts. Reads were mapped on CP010905.2 with additional annotations for ncRNAs, 3′UTRs and 5′UTRs. Normalization and enrichment analysis was done with the edgeR version 3.28.1 (Robinson, McCarthy and Smyth 2010). To calculate normalization factors the trimmed means of M values (TMM) method was used between flag-tagged and control libraries. All features that had more than 50 read counts in at least three libraries were included in the analysis. Calculation of normalization factors for the libraries was only done with housekeeping transcripts (rRNA, tRNA and ribosomal mRNA). Differential expression was tested with the glmTreat method of edgeR. Which tests for differential expression relative to a minimum required fold-change threshold which was set to 5-fold enrichment.
Gene set enrichment analysis was conducted with clusterProfiler (Yu et al. 2012). For GOterm enrichment analysis for CP010905.2 custom database was generated with AnnotationForge (https://github.com/Bioconductor/AnnotationForge) and annotations obtained from QuickGO (Binns et al. 2009).
Total RNA-seq
For total RNA-seq, 20 mL of BHI was inoculated with exponential culture of C. difficile 630 or FFS-271 to a final OD of 0.01. Cultures were grown to late exponential phase and stationary phase. 5 OD per culture were harvested by subsequent addition of 1/5 volume ice-cold stop mix (95% EtOH and 5% phenol). Tubes were immediately frozen with liquid nitrogen and stored at −80°C.
RNA was extracted via hot phenol extraction. The mixture was slowly thawed on ice and centrifuged for 20 min at 4500 g and 4°C. The supernatant was completely discarded. Cells were resuspended in 600 µL lysozyme (10 mg/mL) in TE buffer (pH 8.0) and incubated for 10 min at 37°C. A total of 60 µL w/v SDS was added and mixed by inversion. The samples were heated to 64°C in a water bath for 1–2 min. Subsequently, 66 µL 3 M sodium acetate (pH 5.2) and 750 µL acid phenol (Roti Aqua Phenol, Roth, Karlsruhe, Germany) was added. The mixture was incubated for another 5 min at 64°C. Samples were cooled down on ice before centrifugation for 15 min at 13 000 rpm and 4°C. The aqueous layer was transferred to a phase lock gel tube (Eppendorf, Hamburg, Germany). 750 µL chloroform (Roth, Karlsruhe, Germany) was added before centrifugation for 12 min at 13 000 rpm at room temperature. The aqueous layer was transferred to a new tube and 2 volumes of EtOH:3 M NaOAc (30:1 and pH 5.2) was added. RNA precipitation was done overnight at −20°C. RNA was pelleted by centrifugation for 45 mins, 16 000 rpm at 4°C. Pellet was washed twice with EtOH (80% EtOH and 100% EtOH) and air-dried. RNA was resuspended in 50 µL nuclease free water (65°C, 1000 rpm, 5 min). DNA contaminations were removed via DNase I digestion as described previously above.
RNA-seq was conducted by Vertis Biotechnology AG. Ribosomal RNA was depleted using an in-house protocol of Vertis Biotechnology AG, Freising, Germany. cDNA synthesis and sequencing was done as previously described above in the RIP-seq protocol. Except, fragmentation was done using ultrasound with 1 pulse of 30 s each at 4°C and cDNA amplification was done with 14 PCR cycles.
Total RNA-seq data analysis
Reads were trimmed and filtered with cutadapt (Martin 2011). For read mapping and calculation of read counts the READemption pipeline version 4.5 (Förstner, Vogel and Sharma 2014) was used. Normalization and enrichment analysis was done with the edgeR version 3.28.1 (Robinson, McCarthy and Smyth 2010). To calculate normalization factors the trimmed means of M values (TMM) method was used between knockout and control libraries. All features that had more than 10 read counts in at least two libraries were included in the analysis. All transcripts with a log2FC less than −1 or greater than 1and an FDR of < 0.1 were considered as significant.
Rifampicin assay
For rifampicin stability assay, cultures were grown to late exponential phase. 200 µg/mL of rifampicin was added to the cultures to abrogate transcription. Samples were collected at indicated timepoints, by addition of 1/5 volume stop mix (95% EtOH and 5% phenol) and subsequent freezing with liquid nitrogen. Samples were stored at −80°C. RNA was extracted using hot phenol method as previously described above. RNA was analysed via Northern blot or qPCR. Northern blots of rifampicin assays were analysed with ImageJ (Schneider, Rasband and Eliceiri 2012). Calculation of half-lives was done with GraphPad Prism 9 by applying one phase decay equation.
qPCR
All primers used for qPCR are listed in Table S5 (Supporting Information). Extracted RNA samples were treated with DNAse I as stated above. RNA was checked for remaining DNA contamination with PCR with primers FFO-107/FFO-108 targeting rpoB. cDNA synthesis was done with M-MLV Reverse Transkriptase Kit (Invitrogen, Carlsbad, California, USA) and random hexamer primers according to the manufacturer's protocol. qPCR was carried out with Takyon No Rox SYBR MasterMix dTTP Blue (Eurogentec, Liège, Belgium) according to the manufacturer's protocol on a CFX96 system (Bio-Rad, Hercules, California, USA).
For qPCR-based determination of tcdA mRNA levels in ΔkhpB relative to WT, primers CD33 and CD34 were used. Fold change was calculated with the 2−ΔΔCT method (Livak and Schmittgen 2001). rpoB was used for normalization. mRNA stability was analysed with different set of primers (see Table S5, Supporting Information).
Toxin ELISA
For toxin ELISA, cultures were grown over the course of 24 h and 1 mL of the culture was collected at the indicated timepoints. Cells were pelleted for 5 min at 5000 g and 4°C. Supernatant was collected in a fresh tube and sterile filtered (0.2 µM filter membrane). ELISA was done with the TGC-E001–1 ELISA kit for simultaneous detection of toxin A and B (tgcBIOMICS, Bingen, Germany). The ELISA was performed as described in the manufacturer's protocol. For sample preparation, 50 µL of the filtered supernatant was diluted with 450 µL of 10 × dilution buffer and centrifuged for 5 min at 2500 g. Optical density was measured at 450 nm and 620 nm on a Tecan Infinite 200 Pro plate reader. For the final readout, OD650 values were subtracted from OD450 values.
RNA secondary structure prediction and sequence alignments
Secondary structures of RNAs were predicted with the RNAfold algorithm (version 2.4) of the ViennaRNA Package (Lorenz et al. 2011). Structures were depicted with VARNA (version 3.9) (Darty, Denise and Ponty 2009).
Multiple sequence alignments were calculated with Clustal Omega (version 1.2.4) and depicted with JalView. (version 2.11; Waterhouse et al. 2009; Sievers et al. 2011).
Microscopy
For microscopic analysis, cultures were grown to late exponential phase and 1 mL of bacterial cells were harvested, washed with 1 mL sterile PBS and finally suspended in 100 µL sterile PBS. For microscopy 1–2 µL of the suspension was applied to an agarose pad on a glass slide and topped with a cover slip as described previously (Ransom et al. 2016). Images were taken with a LEICA TCS SP5 II confocal microscope (Leica Microsystems, Wetzlar, Germany)under DIC conditions using a HCX PL APO CS 100.0 × 1.44 OIL UV lens. Images were exported as 8-bit tif files and size was assessed using ImageJ with the additional MicrobeJ plugin 2.3 (Ducret, Quardokus and Brun 2016). Visibly separated cells not recognized as individual by microbeJ were excluded from evaluation.
DATA AVAILABILITY
All RNA-sequencing data are available at the NCBI GEO database (http://www.ncbi.nlm.nih.gov/geo) under the accession number GSE165672. The mass spectrometry proteomics data have been deposited to the ProteomeXchange Consortium via the PRIDE (Perez-Riverol et al. 2019) partner repository with the dataset identifiers PXD022525 (Grad-seq Clostridium difficile 630) and PXD022544 (RNA-bait dependent pulldown in Clostridium difficile). In addition, the RNA and protein gradient sedimentation profiles can be viewed through an open access online browser under https://helmholtz-hiri.de/en/datasets/gradseqcd.
AUTHOR CONTRIBUTION
VL-S, PD, JV and FF conceived and designed the study. VL-S, JS, MF and JH performed experiments, and MG setup the web browser. VL-S performed all data analysis. FF supervised the project. VL-S and FF wrote the manuscript with input from all authors.
ACKNOWLEDGEMENTS
We thank Andreas Schlosser and Stephanie Lamer from the Rudolf-Virchow-Center, University Würzburg, for mass spectrometry analysis. We thank Lars Barquist for critical reading and for helpful comments on the manuscript. We also thank the Helmholtz Institute for RNA-based Infection Research (HIRI) who supported this work with a seed grant through funds from the Bavarian Ministry of Economic Affairs and Media, Energy and Technology.
Conflict of interest
We declare no competing interests.
REFERENCES
