


Leptin acts in the hippocampus to enhance cognition and reduce depression and anxiety. Cognitive and emotional disorders are associated with abnormal hippocampal dendritic spine formation and synaptogenesis. Although leptin has been shown to induce synaptogenesis in the hypothalamus, its effects on hippocampal synaptogenesis and the mechanism(s) involved are not well understood. Here we show that leptin receptors (LepRs) are critical for hippocampal dendritic spine formation in vivo because db/db mice lacking the long form of the leptin receptor (LepRb) have reduced spine density on CA1 and CA3 neurons. Leptin promotes the formation of mature spines and functional glutamate synapses on hippocampal pyramidal neurons in both dissociated and slice cultures. These effects are blocked by short hairpin RNAs specifically targeting the LepRb and are absent in cultures from db/db mice. Activation of the LepR leads to cAMP response element–binding protein (CREB) phosphorylation and initiation of CREB-dependent transcription via the MAPK kinase/Erk pathway. Furthermore, both Mek/Erk and CREB activation are required for leptin-induced synaptogenesis. Leptin also increases expression of microRNA-132 (miR132), a well-known CREB target, which is also required for leptin-induced synaptogenesis. Last, leptin suppresses the expression of p250GAP, a miR132 target, and this suppression is obligatory for leptin's effects as is the downstream target of p250GAP, Rac1. LepRs appear to be critical in vivo as db/db mice have lowered hippocampal miR132 levels and elevated p250GAP expression. In conclusion, we identify a novel signaling pathway by which leptin increases synaptogenesis through inducing CREB transcription and increasing microRNA-mediated suppression of p250GAP activity, thus removing a known inhibitor of Rac1-stimulated synaptogenesis.
Leptin, a 16-kDa type I cytokine, is a key hormonal regulator of energy homeostasis (1, 2). However, although leptin decreases food intake in nonobese adults, it does not affect food intake in neonates (2, 3). Leptin levels surge during the period of rapid neuronal growth within the central nervous system postnatal day (P) 7–P14 (4, 5). Lack of leptin signaling during this critical period inhibits the formation of feeding circuits within the hypothalamus, a phenotype partially rescued by the administration of exogenous leptin (6). Taken together, these findings support a role for leptin as a neurotrophic factor during this early developmental phase.
Leptin receptors (LepRs) are expressed in the CA1, CA3, and dentate gyrus regions of the hippocampus (7–12). Direct leptin injection into the hippocampus enhances cognition, has antidepressant effects, and modulates food-related memories in rodents (13–15). In contrast, disruption of LepR signaling in the hippocampus impairs cognition and increases behaviors associated with anxiety (9). Furthermore, db/db mice expressing a truncated form of the long form the leptin receptor (LepRb) have altered anxiety and depression-like behaviors (16) and display cognitive impairments (17). Leptin also has acute effects on hippocampal function including modulating long-term potentiation and depression and stimulating changes in glutamate receptor trafficking (17–22). Taken together, these findings support a role for leptin as a critical regulator of hippocampal function; however, the signaling mechanism(s) by which leptin mediates such neurotrophic effects are largely unknown.
Dendritic spines are actin-rich protrusions on the dendritic shaft that are the primary sites of excitatory synaptic inputs on pyramidal neurons (23). Hippocampal spine numbers correlate with changes in both cognition and mood (24–26), suggesting that alterations in spine number or morphology could be a potential mechanism by which leptin modulates hippocampal functions. Consistent with this hypothesis, disrupted leptin signaling decreases dendritic spine density within the dentate gyrus of hippocampus in vivo (27), although its effects on CA1 and CA3 neurons are not known. Leptin has also been shown to increase dendritic filopodia (immature spines) formation in hippocampal neurons in vitro (28); but the functionality of these connections has not been established. Here, we show that leptin stimulates the formation of stable dendritic spines and functional synapses in the hippocampus and describe a novel pathway, involving cAMP response element–binding protein (CREB)-dependent transcription of microRNA-132 (miR132), which suppresses p250 GTPase activating protein (p250GAP) expression and eventually synapse formation.
Materials and Methods
Animals
B6.BKS(D)-Leprdb/J and BKS.Cg-Dock7m+/+Leprdb/J heterozygous db/db mice breeding pairs were ordered from The Jackson Laboratory. Both rats and mice were housed with a 12-hour light/dark cycle at ambient temperature. Chow and water were provided ad libitum. All animal procedures were conducted with the approval of the institutional animal care and use committee. Mice were genotyped using an endpoint allelic discrimination protocol available on The Jackson Laboratory website. Pups expressing 2 copies of the truncated form of the LepR obtained from breeding the heterozygous db/db pairs were used as db/db in all designated experiments. Mice carrying both wild-type copies of the LepR obtained from the same breeding pairs were used as wild-type controls.
Cell filling
P28 to P30 mice were used for the cell-filling experiments. The protocol followed was described in Karatsoreos et al (29). Slices were mounted and imaged using SlideBook 5.0 digital microscopy software driving an inverted Olympus IX81-DSU microscope (Olympus Optical) with a ×60 oil immersion lens, numerical aperture 1.42. A minimum of 5 neurons were counted per brain region (CA1 and CA3) for each animal. Primary dendrites were analyzed for each neuron for spine measurements. Animal-based statistics were performed with 6 wild-type and 4 mutant mice obtained from 4 separate litters per group. Data were analyzed using two-tailed unpaired t tests and exact P values are reported in the Results.
Drugs and DNA constructs
A physiologically active synthetic leptin peptide fragment (116–130) was bought from Tocris Bioscience and used at a 50 nM concentration. UO126 was bought from Calbiochem and used at a 20 μM concentration. Short hairpin (sh) LepR (3299), AGCTCACTGTCTGTTCAGTGAC, and shLepR (3426), TCCACTCACAGTCATAAGATAA, were cloned into the pSUPER backbone using the pSUPER RNAi system from Oligoengine Inc. Monomeric red fluorescent protein (mRFP)-β-actin, ACREB, shCREB, 2′O-methyl (OM)-miR132, mutant (MT) p250GAP, and shRac1 were described previously (30). LepR-6myc used to validate the efficacy of shLepRs was cloned into a pCAGGS-6myc destination vector from rat cDNA using the Gateway cloning system (Invitrogen). Mouse wild-type and Leu985-LepR (L985-LepR) constructs were provided by Dr Martin Myers (31). These mouse LepR constructs were cloned into a pCAGGS-Clover destination vector using the Gateway cloning system, which fused Clover to the C terminus of LepR constructs.
Hippocampal slice culture preparation, transfection, and treatment
Organotypic hippocampal slices from P5 Sprague-Dawley rats, C57/BL mice, or C57/BL db/db mice were cultured for 3 days as described previously (32). To visualize dendritic arbors, slices were transfected with pCAGGS-tdTomato (tomato fluorescent protein–expressing construct) using a Helios Gene Gun (Bio-Rad Laboratories), according to the manufacturer's protocol. After transfection, slices were allowed to recover for 24 hours before stimulation with 50 nM leptin for 2 days. Slices were fixed, mounted, and imaged using an inverted Olympus IX81-DSU microscope as described below. Dendritic spine and filopodia density was measured as described below.
Hippocampal cell culture preparation, transfection, and treatment
To minimize the effects of synaptic activity on synaptogenesis and to isolate leptin's effects, hippocampal cultures were modified from our earlier studies by decreasing the neuronal density. Hippocampal neurons (3 × 10⁴ cells/cm2) were cultured from P1 Sprague-Dawley rats on plates coated with poly-l-lysine from Sigma-Aldrich (molecular weight, 300 000). Hippocampal neurons were maintained in growth medium composed of Neurobasal A medium from Invitrogen supplemented with B27, 0.5 mM l-glutamine, and 5 mM cytosine-d-arabinofuranoside (Sigma-Aldrich) added at 2 days in vitro. Neurons were transfected with pCAGGS-mRFP-β-actin (used at 5% of total plasmid) along with various other DNA constructs, shRNAs, and 2′-OM-antagomers on day in vitro (DIV) 6 using Lipofectamine 2000 (Invitrogen). Neurons were transfected only for 35 minutes with experimental plasmid. Native medium in wells was collected before transfection and replaced with 500 μL of warm growth medium. Experimental plasmids (total DNA concentration of 1 μg/well) and the Lipofectamine 2000 mixture was added to each well for 35 minutes. After this 35-minute incubation, the plasmid-containing medium was aspirated and replaced with 500 μL of warm native media. This protocol yielded the desired 3% to 5% transfection efficiency, thus enabling the visualization of individual neurons. Higher efficiencies can obscure the dendritic arbor of individual neurons. Expression of fluorescently tagged actin allowed clear visualization of transfected neurons and their dendritic spines, because dendritic spines are enriched in actin.
On DIV7, cells were treated with 50 nM leptin added to medium, whereas control cells were treated with medium alone. For the UO126 pretreatment, cultures were incubated with 20 μM UO126 (Calbiochem) added to the medium for 30 minutes before leptin stimulation. On DIV12, the neurons were fixed (4% paraformaldehyde in PHEMS buffer [60 mM PIPES, 25 mM HEPES, 1 mM MgC12, 5 mM EGTA], 87.6 mM Sucrose, pH 7.4] for 20 minutes at room temperature and mounted on glass slides using Elvanol. Slides were dried overnight at 4°C, and fluorescent images were obtained with SlideBook 5.0 digital microscopy software driving an inverted Olympus IX81-DSU microscope with a ×60 oil immersion lens, numerical aperture 1.42, and a pixel dimension of 0.108 μm.
Spine quantification
Dendritic spine and filopodia density was measured on primary and secondary dendrites at a distance of at least 100 μm from the soma. Two to 5 dendrites, each at least 50 μm in length, from at least 25 neurons were analyzed for each data point reported. Each experiment was repeated at least 3 times using independent culture preparations. Dendrite length was determined using ImageJ 1.41o (National Institutes of Health) and the neurite tracing program NeuronJ (33). Spines and filopodia were manually counted.
Filopodia were identified as short dendritic protrusions (≤3 μm) with a long thin neck and without an obvious head. Spines were identified as small protrusions (≤3 μm) with an actin-enriched spherical head connected to a dendrite via a thin neck. The head diameter is at least twice the diameter of the neck. Spines were further characterized as either stubby or mushroom-type, depending on the neck length. Stubby spines have a short or nonexistent neck, whereas mushroom spines have a more discrete neck.
Immunocytochemistry
Transfected neurons were treated and fixed as described above. After fixation, cells were rinsed in PBS and permeabilized with 0.1% Triton X-100 detergent (Bio-Rad Laboratories), followed by 2 rinses in PBS, and blocked with 0.5% fish gelatin in PBS for 2 hours. Cells were rinsed with PBS again, followed by a 24-hour incubation period with anti-vesicular glutamate transporter (VGLUT) 1 (Synaptic Systems), anti-synapsin (Synaptic Systems), anti-phospho (p) CREB (Chemicon), or pErk (Cell Signaling), following the manufacturer's protocol, at 4°C. Then, cells were rinsed twice with PBS, incubated in the appropriate Alexa Fluor secondary IgG antibody (Invitrogen), following the manufacturer's protocol, for 2 hours at room temperature, rinsed again with PBS, and mounted with Elvanol. Imaging for presynaptic markers was performed as described earlier in the Spine quantification section because spine measurements and presynaptic puncta juxtaposition were performed on the same cultures. Each spine on a dendritic length being analyzed was also analyzed for presynaptic puncta juxtaposition. Imaging for pCREB and pErk staining was performed using SlideBook 5.0 digital microscopy software driving an inverted Olympus IX81-DSU microscope with a ×20 lens, numerical aperture 0.5, and a pixel dimension of 0.33 μm. With use of the ImageJ software, pCREB staining intensity was measured in the nucleus and pErk staining was measured in the whole soma of transfected neurons.
Western blotting
Protein samples were collected posttreatment by lysing the cells with radioimmunoprecipitation assay (RIPA) buffer (Sigma-Aldrich) augmented with phosphatase inhibitor cocktail 2 and 3 (Sigma-Aldrich), followed by centrifugation at 14 000 rpm for 15 minutes to collect the protein-enriched supernatant. The supernatant collected was mixed with SDS loading buffer (Invitrogen) and dithiothreitol, boiled for 5 minutes, and loaded on SDS-PAGE (Invitrogen). Western blotting was done using the following antibodies at the given dilution: anti-pCREB (1:1000; Chemicon), anti-phospho-signal transducer and activator of transcription (STAT) 3 (1:1000; Abcam), anti-p250GAP (1:1000; gift from Dr. Nakazawa), and anti-Erk2 (1:2000; Santa Cruz Biotechnology). Blots were imaged using an Odyssey infrared detection system and analyzed using the ImageJ gel analyzer tool.
Real-time quantitative RT-PCR (qRT-PCR)
RNA samples were collected posttreatment by lysing the cells with TRIzol (Invitrogen) using the manufacturer's protocol. For pre-miR132 detection, isolated RNA was reverse transcribed with Superscript II reverse transcriptase (Invitrogen) using random primers and used for qRT-PCR. RT-PCRs (25 μL) contained 12.5 μL of Platinum qPCR SuperMix (Invitrogen), 0.125 mM primer (Integrated DNA Technologies, Inc), 50× SYBR Green (Invitrogen), and 1000× fluorescein. All qRT-PCRs were run on the Bio-Rad iCycler for 1 cycle at 50°C for 2 minutes and 95°C for 2 minutes, and 30 to 50 cycles at 95°C for 10 seconds and 68°C for 45 seconds. All standard curves had R2 of ≥0.99, were composed of a minimum of 4 points, and were linear for at least 3 orders of magnitude. To avoid plateau effects, the cycle threshold (Ct) was always positioned in the logarithmic component of the sigmoid fluorescence curve. The Ct was selected solely on the basis of the maximal linearity of the standard curve. RT-PCR data were normalized to peptidylprolyl isomerase A (PPIA) cDNA levels were also detected by real-time PCR (other housekeeping genes showed similar results). The following primers were used: RT miR132-precursor-1, CTCCGGTTCCCACAGTAACAA; RT miR132-precursor-2, CCGCGTCTCCAGGGCAAC; RT PPIA-1, TTTGGGAAGGTGAAAGAAGG; and RT PPIA-2, ACAGAAGGAATGGTTTGATGG.
For mature miR132 detection, isolated RNA was reverse transcribed for miR132 and U6 small nuclear (sn) RNA using a TaqMan RT MicroRNA kit (Applied Biosystems). A TaqMan assay was also used to detect mature miR132 and U6 snRNA levels in the samples. P42 mice were used for mature miR132 detection.
Whole-cell recordings
Patch-clamp experiments were performed on mRFP-β-actin–transfected cultured hippocampal neurons with PBS (vehicle control) or 50 nM leptin pretreatment. Recordings were made on DIV12 to DIV13. The culture medium was exchanged for an extracellular solution containing 140 mM NaCl, 2.5 mM KCl, 1 mM MgCl2, 3 mM CaCl2, 25 mM glucose, and 5 mM HEPES; pH was adjusted to 7.3 with KOH, and osmolality was adjusted to ∼306 to 310 mOsM. Cultures were allowed to equilibrate in a recording chamber mounted on an inverted microscope (IX-71; Olympus Optical) for 30 minutes before recording. Transfected cells were visualized with fluorescence. Recording pipettes were pulled (P-97 Flaming/Brown micropipette puller; Sutter Instrument Company) from standard-wall borosilicate glass without filament (outside diameter of 1.5 mm; Sutter Instrument Company). The pipette-to-bath direct current resistance of patch electrodes ranged from 4.0 to 5.2 MΩ, and they were filled with an internal solution of the following composition: 25 mM CsCl, 100 mM CsCH3O3S, 10 mM phosphocreatine, 0.4 mM EGTA, 10 mM HEPES, 2 mM MgCl2, 0.4 mM Mg-ATP, and 0.04 mM Na-GTP; pH was adjusted to 7.2 with CsOH, and osmolality was adjusted to 296 to 300 mOsM. Miniature excitatory postsynaptic currents (mEPSCs) were isolated pharmacologically by blocking γ-aminobutyric acid receptor chloride channels with picrotoxin (100 μM; Sigma-Aldrich), blocking glycine receptors with strychnine (1 μM; Sigma-Aldrich), and blocking action potential generation with tetrodotoxin (500 nM; Tocris Bioscience). Recordings were obtained using a Multiclamp 700B amplifier (Molecular Devices). Analog signals were low-pass Bessel-filtered at 2 kHz, digitized at 10 kHz through a Digidata 1440A interface (Molecular Devices), and stored in a computer using Clampex 10.2 software (Molecular Devices). The membrane potential was held at −70 mV at room temperature (25°C) during a period of 0.5 to 2 hours after removal of the culture from the incubator. Liquid junction potentials were not corrected. Data analysis was performed using Clampfit 10.2 software (Molecular Devices) and Mini-Analysis 6.0 software (Synaptosoft). The criteria for a successful recording included an electrical resistance of the seal between the outside surface of the recording pipette and the attached cell of >2 GΩ and neuron input resistance of >200 MΩ. The mEPSCs had a 5-minute recording time.
cAMP response element (CRE)-luciferase Assay
Luciferase activity was measured using a luciferase assay kit (E1500; Promega) and a Victor X luminometer (PerkinElmer). Data were collected from 3 biological replicates per condition.
Statistical analyses
One-way ANOVA was used to analyze the dendritic spine results, and significant effects were analyzed by a Tukey post hoc test. For data obtained from hippocampal slice cultures prepared from db/db mice, animal-based statistics were used with 8 wild-type and 6 db/db mice obtained from at least 4 separate litters per group. Sample sizes for each reported condition in the spine measurement experiments for the rest of the hippocampal cultures were at least 30 dendrites (slice cultures) and 42 dendrites (dissociated cultures) from at least 25 neurons collected from at least 3 independent experiments. The sample size for each reported condition in the electrophysiology experiments was at least 25 neurons from at least 3 independent cultures except for the ACREB experiment, which was repeated twice. Multiple comparisons of electrophysiological results were made using a one-way ANOVA followed by a Newman-Keuls post hoc test with a level of significance set at P < .05. Western blots and qRT-PCR were analyzed using two-tailed, unpaired Student t tests with a level of significance set at P < .05. The sample size for each reported condition from the hippocampal cultures analyzed using Western blots was 3 biological replicates collected from 3 to 4 independent experiments. The sample size for each reported condition from the hippocampal cultures analyzed using qRT-PCT was 6 biological replicates collected from 2 independent experiments run in 3 technical replicates during the PCR. The sample size for the RT-PCR done to compare mature miR132 levels between wild-type and db/db mice was 6 wild-type and 4 db/db mice obtained from 2 litters per group, and data were analyzed using animal-based statistics. The sample size for the p250GAP Western blots with db/db mice was 4 animals per genotype, and data were analyzed using animal-based statistics. Numerical data are expressed as means ± SEM.
Results
LepR signaling is required for normal hippocampal spine formation in vivo
Both CA1 and CA3 pyramidal neurons show significant alterations in their morphological architecture under conditions that affect cognition and emotional behaviors. Importantly, CA1 and CA3 pyramidal neurons express LepRs, suggesting that these cells could be a site of action for leptin and potentially mediate its effects on hippocampal function (23, 34, 35). Using the db/db mouse model that expresses a truncated form of LepRb (36), we examined whether LepR signaling is required for spine formation in vivo. We used a cell-filling approach that allows visualization of distinct dendritic spines in hippocampal pyramidal neurons in coronal brain sections taken from P28 to P30 mice (29, 37). This age was chosen because it is a period after the leptin surge, allowing endogenous leptin to have its effects in normally developing wild-type mice. We observed significantly lower spine density in both CA1 and CA3 pyramidal neurons in db/db mice than in their wild-type brethren (P = .0018 for wild-type vs db/db CA1 spines and P = .02 for wild-type vs db/db CA3 spines) (Figure 1, A and B). These results are similar to those in previous reports for dentate gyrus granule neurons (27).
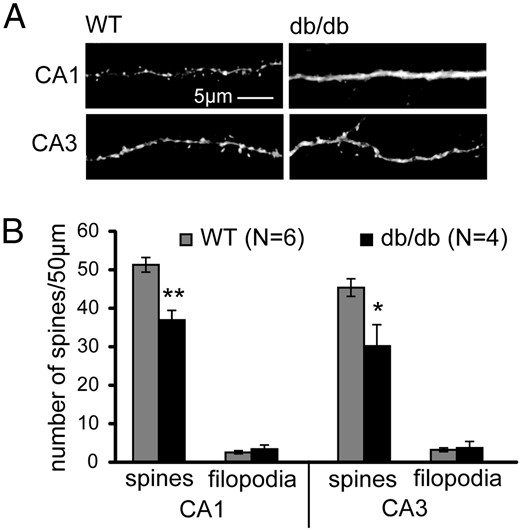
Leptin receptor signaling is required for normal hippocampal spine formation in vivo. Hippocampal slices were prepared from P28 to P32 wild-type (WT) or db/db mutant mice. CA1 and CA3 neurons were filled with lucifer yellow to visualize spine density. Representative images (A) and average spine and filopodia densities (B) of WT and db/db mice are shown. Data were analyzed using Student t tests (±SEM; *, P < .05; **, P < .01).
Leptin increases spine formation via LepRb in organotypic hippocampal slice cultures
To confirm that leptin activation of LepR stimulates spine formation in CA1 or CA3 neurons in the hippocampus, we used hippocampal organotypic slice cultures that preserve the cellular and morphological organization of the hippocampus (38, 39). This allowed us to visualize and manipulate LepR signaling in specific CA1 and CA3 populations of neurons by biolistically transfecting tomato fluorescent protein–expressing construct along with other experimental constructs (40, 41). Leptin increased spine density in both the CA1 and CA3 regions of cultured wild-type mice hippocampi but had no effect on cultures prepared from db/db mice hippocampi (P = .0001, F15,96 = 40.86) (Figure 2, A and B). This increase in spine density was due to an increase in both stubby and mushroom-type mature spines because leptin had no effect on filopodia density in either wild-type or db/db mice. We saw a similar effect of leptin in organotypic slice cultures prepared from rat hippocampi that were biolistically transfected with tomato fluorescent protein (Figure 2, C and D). Leptin increased mature spine density without affecting filopodia density in both the CA1 and CA3 regions (P = .0001, F15, 2171 = 112.5) (Figure 2, C and D). To functionally probe the necessity of the LepRb in rats, we cotransfected shRNA targeting the LepRb (shLepR). We created 2 shRNAs targeting different regions on the LepRb gene and tested the efficacy of both in human embryonic kidney (HEK) cells as well as cultured hippocampal neurons. shLepR3299 reduced the expression of transfected LepRs by >90% in HEK cells and >70% in neurons, whereas shLepR3426 reduced it by >60% in HEK cells and >70% in neurons (data from HEK cells are not shown, for data from neurons, see Figure 2, E and F). The knockdown of LepR using this shRNA3299 blocked the effect of leptin, confirming the requirement of LepR activation in the induction of spinogenesis by leptin (Figure 2, C and D). Because leptin had similar spinogenic effects in both rat and mouse organotypic cultures, we used rat cultures for the rest of the experiments. In addition, spine densities in the CA1 and CA3 regions were similar under both basal and leptin-stimulated conditions from both mouse or rat organotypic cultured slices (spine density ± SEM under control conditions: CA1 = 9.75 ± 1.26 and CA3 = 10.06 ± 1.01 in mouse cultures and CA1 = 7.72 ± 0.95 and CA3 = 7.7 ± 0.68 in rat cultures; spine density ± SEM after leptin treatment: CA1 = 13.36 ± 1.25 and CA3 = 14.87 ± 0.94 in mouse cultures and CA1 = 17.04 ± 1.37 and CA3 = 14.9 ± 0.94 in rat cultures). Therefore, for all further analysis the 2 populations were pooled together. From these data, we conclude that leptin stimulates dendritic spine formation through activation of LepR within CA1 and CA3 neurons in both mouse and rat hippocampi.
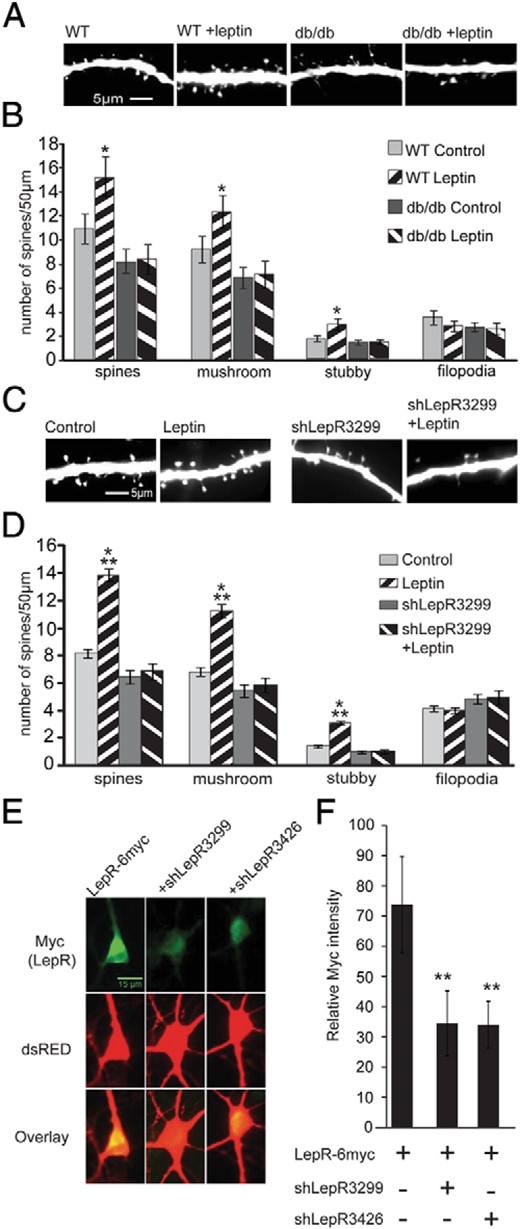
Leptin increases spine formation in hippocampal organotypic slice and dissociated cultures via LepRb. A and B, Organotypic slice cultures, prepared from P5 wild-type (WT) or db/db mice, were transfected with tomato fluorescent protein on DIV2 and stimulated with leptin on DIV4. Cultures were fixed and imaged on DIV7. Representative images (A) and average density of total spines, mushroom spines, stubby spines, and filopodia (B) per condition are shown. C and D, Organotypic slice cultures from P5 Sprague-Dawley rats were transfected with tomato fluorescent protein ± shLepR3299 and were treated as described above. Representative images (C) and average density of total spines, mushroom spines, stubby spines, and filopodia (D) per condition is shown. Data were analyzed using one-way ANOVA followed by Tukey post hoc analysis (±SEM; ***, P < .001; **, P < .01; *, P < .05). E and F, Dissociated rat hippocampal cultures were transfected with Discosoma sp. red fluorescent protein (dsRED) to identify transfected neurons and the LepR-6myc construct alone or along with shLepR3299 or shLepR3426. Cultures were fixed and immunostained for LepR expression using anti-myc antibody. Representative images (E) and quantified data (F) are shown. Immunostaining data were analyzed using Student t tests (**, P < .001, compared with control).
Leptin increases functional synapses in cultured hippocampal neurons
Our next aim was to confirm that leptin-induced spines that have the morphological characteristics of mature spines actually form functional synapses. Dissociated hippocampal neurons were transfected with mRFP-β-actin to allow precise visualization and quantitation of dendritic spine size, shape, density, and functionality (Figure 3A). Leptin increased the density of mature spines in dissociated hippocampal neurons without altering the density of dendritic filopodia, similar to the results from the slice cultures (P = .0001, F15,2980 =191.2) (Figure 3, A and B). Again, leptin's effects on spinogenesis required LepRb because shRNA3299 targeting LepRb inhibited leptin-induced increases in spine density (Figure 3, A and B). We used a second shLepR3426 targeting a different region on the LepRb and a scrambled shRNA control to further confirm the efficacy of our shRNA and test the requirement of the LepR in this signaling cascade. Compared with control neurons, shLepR3426-transfected neurons did not respond to leptin treatment, whereas scrambled shRNA transfected neurons still showed an increase in spine density after leptin treatment (spine density ± SEM: control = 11.55 ± 0.08, leptin = 19.5 ± 0.68, shLepR3426 = 10.9 ± 062, shLepR3426 + leptin = 10.5 ± 0.52, scrambled = 12.02 ± 0.85, and scrambled + leptin = 17.28 ± 1.49). Interestingly, knockdown of LepR also reduced basal spine formation/stability in these dissociated cultures because neurons transfected with shLepR3299 had significantly reduced spine density and increased filopodia density compared with those of unstimulated controls (Figure 3, A and B). In addition, leptin not only increased spine density but also caused a shift in spine head size, which reflects the preferential increase in both mushroom and stubby spines (headsize ± SEM: control = 0.7 ± 0.01 μm, leptin = 0.9 ± 0.01 μm; P = .0001, F3,2927 =147.4). This finding suggests that LepR signaling drives production and stabilization of more mature spine subtypes.
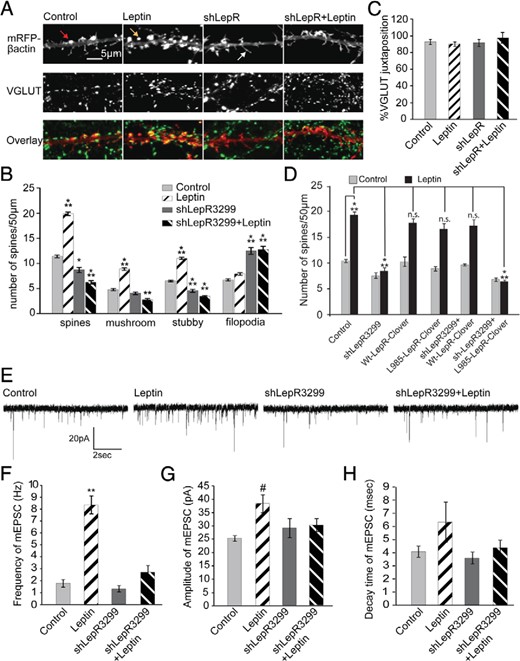
Leptin increases the density of excitatory synapses on dissociated hippocampal neurons. A–C, Cultured hippocampal neurons were transfected on DIV5 with ± shLepR3299, followed by leptin stimulation on DIV7 until DIV12 when the cultures were fixed and immunostained with anti-VGLUT antibody. A, representative images displaying mRFP-β-actin ± shLepR3299 fluorescence, VGLUT staining, and an overlay with mRFP fluorescence in red and VGLUT stain in green. The mRFP fluorescence was used to categorize dendritic protrusions as either filopodia (white arrow) or spines. Spines were further categorized as stubby (red arrow) or mushroom (yellow arrow). B, Average density (±SEM) of total spines, mushroom spines, stubby spines, and filopodia. ***, P < .0001; **, P < .001; *, P < .01. C, Average percent juxtaposition (±SEM) between VGLUT puncta and β-actin–rich spines. D, Cultured hippocampal neurons were transfected on DIV5 with mRFP-β-actin ± shLepR3299, ± mouse Wt-LepR-Clover, ± mouse L985-LepR-Clover, followed by leptin stimulation on DIV7 until DIV12 when the cultures were fixed and imaged. The mRFP fluorescence was used to determine the density of dendritic spines (mushroom and stubby combined). Average density (±SEM) of total spines is shown (***, P .0001; **, P < .01; *, P < .01; n.s., not significant). E–H, Cultured hippocampal neurons were transfected and stimulated as described earlier and mEPSCs were recorded on DIV12. E, Representative traces recorded from control and leptin-stimulated neurons with and without shLepR3299 transfection. Frequency (F), amplitude (G), and decay time (H) of mEPSCs under control and leptin-stimulated conditions ± shLepR3299 are shown. All data were analyzed using one-way ANOVA followed by either Tukey (for spine analysis) or Newman-Keuls (for electrophysiology) post hoc analysis (±SEM; **, P < .001; #, P < .05, compared with control).
To further demonstrate the specificity of shLepR3299 and the intrinsic requirement of LepR for leptin simulation of spinogenesis, we performed a series of “rescue” experiments. A Clover-tagged mouse LepR construct was used for these experiments because it would be insensitive to the shLepR3299 translational repression that was designed to target the rat LepR gene at a site that mismatches with the mouse LepR gene (data not shown and Figure 4G). It was transfected into dissociated hippocampal neurons along with shLepR3299 to rescue leptin's effects. We found that expression of this exogenous mouse LepR had no effect on either basal or stimulated spinogenesis (Figure 3D). shLepR3299 inhibited leptin-stimulated synaptogenesis, but expression of wild-type mouse LepR reversed the shLepR32399 effects (Figure 3D). Interestingly, a mutant mouse LepR, L985-LepR, which is unable to activate the MAPK kinase (Mek)/Erk pathway (31, 42) (Figure 4H), was also unable to rescue leptin's effects when transfected along with shLepR3299 (Figure 3D). This finding suggests that leptin activation of the Mek/Erk cascade is essential for leptin's effects on spinogenesis.
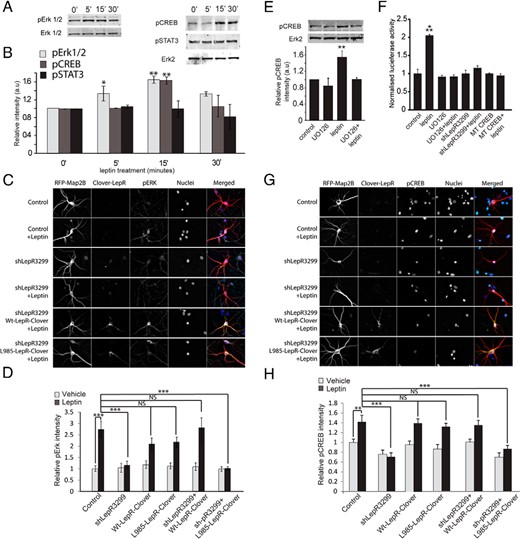
Leptin increases CREB but not STAT3 phosphorylation and transcription via the Mek/Erk pathway. A and B, DIV6 hippocampal neurons were stimulated with leptin for various durations from 5 up to 30 minutes (control: vehicle for 30 minutes). Cells were lysed in RIPA buffer and analyzed using SDS-PAGE. Representative Western blots (A) and average relative intensities (±SEM) (B) of pErk, pCREB, and pSTAT3 bands normalized to Erk2 or Erk1/2 under control and leptin-stimulated conditions are shown. a.u., arbitrary units. C and D, Cultured hippocampal neurons were transfected on DIV5 with mRFP-Map2B, ± shLepR3299, ± mouse Wt-LepR-Clover, ± mouse L985-LepR-Clover, followed by stimulation with or without leptin on DIV7 for 15 minutes until fixed and immunostained with anti-pErk antibody. The intensity of pErk staining was measured from 50 neurons per condition in 2 separate cultures. C, Representative images showing mRFP-Map2B (red), Wt-LepR-Clover, and L985-LepR-Clover (green), nucleus (blue), and pErk (turquoise) staining and an merged image. D, Normalized average relative intensity (±SEM) of pErk staining in transfected neurons under control and leptin-stimulated conditions. The intensity of pErk staining was measured from 50 neurons per condition in 2 separate cultures. E, DIV6 hippocampal neurons were treated with or without UO126 (Mek1 inhibitor) for 30 minutes before a 15-minute stimulation with or without leptin. Cells were lysed and analyzed using SDS-PAGE. Representative Western blots (inset) and average relative intensities (±SEM) of pCREB bands normalized to Erk2 under control and leptin-stimulated conditions ± UO126 are shown. F, Cultured hippocampal neurons were transfected on DIV5 with CRE-luciferase and Gal-CREB constructs along with either empty vector or shLepR3299 or MT CREB, followed by stimulation with or without leptin on DIV7 for 4 hours. UO126 was added 30 minutes before leptin treatment to indicated samples. After leptin stimulation cells were lysed, and the total protein concentration was measured using a BCA assay (Pierce). Luciferase activity was measured using a luciferase kit (Promega). Normalized luciferase activity under various conditions is shown. G and H, Cultured hippocampal neurons were transfected on DIV5 with mRFP-Map2B, ± shLepR3299, ± mouse Wt-LepR-Clover, ± mouse L985-LepR-Clover, followed by stimulation with or without leptin on DIV7 for 15 minutes until fixed and immunostained with anti-pCREB antibody. The intensity of pCREB staining was measured from 53 neurons per condition in 2 separate cultures. G, representative images showing mRFP-Map2B (red), Wt-LepR-Clover and L985-LepR-Clover (green), nucleus (blue), pCREB (turquoise) staining and an merged image. H, Normalized average relative intensity (±SEM) of pCREB staining in transfected neurons under control and leptin-stimulated conditions. Data from Western blots were analyzed using Student t tests (**, P < .001). Data for immunostaining and luciferase activity were analyzed using one-way ANOVA followed by Tukey post hoc analysis (***, P < .0001; **, P < .001; NS, not significant, compared with control).
To confirm that the leptin-induced spines formed functional synapses, we used 2 complementary techniques: immunocytochemistry and electrophysiology. Immunostaining for VGLUT1 (a glutamatergic synaptic marker) and synapsin (a general synaptic marker) showed that these presynaptic markers were found in close opposition with on an average 95% of the mRFP-β-actin–labeled dendritic spines (juxtaposition: control, 92.78 ± 3.183%; leptin, 90.45 ± 2.537%; shLepR3299, 91.82 ± 4.196%; and shLepR3299 + leptin, 97.45 ± 4.847%; P = .59, F3,100 = 0.6416) (Figure 3, A and C). Although leptin increased the total number of dendritic spines, neither leptin nor shLepR3299 altered the percent juxtaposition of spines with presynaptic terminals, indicating that most actin-enriched spines are complete morphological synapses. To monitor the change in the number of functional synapses, we also used whole-cell patch clamping to measure the frequency of mEPSCs. When coupled with changes in dendritic spine density, a change in the frequency of mEPSCs correlates with a change in the number of functional synapses. Leptin treatment increased the frequency of mEPSCs approximately 5 times above control frequencies (P = .001, F3,118 = 41.727) (Figure 3, E and F). In contrast, whereas the mean amplitude of mEPSCs was significantly increased in some cultures, the effect was not seen in most cultures, and leptin had no effect on the decay time of the mEPSCs (for amplitude measurements: P = .011, F3,118 = 3.901; for decay time measurements: P = .11, F3,118 = 2.047) (Figure 3, G and H). Targeted knockdown of LepR completely blocked leptin's ability to increase mEPSC frequency (Figure 3, E and F). Taken together, these data provide strong evidence that leptin stimulates the formation of functional synapses in dissociated hippocampal cultures through activation of LepRb.
Leptin stimulates the phosphorylation and activation of CREB via the Mek/Erk pathway
LepR is a type 1 cytokine receptor that can initiate different signaling cascades, including the Janus tyrosine kinase/STAT pathway, the phosphatidylinositol 3-kinase pathway, and the Mek/Erk/CREB pathway (43–45). Similar to previous reports (22, 46, 47), we found that a 15-minute leptin treatment preferentially increased Erk and CREB but not STAT3 phosphorylation in our cultures (P = .0051 for control vs 15-minute leptin conditions) (Figure 4, A and B). The increase in Erk and CREB phosphorylation was blocked by shLepR3299 (as detected by immunostaining) (Figure 4, C, D, G, and H), Furthermore, the inhibition of Erk and CREB phosphorylation by shLepR3299 was rescued by expression of a wild-type mouse LepR cDNA, which was insensitive to shRNA knockdown, but not by expression of L985-LepR (Figure 4, C–F). Erk activation was necessary for leptin-induced CREB phosphorylation because pretreatment with UO126, a Mek1 inhibitor blocked leptin effects on CREB phosphorylation. We also confirmed that leptin activated CREB-dependent transcription using a CRE-luciferase assay. Leptin (4-hour treatment) increased CREB-dependent transcription 2-fold (P = .0001, F7,16 = 32.82) and pretreatment with UO126 or transfection of shLepR3299 blocked this effect (Figure 4F). Most importantly, MT CREB (S133A-CREB), a mutant CREB form that cannot be phosphorylated at Ser133, did not support CRE-dependent transcription after leptin stimulation, supporting the conclusion that leptin's effects on CREB-dependent transcription requires CREB phosphorylation at Ser133.
CREB activity is required for leptin-induced synaptogenesis
Activation of CREB and CREB-dependent transcription stimulates synaptogenesis and is required for activity-induced spine formation (30). To test whether leptin activation of CREB was required for leptin induction of spinogenesis, we cotransfected either ACREB, a dominant-negative form of CREB or shCREB, a shRNA that blocks the expression of endogenous CREB along with mRFP-β-actin. Transfection of either ACREB or shCREB did not affect neuronal viability under our culture conditions (30, 40, 41). Inhibition of CREB by either method completely blocked leptin-induced spine formation, showing that CREB expression and CREB-dependent transcription are essential for leptin's effects (P = .0001, F23,2828 = 83.87) (Figure 5, A and B). In contrast, ACREB and shCREB transfection alone did not significantly alter spine density compared with that for the control. We next confirmed the requirement for CREB in leptin-induced synapse formation by analyzing the frequency of mEPSCs after inhibition of CREB function. Expression of ACREB completely blocked leptin's effects on mEPSC frequency but had no effect on control levels (Figure 5, C–E).
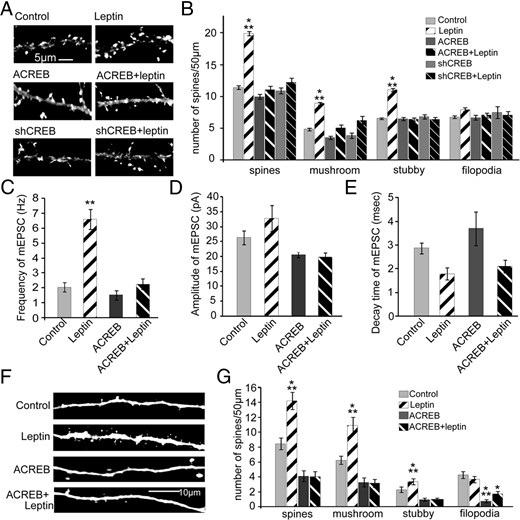
CREB activity is required for leptin-induced synapse formation. A and B, Cultured hippocampal neurons were transfected on DIV5 with mRFP-βactin ± ACREB ± shCREB, followed by stimulation with or without leptin on DIV7 until DIV12 when the cultures were fixed. Representative images (A) and average density (±SEM) of total spines, mushroom spines, stubby spines and filopodia (B) under control and leptin-stimulated conditions ± ACREB ± shCREB are shown. C–E, Cultured hippocampal neurons were transfected and stimulated as described earlier, and mEPSCs were recorded on DIV12. Frequency (C), amplitude (D), and decay time (E) of mEPSCs under control and leptin-stimulated conditions ± ACREB are shown. F and G, Organotypic slice cultures prepared from P5 rats were biolistically transfected on DIV2 with tdTomato ± ACREB, followed by stimulation with or without leptin on DIV4 until DIV7 when the cultures were fixed. Representative images (F) and average densities (±SEM) of total spines, mushroom spines, stubby spines and filopodia (G) under control and leptin-stimulated conditions ± ACREB are shown. Data were analyzed using one-way ANOVA followed by either Tukey (for spine analysis) or Newman-Keuls (for electrophysiology) post hoc analysis (***, P < .0001; **, P < .001; *, P < .01; compared with control).
We found similar results in hippocampal slice cultures as CA1 and CA3 neurons transfected with ACREB did not respond to leptin treatment, whereas control neurons still showed an increase in spine density (Figure 5, F and G). These results strongly indicate the importance of CREB and CREB-dependent transcription in leptin's effects on synapse formation in the hippocampus.
Leptin requires CREB-regulated miR132 transcription and activity to increase synapse formation
Numerous studies have shown a central role of CREB in neuronal plasticity but only a few downstream targets of this prolific transcription factor have been implicated in synaptogenesis. Using high-throughput screening methods (CREB-chromatin immunoprecipitation-sequencing), we identified the CREB-bound miR132 as a transcript whose expression is regulated by leptin. MicroRNAs are short RNAs that inhibit the translation of their target mRNA by binding to specific regulatory elements on the mRNA. miR132 has emerged as an interesting CREB target that has been shown to be involved in activity-dependent as well as neurotrophic factor–dependent dendritic arborization and synaptogenesis (41, 48, 49). Using real-time qRT-PCR, we found that leptin treatment increased the expression of pre-miR132 and mature miR132 in dissociated hippocampal cultures. Leptin increased the transcription of pre-miR132 within 30 minutes, with expression peaking at around 2 to 4 hours and levels returning to near baseline within 8 hours (Figure 6A). Mature miR132 levels increased modestly between 2 and 4 hours and were dramatically increased after 8 hours of leptin treatment (Figure 6A). Furthermore, leptin stimulation of miR132 expression in vitro was blocked by UO126 pretreatment, confirming that the Mek/Erk pathway is required (data not shown).
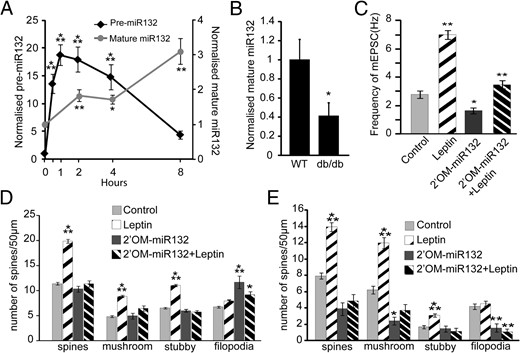
Leptin induces miR132 transcription, which is required for spine formation. A, DIV6 hippocampal neurons were treated with leptin for various durations from 30 minutes to 8 hours. Cells were lysed in TRIzol, and RNA was isolated and converted to cDNA (using Random Hexamers for pre-miR132 or TaqMan RT-primers for mature-miR132). The cDNA samples were then analyzed for changes in pre-miR132 transcript levels (normalized to PPIA) and mature miR132 transcript levels (normalized to U6 snRNA). B, Hippocampi collected from P42 wild-type (WT, n = 6) or db/db mice (n = 4) were lysed in TRIzol, and RNA was isolated. cDNA was prepared and analyzed for mature miR132 transcript levels (normalized to U6 snRNA). C and D, Cultured hippocampal neurons were transfected on DIV5 with mRFP-βactin ± 2′OM-miR132, followed by stimulation with or without leptin on DIV7 until DIV12 when the cultures were either fixed and imaged or used for electrophysiological measurements. C, Frequency of mEPSC under control and leptin-stimulated conditions ± 2′OM-miR132. D, average density (±SEM) of total spines, mushroom spines, stubby spines, and filopodia under control and leptin-stimulated conditions ± 2′OM-miR132. E, Organotypic slice cultures prepared from P5 rats were biolistically transfected on DIV2 with tdTomato ± 2′OM-miR132, followed by stimulation with or without leptin on DIV4 until DIV7 when the cultures were fixed. Average densities (±SEM) of total spines, mushroom spines, stubby spines, and filopodia under control and leptin-stimulated conditions ± 2′OM-miR132 were quantified. RT-PCR data were analyzed using Student t tests. Spine density and electrophysiological data were analyzed using one-way ANOVA followed by either Tukey (for spine analysis) or Newman-Keuls (for electrophysiology) post hoc analysis (***, P < .0001; **, P < .001; *, P < .05, compared with control).
To determine whether leptin signaling also regulates miR132 levels in vivo we used qRT-PCR to examine the levels of mature miR132 from hippocampi of age-matched 40- to 50-day-old wild-type and db/db mice. We found that basal levels of mature miR132 are approximately 60% lower in db/db mice than in wild-type mice (P = .04) (Figure 6B).
We next determined whether miR132 is required for leptin-induced synaptogenesis. To inhibit miR132 function, we transfected neurons with antisense 2′OM-RNA oligonucleotide targeting miR132 (2′OM-miR132) along with mRFP-β-actin. Transfection of 2′OM-miR132 had no significant effect on the density of dendritic spines under basal conditions but did increase filopodia density slightly (Figure 6D). However, leptin failed to increase spine density in 2′OM-miR132–transfected neurons (Figure 6D).
We also analyzed mEPSC frequency after miR132 inhibition. As previously demonstrated, leptin significantly increased the frequency of mEPSCs. In contrast, neurons transfected with 2′OM-miR132 showed a slight decrease in mEPSC frequency under control conditions as has been reported previously (30), but, more importantly, neurons in which miR132 function was blocked failed to show an increase in mEPSC frequency after leptin stimulation (Figure 6C). Inhibition of miR132 activity also blocked leptin's effects on spine formation in organotypic slice cultures but again had no effect on basal spine density (Figure 6E). These data support the conclusion that leptin induction of miR132 is required for leptin-stimulated synaptogenesis.
p250GAP, a miR132 target, mediatesleptin-regulated synapse formation
As noted previously, microRNAs can inhibit translation of target mRNA through interactions with specific regulator elements on the mRNA. We recently demonstrated that miR132 regulates activity-dependent dendritic growth and synaptogenesis by inhibiting the translation of its target, p250GAP, a Rac GTPase-activating protein (41). Knockdown of p250GAP by targeted shRNA markedly increases spine density and spine size, an effect similar to the effects of leptin we report here (30). Therefore, next we tested whether leptin suppressed p250GAP expression and whether this was required for leptin-stimulated synaptogenesis. Leptin dramatically reduced p250GAP expression (80% reduction after 24 hours) in cultured hippocampal neurons via the Mek/Erk pathway (P = .0001) (Figure 7, A and B). Interestingly, we also observed a significant increase in p250GAP expression in hippocampi from db/db mice, suggesting that leptin normally suppresses the expression of this critical regulator (P = .04) (Figure 7C). Furthermore, expression of a mutant p250GAP mRNA (MTp250GAP), which cannot be suppressed by miR132 (because it lacks a functional microRNA regulatory element), inhibited leptin-induced spinogenesis. This finding supports the hypothesis that leptin regulates synaptogenesis via miR132-dependent suppression of p250GAP (Figure 7D).
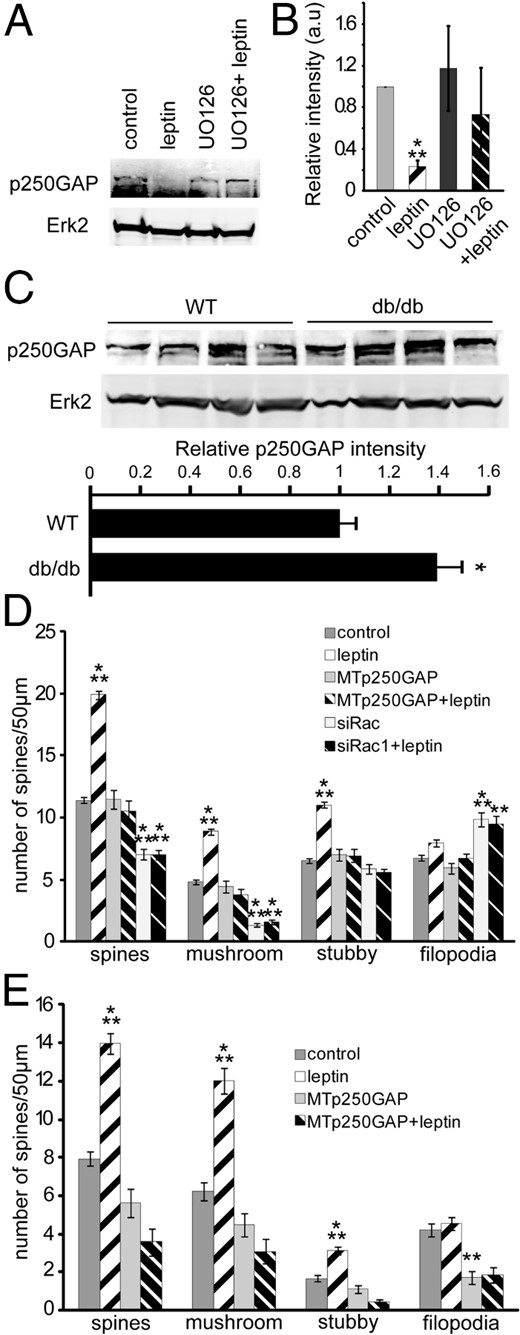
Leptin induces spine formation by reducing p250GAP expression. A and B, DIV6 hippocampal neurons were treated with or without 20 μM UO126 (Mek1 inhibitor) for 30 minutes before a 24-hour stimulation with or without leptin. Cells were lysed in RIPA buffer and analyzed using SDS-PAGE. Representative Western blots (A)and average relative intensities (±SEM) (B) of p250GAP bands normalized to Erk2 under control and leptin-stimulated conditions ± UO126. C, Hippocampi collected from P42 wild-type (WT, n = 4) or db/db mice (n = 4) were lysed, and protein was isolated and analyzed using SDS-PAGE. Representative Western blots and average relative intensities (±SEM) of p250GAP bands normalized to Erk2 from wild-type and db/db mice are shown. D, Cultured hippocampal neurons were transfected on DIV5 with mRFP-βactin ± MTp250GAP ± small interfering Rac1 (siRac1), followed by stimulation with or without leptin on DIV7 until DIV12 when the cultures were fixed. Average densities (±SEM) of total spines, mushroom spines, stubby spines, and filopodia under control and leptin-stimulated conditions ± MTp250GAP ± siRac1 were quantified. E, Organotypic slice cultures prepared from P5 rats were biolistically transfected on DIV2 with tdTomato ± MTp250GAP ± siRac1, followed by stimulation with or without leptin on DIV4 until DIV7 when the cultures were fixed. Average densities (±SEM) of total spines, mushroom spines, stubby spines, and filopodia under control and leptin-stimulated conditions ± MTp250GAP ± siRac1 were quantified. Data for Western blots were analyzed using Student t tests. Spine data were analyzed using one-way ANOVA followed by Tukey post hoc analysis (***, P < .0001; **, P < .001; *, P < .01; #, P < .05, compared to control).
P250GAP has been shown to regulate Rac, RhoA, and Cdc42 activity by increasing their endogenous GTPase activity (50, 51). In 7-day-old cultured hippocampal neurons, p250GAP primarily inhibits the activity of Rac1, a central regulator of actin rearrangement, which is important for spinogenesis (30). Here we found that shRNA-mediated knockdown of Rac1 inhibited basal and leptin-stimulated mature spine formation and increased filopodia density; suggesting that leptin activation of Rac1 is required for leptin's effects on synapse formation (Figure 7D). Finally, we found that both MTp250GAP and shRac1 blocked leptin's effects of spine induction in slice cultures as well (Figure 7E).
Discussion
Leptin as a hormone is a prominent indicator of an individual's metabolic state in adulthood (1, 2). Leptin has previously been shown to induce synaptogenesis in the hypothalamus (52). However, its ability to modulate diverse systems is evident from widespread expression of LepRs. In the central nervous system, LepR mRNA and immunoreactivity are found in many different brain regions including the CA1, CA3, and dentate gyrus of the hippocampus (8–12, 53, 54). Although leptin is known to stimulate filopodia formation in the hippocampus (28), whether these filopodia mature into stable spines and form functional synapses and the cellular mechanisms involved are not known. Here we describe a novel critical pathway by which leptin induces long-term spine formation and synaptogenesis in CA1 and CA3 neurons, including evidence that this mechanism also occurs in vivo.
Leptin stimulates dendritic spine formation in CA1 and CA3 neurons in vitro and in vivo
Here we show for the first time that leptin preferentially increases the density of functional, stubby, and mushroom-type mature spines in both slice and dissociated cultures. Taken together with the high correlation of these morphologically mature spines with presynaptic markers and the increase in frequency of α-amino-3-hydroxy-5-methyl-4-isoxazolepropionic acid receptor (AMPAR)–based mEPSCs, our data strongly support a role for leptin-promoting dendritic spines with functional glutamatergic synapses. Leptin induction of both spinogenesis and synaptogenesis was dose-dependent and mediated by the LepRb as it was blocked by shRNAs specifically targeting the long form of the receptor and was absent in db/db mice. Furthermore, we show for the first time that LepR is required for normal spine formation in CA1 and CA3 neurons in vivo, consistent with previous findings showing that spine number is also reduced in dentate gyrus neurons in db/db mice (27). Dendritic spines, although dynamic in nature, can be stable for at least 1 year in vivo after activity-dependent strengthening (55, 56). Therefore, whether these in vivo effects are due to a lack of LepR signaling during development or reflect a critical role for leptin in maintaining spine number in adults remains to be established. However, because changes in spine type, size, density, and receptor composition have been associated with alterations in hippocampus-dependent behaviors, such as cognition, depression, and anxiety (24, 57), this is clearly a potential mechanism by which leptin could modulate these behaviors.
CREB-dependent transcription is essential for leptin-induced synaptogenesis
Although leptin has been shown to acutely stimulate the formation of filopodia, de novo gene transcription is required for the formation of the mature synapse. Our study identifies CREB-dependent transcription as critical for leptin-induced synapse formation in the hippocampus. This finding is consistent with previous studies from our group and others showing CREB is also required for synaptic activity and other neurotrophic factor-stimulated dendritic development and synapse formation (30, 40, 48, 58, 59). Leptin has previously been shown to increase the phosphorylation of Ser133 in CREB (60, 61), including in the hippocampus (47). However, the important downstream consequences of leptin-induced phosphorylation of CREB were not known. Interestingly, we do not see any induction of STAT3, which has been the hallmark of leptin signaling, at least in the hypothalamic nuclei (62). One possible reason is the high levels of basal STAT3 phosphorylation that we see in our hippocampal cultures. In addition, intraperitoneal leptin has also been shown to preferentially activate CREB, but not STAT3, in neonatal rat hippocampus in vivo (22).
Here we show that leptin activates CREB through the Mek/Erk pathway, consistent with previous studies showing that leptin activates the MAPK cascade (44), including in the hippocampus (63). The activation of the MAPK pathway by leptin requires LepRb because targeted knockdown of the endogenous LepR blocks CREB and Erk activation. Further supporting this conclusion is the fact that expression of mouse wild-type LepR but not L985-LepR (a mutant that lacks the ability to active Mek/Erk) rescues leptin effects on spinogenesis from shRNA targeted knockdown of endogenous LepR. The MAPK cascade has also been shown to be critical for activity and brain-derived neurotrophic factor-stimulated dendritic development and spine formation (40, 64, 65). Furthermore, this pathway has been shown to be important for leptin's effects on actin reorganization (28). Given the common signaling requirements of leptin and brain-derived neurotrophic factor for the MAPK pathway and CREB, it highlights the critical role of this pathway and suggests that these 2 neurotrophic factors converge on a common, or at least overlapping, signaling pathway to stimulate dendritic spine and synapse formation.
Leptin-induced synaptogenesis requires miR132
This study is also the first to demonstrate that leptin increases the expression of miR132 and that this microRNA is essential for leptin's effects on synaptogenesis. microRNAs regulate diverse neurodevelopmental processes, synaptic plasticity in the mature brain, and cognitive function (66). The pre-miR132 transcript contains 2 different miRNA transcripts, miR132 and miR212 (48). We have focused on miR132 because it is reported to be the predominant microRNA transcribed from this locus (67), and we have previously shown that miR132 is critical for activity-dependent synaptogenesis (30). Leptin increases transcription of both pre-miR132 and mature miR132 >8-fold. In addition, leptin stimulation of miR132 is required in vivo to maintain miR132 levels in the hippocampus, because we found that mice lacking LepRb signaling (db/db) had a 60% reduction in mature miR132 levels. Interestingly, miR132 knockout mice also show impaired memory formation, similar to the cognitive defect of the db/db mice (68).
Role of p250GAP and Rac1 in leptin-induced synaptogenesis
We have previously shown that mature miR132 increases synaptogenesis, at least in part, by suppressing expression of the Rac1 inhibitor p250GAP (30). Leptin also seems to increase synaptogenesis through suppression of p250GAP after induction of miR132, as not only did leptin suppress p250GAP expression but also the effects of leptin were blocked by expression of a mutant mRNA encoding p250GAP that lacks the regulatory site for miR132. Importantly, we demonstrate a critical role for leptin regulating the expression of both miR132 and p250GAP in vivo, because levels of miR132 were significantly decreased and those of p250GAP significantly increased in hippocampi from 40- to 45-day-old db/db mice, suggesting that leptin is a key regulator of p250GAP expression through miR132 even in adults.
Rac1, a small GTPase, is a central promoter of actin reorganization and synapse formation in the hippocampus (50) and is inactivated by p250GAP (30). We found that leptin requires Rac1, because targeted knockdown of Rac1 suppressed leptin-stimulated synaptogenesis. This leads to our proposed model (Figure 8), in which leptin activates the MAPK pathway to increase CREB-dependent transcription. Consequently, miR132 expression is increased, suppressing the translation of mRNA encoding p250GAP and thus reducing p250GAP levels and removing an inhibitor of Rac1 to initiate spine and synapse formation. Because leptin can activate MAPK and CREB in the hypothalamus (69–71), this mechanism could also potentially underlie longer-term effects of leptin on synaptogenesis in the hypothalamus, although it is likely that the rapid rewiring induced by leptin in the hypothalamus (52) involves a more acute mechanism.
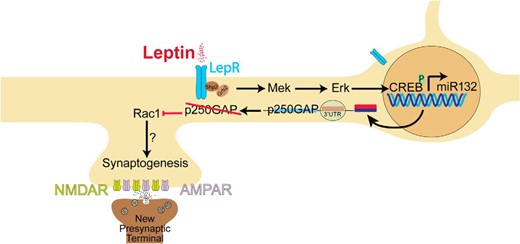
Schematic representation of the signaling cascade activated by leptin, leading to excitatory synapse formation in hippocampal neurons. AMPAR, α-amino-3-hydroxy-5-methyl-4-isoxazolepropionic acid receptor; CREB, cAMP response element–binding protein; LepR, leptin receptor; Mek/Erk, mitogen-activated protein kinase pathway; miR132, microRNA-132; NMDAR, N-methyl-d-aspartate receptor; p250GAP, p250 GTPase activating protein; Rac1, Ras-related C3 botulinum toxin substrate 1; 3′UTR, 3′-untranslated region.
Physiological consequences of leptin action in the hippocampus
Over the past decade, numerous reports have suggested that leptin critically modulates hippocampus-dependent behaviors. Leptin improves retention of hippocampal-dependent learning tasks (72), whereas db/db mice are impaired at spatial learning tasks (17). Recently, leptin has also been shown to inhibit food intake when injected directly into the hippocampus, probably through actions on food-associated memories (73). Furthermore, leptin has antidepressive effects when injected directly into the hippocampus, whereas knockdown of LepR induces emotional behavior defects (9, 15), which are also seen in db/db mice (16). Because spine number and shape are closely correlated with learning and memory, depression, and anxiety disorders (24, 57), leptin induction of mature spines and glutamatergic synapses could underlie these behavioral effects of leptin (17, 19, 63).
Plasma leptin enters the hippocampus at saturating concentrations similar to the levels reached within the hypothalamus (74), suggesting that circulating leptin, which surges during development and is known to reflect the nutritional state of adult animals, could modulate the function of the hippocampus to influence development, memory formation, emotional behavior, and even food intake (15–17, 22, 72, 73). In addition to a peripheral source of leptin, local synthesis and release of leptin could be a potential mechanism, as both leptin mRNA and immunoreactivity have been observed in the hippocampus (75).
In summary, we have identified a novel signaling pathway by which leptin stimulates synaptogenesis via activation of the MAPK pathways and induction of CREB-dependent transcription. This then leads to an increase in miR132 that suppresses expression of the Rac1 inhibitor p250GAP, thus activating Rac1 and promoting synaptogenesis. Taken together, these results reveal an underexplored but important role for leptin as a putative neurotrophic factor.
Acknowledgments
We thank Dr Martin Myers for providing mouse clones and mutants of LepR.
This work was supported by This work was supported by the National Institutes of Health (Grants MH086032 to G.A.W. and DK083452 to S.M.A.). The content is solely the responsibility of the authors and does not necessarily represent the official views of the National Institute of Diabetes and Digestion and Kidney Disease, the National Institute of Mental Health, or the National Institutes of Health.
Disclosure Summary: The authors have nothing to disclose.
Abbreviations
- CRE
cAMP response element
- CREB
cAMP response element-binding protein
- DIV
day in vitro
- HEK
human embryonic kidney
- LepR
leptin receptor
- LepRb
long form of the leptin receptor
- Mek
MAPK kinase
- mEPSC
miniature excitatory postsynaptic current
- miR132
microRNA-132
- mRFP
monomeric red fluorescent protein
- OM
O-methyl
- p
phospho
- P
postnatal day
- p250GAP
p250 GTPase activating protein
- PPIA
peptidylprolyl isomerase A
- qRT-PCR
quantitative RT-PCR
- RIPA
radioimmunoprecipitation assay
- sh
short hairpin
- sn
small nuclear
- STAT
signal transducer and activator of transcription
- VGLUT
vesicular glutamate transporter.
