


Abstract
Sighthounds, a distinctive group of hounds comprising numerous breeds, have their origins rooted in ancient artificial selection of dogs. In this study, we performed genome sequencing for 123 sighthounds, including one breed from Africa, six breeds from Europe, two breeds from Russia, and four breeds and 12 village dogs from the Middle East. We gathered public genome data of five sighthounds and 98 other dogs as well as 31 gray wolves to pinpoint the origin and genes influencing the morphology of the sighthound genome. Population genomic analysis suggested that sighthounds originated from native dogs independently and were comprehensively admixed among breeds, supporting the multiple origins hypothesis of sighthounds. An additional 67 published ancient wolf genomes were added for gene flow detection. Results showed dramatic admixture of ancient wolves in African sighthounds, even more than with modern wolves. Whole-genome scan analysis identified 17 positively selected genes (PSGs) in the African population, 27 PSGs in the European population, and 54 PSGs in the Middle Eastern population. None of the PSGs overlapped in the three populations. Pooled PSGs of the three populations were significantly enriched in “regulation of release of sequestered calcium ion into cytosol” (gene ontology: 0051279), which is related to blood circulation and heart contraction. In addition, ESR1, JAK2, ADRB1, PRKCE, and CAMK2D were under positive selection in all three selected groups. This suggests that different PSGs in the same pathway contributed to the similar phenotype of sighthounds. We identified an ESR1 mutation (chr1: g.42,177,149 T > C) in the transcription factor (TF) binding site of Stat5a and a JAK2 mutation (chr1: g.93,277,007 T > A) in the TF binding site of Sox5. Functional experiments confirmed that the ESR1 and JAK2 mutation reduced their expression. Our results provide new insights into the domestication history and genomic basis of sighthounds.
Introduction
Human–dog coexistence can be traced back approximately 14,000–32,000 years (Savolainen et al. 2002; Ding et al. 2012; Thalmann et al. 2013; Frantz et al. 2016; Wang et al. 2016). At present, over 400 breeds are registered with American Kennel Club (AKC) and Fédération Cynologique Internationale (FCI). Due to their extensive phenotypic diversity, dogs serve as valuable subjects for comparative genomics research (Zhou et al. 2022). Notably, various genome-wide association studies (GWAS) have elucidated the genetic basis of phenotype variations in dogs, such as body size, coat color, limb length, skull shape, and longevity (Schmutz et al. 2002; Sutter and Ostrander 2004; Rimbault et al. 2013; Plassais et al. 2019). Furthermore, investigations on positive selection have shed light on the evolutionary processes underlying certain dog breeds selectively bred by humans for specific purposes like sport-hunting dogs (Kim et al. 2018).
The majority of modern dog breeds emerged through deliberate reproductive isolation and artificial selection practices during the mid-19th century (Parker et al. 2004) contributed to the majority of modern breeds. However, certain sighthound breeds can trace their origins back to the hunting demand of prehistoric humans. Previous research has indicated that Greyhounds lack the main haplotype found in all dogs, supporting their ancient lineage and implying that they represent a well-preserved primal sighthound breed (Savolainen et al. 2002). Supporting this perspective, Greyhounds boast a pedigree history dating back approximately 8,000 years (Como 2004). Furthermore, analysis of molecular markers further identified Afghan hounds and Salukis as two of the most ancient breeds (Parker et al. 2004). These findings imply that sighthounds may have played an important role in the transition from a hunter-gathering to an agrarian society in ancient human civilizations, potentially initiating the early formation of distinct breeds (Parker et al. 2017). Due to their ancient lineages and absence of written records, the precise origin of sighthound breeds remains ambiguous. Legends and accounts of sighthounds can be found across Africa, Asia, the Mediterranean coast, and other regions, supported by intriguing archeological evidence (supplementary fig. S1, Supplementary Material online). Following the migration of human populations, these breeds dispersed to various parts of the world, including the Americas and Australia, gaining widespread recognition.
Sighthounds exhibit a wide range of characteristics. For instance, the Irish Wolfhound is exceptionally tall, with males reaching a minimum height of 32 inches (approximately 81 cm) at the shoulder, while the Italian Greyhound only has an average height of 33–38 cm. Sighthound breeds also display considerable coat variation, such as the Afghan Hound, possessing thick and long hair suitable for cold mountainous areas, and others such as the Azawakh, possessing shorthair and lacking the undercoat layer. However, while sighthound breeds encompass a broad spectrum, they do share distinctive phenotypes including a deep chest, slim limbs, and lean body (Dutrow et al. 2022), as well as specialized hematological features (Court 1999). These physical traits are associated with the unique specialization of sighthounds, which involves the visual detection of prey, followed by their pursuit and capture with exceptional speed. To facilitate their swift running abilities, their deep yet narrow chests provide increased pleural volume, accommodating the placement of lungs and heart without a significant increase in body cross-section (Hancock 2012). These distinctive features reflect the extensive artificial selection that has shaped sighthound breeds, ensuring that their agility and focus on hunting, with the selection for keen eyesight, further reflected in their elongated and narrow skulls (McGreevy et al. 2013). The profound impact of artificial selection extends beyond physical traits to the neural and cardiovascular systems of these dogs. For example, Greyhounds frequently suffer from hyperthermia and hyperhomocysteinemia (Brunson and Hogan 2004; Kent et al. 2014; Pols et al. 2016; Heilmann et al. 2017), and sighthound arterial pressure is the highest among domestic dogs (Bodey and Michell 1996).
To further investigate the distinctive characteristics of sighthounds, we conducted genome sequencing of 123 genomes of sighthounds from Africa, Europe, Russia, and the Middle East, as well as 12 genomes of village dogs from the Middle East. By integrating these data with publicly available genomes of five sighthounds, 98 other dogs, and 31 gray wolves, we reconstructed the population structure and demographic history of the sighthounds and further explored the origin of and gene flow across different breeds of sighthounds from a genomic perspective. Furthermore, based on the identification of signatures of positive selection, we examined the potential genomic basis responsible for the shared phenotypic traits observed in sighthounds.
Results
Geographic Distribution of Sighthounds
In the present study, we collected samples from 123 sighthounds from 13 countries in Eurasia and Africa, as well as 12 village dogs from Iran (supplementary table S1, Supplementary Material online). Furthermore, we incorporated publicly available genome data from various sources, including five sighthounds, 48 village dogs, 50 pedigree breeds, and 31 gray wolves (supplementary table S2, Supplementary Material online) (Freedman et al. 2014; Gou et al. 2014; Fan et al. 2016; Marsden et al. 2016; Wang et al. 2016). The representative, sighthound breeds included six European breeds (five Greyhounds, three Irish Wolfhounds, three Scottish Deerhounds, one Galgo, one Italian Greyhound, and two Hungarian Greyhounds [Magyar Agár]), two Russian breeds (23 Borzois and 13 Chortais); two Middle Eastern breeds (four Afghan Hounds and three Tazys from Iran); and two Central Asian breeds from (15 Taigans from Kyrgyzstan and 19 Tazys from Kazakhstan and Turkmenistan), as well as 15 African native sighthounds from Nigeria (supplementary fig. S2, Supplementary Material online) and seven Shaanxi sighthounds from China (fig. 1a). The Shaanxi sighthound, also known as the Xi dog, is a native Chinese sighthound breed characterized by a linkage disequilibrium (LD) decay distance compared with European breeds (Yang et al. 2019). Overall, our data set covered a wide range of sighthound origins, encompassing most possible lineages.
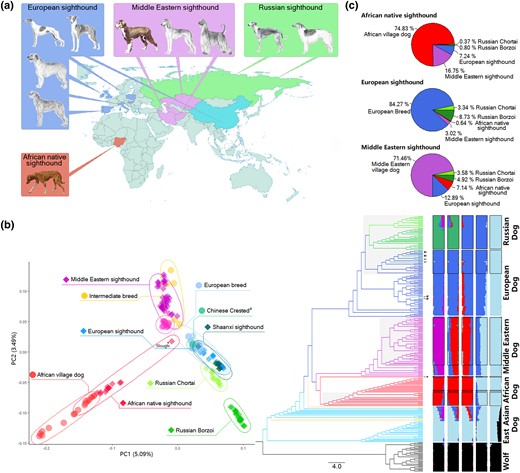
Geographic and genetic grouping of samples. (a) Locations of sample collection, with photos of dogs sourced from AKC and Wiki. (b) PCA plot showing the distribution of all dogs, excluding East Asian village dogs (left); neighbor-joining phylogenetic tree highlighting relationships between samples (middle); and admixture analysis displaying population structure (right). Sighthound individuals are represented by shaded branches in the phylogenetic tree, while the framed structure bar indicates sighthound individuals. Notably, sighthound samples from the Middle East, Africa, and Europe closely aligned with their respective local samples. Shaanxi sighthounds (indicated by arrowhead pointing to clades) merged with the European sighthound population in both the phylogenetic tree and admixture analysis. The Sloughi individual (marked by asterisks) was excluded from selection and population analysis due to genetic admixture and its outlier position in PCA, neighbor-joining tree, and structure analysis. (c) RFMix result illustrating genetic ancestry of sighthound populations.
Whole-Genome Sequencing and SNP Calling
Whole-genome sequencing was conducted for 135 individuals, with performed to an average coverage of 12.84× (ranging from 4.61 to 25.75) and 134 published individuals, with an average coverage of 15.90× (ranging from 7.00 to 35.07) (supplementary tables S1 and S2, Supplementary Material online). Following stringent quality filtering (see Materials and Methods), we retained 26.54 million single nucleotide polymorphisms (SNPs) and 6.24 million small indels on the autosomes for further analysis. The sex chromosomes were excluded due to their hemizygote state in male, which makes them more susceptible to demographic and selective effects than autosomes (Gottipati et al. 2011; Meisel and Connallon 2013).
Population Structure, Phylogeny, and Genetic Diversity
Principal component analysis (PCA) was conducted to investigate the relationships between individuals. The results visualized two-dimensionally demonstrated that the dogs formed a distinct and tight cluster, separate from wolves (supplementary fig. S3a, Supplementary Material online). When focusing on the dogs, we observed a division between East Asian indigenous dogs and other dog populations. Interestingly, Shaanxi sighthounds clustered tightly with European sighthounds rather than with indigenous Chinese dogs (fig. 1b and supplementary fig. S3b, Supplementary Material online). Consequently, we conducted further PCA solely on dogs, excluding the lineage of East Asian indigenous dogs, which revealed a clear geographic pattern (fig. 1b): 1) African native sighthounds clustered with African village dogs, representing sister branch of Middle Eastern dogs; 2) Middle Eastern sighthounds clustered with Middle Eastern village dogs; 3) European sighthounds clustered with breeds from Europe; and 4) Russian sighthounds split into two clusters, with the Chortai breed showing closer proximity to European dogs than to Borzoi dogs. To further explore the genetic relationships among these individuals, we performed structure analysis to cluster individuals into different groups (fig. 1b). The results aligned with the PCA findings. The East Asian dogs separated initially, followed by the formation of four distinct geographically based clusters: Europe, Middle East, Africa, and Russia. Notably, the Chortai breed was found to be an admixture of Borzoi and Middle Eastern dogs.
Further, phylogenetic analysis showed that dogs diverged from wolves at the root of the tree. Middle Eastern and African dogs formed sister branches, while the African native sighthounds exhibited a unique pattern, occupying positions closer to the wolves than the branches of African village dog. Notably, as African dogs have been established as a distinct population based on mitochondrial DNA and nuclear genomes (Boyko et al. 2009; Wang et al. 2016; Adeola et al. 2017; Liu et al. 2018), the African native sighthounds may represent a subbreed with an unknown lineage. European dogs grouped together with Russian dogs. Furthermore, the sighthounds exhibited a distinct separation from other dog breeds and displayed a clear geographic pattern, reflecting their breeding history. The Borzoi and Chortai breeds also formed a separate lineage, closely clustering with other European breeds.
After grouping analysis, genetic diversity (θπ) within our data set was calculated (supplementary fig. S4, Supplementary Material online). Results showed that all sighthounds exhibited lower diversity than their corresponding indigenous dogs (P < 6.86 × 10⁻⁸) for all three comparisons. Notably, European sighthounds hold the lowest diversity (1.07 × 10⁻³ average), while Eastern Asian village dogs showed the highest diversity (1.31 × 10⁻³ average). Both Middle Eastern village dogs and sighthounds demonstrated relatively high diversity.
Furthermore, our study identified five types of native sighthounds not officially recognized by FCI or AKC: African native sighthound, Chortai, Shaanxi sighthound, Taigan, and Tazy. To identify possible differences between native sighthounds and other recognized sighthounds, we analyzed their genetic diversity, inbreeding coefficient, and runs of homozygosity (ROH). Compared with recognized sighthounds, most native sighthounds displayed significantly higher diversity, lower inbreeding coefficient, and shorter ROH (supplementary fig. S5, Supplementary Material online).
Demographic History and Gene Flow
The phylogeny of sighthounds could be due to admixture between breeds and native dogs. To investigate the presence of migration events and their impact on phylogeny, we performed TreeMix analysis (supplementary fig. S6, Supplementary Material online). The results corroborated the patterns observed following analysis of PCA, structure, and phylogeny (fig. 1b). Gene flows between African dogs and modern wolves were identified (supplementary fig. S6, Supplementary Material online). To validate the gene flow detected by TreeMix, we used the R package admixr to further analyze D-statistics for all sighthounds and modern wolves (Petr et al. 2019). The analysis revealed that gene flow was not widespread across all sighthounds but rather primarily observed in Shaanxi sighthounds, African native sighthounds, and Taigan (|Z| > 3.00) (fig. 2b).
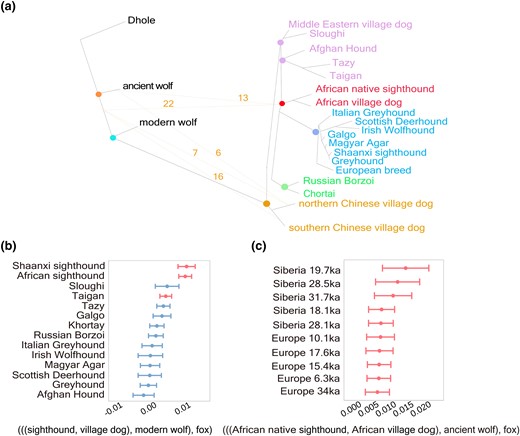
Gene flow between sighthounds and ancient wolves. (a) TreeMix simulation diagram showing gene flow between sighthounds and each ancient wolf. Lines with arrows indicate gene flow and direction, and numbers on the lines represent the frequency of these events in the TreeMix analysis between the 67 ancient wolves and sighthounds. (b) Outgroup D-statistics depicting phylogeny analysis; red bars indicate significant differences from nonadmixed part of sighthounds and modern wolves. (c) D-statistics comparing African dogs to Eurasia ancient wolves.
As gray wolves are not naturally found in Africa (Rueness et al. 2011; Koepfli et al. 2015; Viranta et al. 2017; Gopalakrishnan et al. 2018), it is plausible that African native sighthounds have retained some genetic components from ancient wolves. To investigate this possibility, we obtained whole-genome data from 67 published ancient wolves from Europe, Siberia, and northwestern North America (Bergstrom et al. 2022). Each ancient wolf genome was included in TreeMix analysis (supplementary fig. S7, Supplementary Material online). The results identified two distinct patterns: 1) The phylogenetic tree reflected the patterns observed in our previous findings, indicating gene flow from ancient wolves to African native sighthounds and Chinese village dogs (fig. 2a); 2) Middle Eastern village dogs were located at the root of the African dog lineage, with gene flow detected from ancient wolves to the ancestors of the Middle Eastern village dogs, African dogs, and Chinese village dogs (fig. 2b and supplementary fig. S8, Supplementary Material online). We further examined gene flow between all sighthounds and ancient wolves (supplementary fig. S9, Supplementary Material online) by using D-statistics. The results supported the occurrence of gene flow between African native sighthounds and ancient wolves (|Z| > 3.05; fig. 2c and supplementary fig. S10, Supplementary Material online). Furthermore, analysis based on D (ancient wolves, modern wolves, African native sighthounds, and foxes) revealed gene flow was detected between ancient wolves and African native sighthounds, rather than modern wolves (|Z| > 3.19; fig. 2c and supplementary fig. S11, Supplementary Material online).
We also performed Patterson's f3-test and D-statistics to examine admixture and gene flow among sighthound populations (Reich et al. 2009). The f3-test results revealed that African native sighthounds formed from the admixture of African village dogs and the other four sighthound populations (Z ≤ −7.41; supplementary table S3, Supplementary Material online). This hybridization likely contributed to the closer genetic proximity of African native sighthounds and other dogs being compared with African village dogs, as observed in the PCA results, and this is also a possible reason why African village dogs did not be the background branch of African native sighthounds in phylogenetic tree. D-statistics revealed gene flow between African native sighthounds and other sighthounds (Z ≤ −23.30; supplementary table S4, Supplementary Material online). Also, European sighthounds were detected to have gene flows with other sighthound populations (Z ≤ −4.72; supplementary table S4, Supplementary Material online). Moreover, we evaluated the genetic components of the three sighthounds by using RFMix (Maples et al. 2013) (fig. 1c). We found that African native sighthounds contained 16.93% bloodline from Middle Eastern sighthounds and 10.46% from European sighthounds (supplementary table S5, Supplementary Material online). There was 11.01% introgression into European sighthounds from Borzoi (supplementary table S6, Supplementary Material online). Additionally, Middle Eastern sighthounds contained 14.29% bloodline from European sighthounds, 8.08% bloodline from African native sighthounds, and 6.35% bloodline from Borzoi (supplementary table S7, Supplementary Material online).
To identify the ancestral sources of sighthounds, we used the qpWave test in ADMIXTOOLS (Patterson et al. 2012). Results indicated the presence of at least five genetic streams contributing to the sighthounds (rank = 4, P = 1). (supplementary table S8, Supplementary Material online). To further validate these findings, we used fastsimcoal2 (Excoffier et al. 2013) to infer the demographic history of canine lineages based on two-dimensional site frequency spectra. We simulated four single sighthound origination models, including Africa-origination, Europe-origination, Middle-East-origination, and Russia-origination, as well as a multiple origination model incorporating gene flow based on RFMix measurements. The highest median likelihood occurred in the multiple origination models, supporting the topological structure of the neighbor-joining tree and suggesting unique origins in different sighthound groups (supplementary fig. S12, Supplementary Material online).
We also investigated identical by descent (IBD) sharing among the different populations (supplementary fig. S13, Supplementary Material online). In the 1,453 IBD segments detected using Refined IBD (Browning and Browning 2013), the highest level of IBD sharing was observed between the Borzoi and Chortai breeds, accounting for 3.37% of the total IBD segments, with an average IBD segments length of 524,975 bp. Interestingly, no IBD segments shared by all sighthound breeds were found.
Artificial Selection in Sighthounds
It is interesting to observe that sighthounds from diverse origins share similar phenotypes, behaviors, and physiological traits, implying the selection of different genes from the same pathway. To unravel the genomic basis underlying these shared complex traits of sighthounds, we employed three approaches, that is, F-statistic (Fst), cross-population extended haplotype homozygosity (XP-EHH), and cross-population number of segregating sites by length (XP-nSL), to identify genomic regions displaying high population differentiation between sighthounds and their sympatric village dogs. Genomic regions exhibiting the top 1% of Fst values and empirical P < 0.01 values in both XP-EHH and XP-nSL analyses were selected for gene annotation. Genes that passed all three thresholds were selected as candidate genes. In total, we identified 17 positively selected genes (PSGs) in African sighthounds, 27 PSGs in European sighthounds, and 54 PSGs in Middle Eastern sighthounds. To differentiate between signals of credible positive selection and those influenced by other factors that can cause false positive, we conducted sequence simulation based on the best model generated using fastsimcoal2. Comparing the candidate PSGs with the simulated sequence, we observed an obvious difference (supplementary fig. S14, Supplementary Material online). Given the absence of common PSGs across the three sighthound populations, we attempted to identify shared biological pathways and functions within the sighthound populations. This approach was utilized to overcome the heterogeneity among the populations and identify common biological processes from different PSGs (fig. 3 and supplementary tables S9, and S10, Supplementary Material online). After excluding three novel genes, a total of 95 genes were pooled, demonstrating significant enrichment in the top 16 gene ontology (GO) summary terms (−log P > 2.01; supplementary table S10, Supplementary Material online), with contributions from different populations. Among the top 16 terms, ten contained PSGs from African, European, and Middle Eastern populations. To visualize the relationships among these terms, a network was constructed based on their category clustering (supplementary fig. S15a, Supplementary Material online) and the contribution of genes from each population (supplementary fig. S15b, Supplementary Material online).
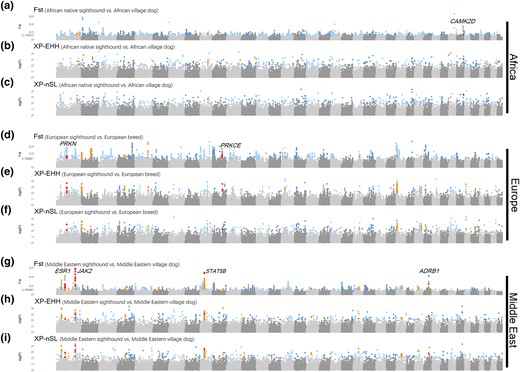
Positive selection in sighthounds from Africa, Europe, and Middle East. (a–c) Genome-wide original Fst and empirical P values of XP-EHH and XP-nSL for African native sighthound. We highlighted candidate genes that above the cutoff in all three methods, and genes mentioned in the main text are labeled. (d–f) Genome-wide original Fst and empirical P values of XP-EHH and XP-nSL for European sighthound. (g–i) Genome-wide original Fst and empirical P values of XP-EHH and XP-nSL for Middle Eastern sighthounds.
The pooled PSGs were enriched in various categories associated with the hematological and nervous systems, including positive regulation of blood pressure (GO: 0045777) and axon development (GO: 0061564). Notably, the heart-related summary term “Regulation of release of sequestered calcium ion into cytosol” (GO: 0051279) has member terms “regulation of heart rate” (GO: 0002027), “regulation of heart contraction” (GO: 0008016), and “heart process” (GO: 0003015), included PSGs from three population. Within this summary term, two notable PSGs from the Middle Eastern were identified, that is, estrogen receptor 1 (ESR1) and Janus kinase 2 (JAK2). ESR1 is a pleiotropic gene associated with bone mineral density and osteoporosis (Becherini et al. 2000; Ongphiphadhanakul et al. 2000; Albagha et al. 2001; Weise et al. 2001; Kemp et al. 2017; Montazeri-Najafabady et al. 2019), body fat distribution (Tchernof et al. 2000; Gu et al. 2009), and long legs in dogs (Plassais et al. 2019). JAK2 is involved in hematopoiesis (Perner et al. 2019) and enhances muscle repair and regeneration when inhibited (Price et al. 2014). In addition to ESR1 and JAK2, another PSG enriched in GO: 0051279 from the Middle Eastern population was β1-adrenergic receptor (ADRB1), which constitutes the majority of cardiac β-adrenergic receptors (Caro and Schnös 1966) and controls catecholamine-dependent changes in heart rate, force, and contracted speed of the heart by the second messenger cyclic adenosine monophosphate (cAMP) (Engelhardt et al. 1999; Nikolaev et al. 2006; Gorelik et al. 2013).
PSGs identified in European sighthounds and enriched in GO: 0051279 included Parkin RBR E3 Ubiquitin Protein Ligase (PRKN) and protein kinase C-epsilon (PRKCE). Notably, PRKN contains skeletal muscle/myoblast-specific enhancer chromatin, a myoblast-specific antisense RNA, and brain-specific enhancer chromatin (Ehrlich et al. 2022). In addition, PRKCE is an isoform of the large protein kinase C (PKC) family of enzymes that regulates cardiac muscle contraction, as well as cardiac cell energy production and metabolism (Scruggs et al. 2016).
For the same term, the African native sighthounds exhibited the presence of calcium/calmodulin-dependent protein kinase 2 delta (CAMK2D) enriched in “regulation of muscle cell apoptotic process” (GO: 0010660). CAMK2D is an isoform of calcium/calmodulin-dependent protein kinase 2 (CAMK2), which shows increased expression in skeletal muscle during exercise (Rose et al. 2006) and influences cardiac function (Zhang et al. 2003). The protein encoded by CAMK2D plays a functional role in regulating heart contractions (Kushnir et al. 2010).
T > C Mutation at chr1: g.42,177,149 Reduces ESR1 Expression
Previous studies have indicated the core role of ESR1 in the breeding process of sighthounds (Plassais et al. 2019; Morrill et al. 2022). To identify significantly different sites between sighthound and nonsighthound dogs, we compared the allele frequency of ESR1 SNPs using the chi-square test. Based on this analysis, we identified a SNP (chr1: g.42,177,149 T > C of CanFam3.1) in ESR1 with significantly higher allele frequency (−log P > 15.65) in sighthounds (allele frequency = 51.18%) than in other dogs (allele frequency = 7.28%). We predicted its possible transcription factor (TF) binding sites using the open-access JASPAR database (Portales-Casamar et al. 2010) and identified that signal transducer and activator of transcription 5 (STAT5A) binds to a specific site in ESR1 (fig. 4a).
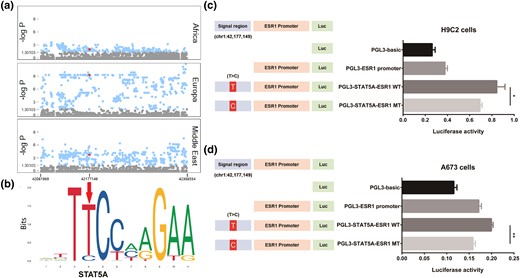
Luciferase reporter on chr1: g.42,177,149 T > C of ESR1. (a) Fisher's exact test of site allele frequency in ESR1 region of each comparison, with chr1: g.42,177,149 T > C (red dot) is beyond the significance level of 0.01 (−log P > 1.97) in all comparisons. (b) Sequence logo of the Stat5a-binding site on ESR1 provided by JASPAR (https://jaspar.genereg.net/matrix/MA0519.1/); arrowhead points to chr1: g.42,177,149 T > C mutation position. (c) Luciferase reporter was applied to H9C2 cells, and ESR1 expression in wild type (T) was significantly higher (t-test P = 2.56 × 10⁻²) than that in mutation type (C). (d) Luciferase reporter was applied to A673 cells, and ESR1 expression in wild type (T) was significantly higher (t-test P = 2.22 × 10⁻⁶) than that in mutation type (C).
To test whether the T > C mutation at chr1: g.42,177,149 would regulate ESR1 gene expression by affecting Stat5a binding, we generated plasmids containing the Stat5a binding region with wild type and mutation type and predicted ESR1 promoter, and transient transfection was performed in H9C2 and A673 cell lines. After transfection of the H9C2 cell line (fig. 4b), the cloned region containing the predicted ESR1 promoter (PGL3-ESR1 promoter) showed 49.92% higher luciferase expression than the pGL3-basic plasmid, demonstrating the activity of the predicted ESR1 promoter. Moreover, PGL3-STAT5A-ESR1 showed higher transcription activity than the PGL3-ESR1 promoter when the 300-bp region near the signal site was inserted, and PGL3-STAT5A-ESR1 MT (chr1: g.42,177,149, C) showed 9.83% lower luciferase activity than PGL3-STAT5A-ESR1 WT (chr1: g.42,177,149, T) (P = 2.56 × 10⁻²; fig. 4c). Similar results were found after transfection of the A673 cells (fig. 4d), further confirming the promoter activity of the predicted ESR1 promoter. PGL3-STAT5A-ESR1 MT (chr1: g.42,177,149, C) showed 20.51% lower promoter activity than PGL3-STAT5A-ESR1 WT (chr1: g.42,177,149, T) (P = 2.22 × 10⁻⁶, fig. 4d). These results indicate that the T > C mutation at chr1: g.42,177,149 reduced ESR1 expression by affecting its binding with STAT5A.
T > A Mutation at chr1: g.93,277,007 Reduces JAK2 Expression
Distinct haplotype patterns were observed between sighthounds and nonsighthounds were found (supplementary fig. S16, Supplementary Material online) on JAK2. We identified a significant SNP (chr1: g.93,277,007 T > A of CanFam3.1) with a markedly higher allele frequency (−log P > 15.65) in sighthounds (allele frequency = 60.61%) than in other dogs (allele frequency = 3.23%). This significance was maintained in both European and Middle Eastern sighthounds (fig. 5a). According to the predictions from JASPAR (Portales-Casamar et al. 2010) SRY-box transcription factor 5 (SOX5) was predicted to bind the site on JAK2 (fig. 5b).
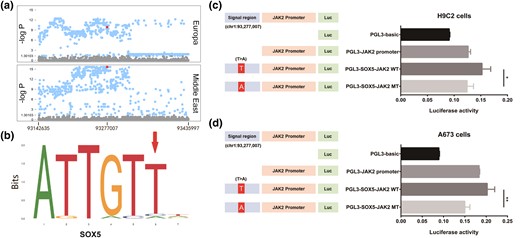
Luciferase reporter on chr1 93,277,007 T > A of JAK2. (a) Fisher's exact test on-site allele frequency in the JAK2 region of each comparison, with chr1 93,277,007 T > A (red dot) is beyond the significance level of 0.001 (−log P > 9.88) in all comparisons. (b) Sequence logo of the Sox5-binding site on JAK2 provided by JASPAR (https://jaspar.genereg.net/matrix/MA0087.1/). (c) Luciferase reporter was applied to H9C2 cells, and JAK2 expression in wild type (T) was significantly higher (t-test P = 2.94 × 10⁻²) than that in mutation type (A). (d) Luciferase reporter was applied to A673 cells, and JAK2 expression in wild type (T) was significantly higher (t-test P = 4.86 × 10⁻³) than that in mutation type (A).
Transient transfection was also performed in the H9C2 and A673 cell lines (fig. 5b). The cloned region containing the predicted JAK2 promoter (PGL3-JAK2 promoter) showed higher luciferase expression than the pGL3-basic plasmid, demonstrating the activity of the predicted JAK2 promoter. Moreover, PGL3-SOX5-JAK2 MT (chr1: g.93,277,007, A) showed lower promoter activity than PGL3-SOX5-JAK2 WT (chr1: g.93,277,007, T) in the H9C2 (P = 2.94 × 10⁻²; fig. 5c) and A673 (P = 4.86 × 10⁻³; fig. 5d). These results indicate that the T > A mutation at chr1: g.93,277,007 reduced the expression of JAK2 by affecting its binding with SOX5.
Discussion
Based on genomic analysis, we investigated the origin and artificial selection of sighthounds. Through techniques such as PCA, phylogenetic tree analysis, and population structure analysis, we determined that sighthounds were independently bred in Africa, Europe, and the Middle East, with admixture events. Furthermore, we explored positive selection signals in the three populations. Although the specific PSGs varied among the three groups, GO analysis of pooled PSGs revealed significant enrichment in pathways related to estrogen signaling, calcium transport, melanocortin receptor activity, and other biological processes primarily involved in bone mineral density, muscle repair and regeneration, and heart function. These findings shed light on the physiological mechanisms contributing to the swiftness, strength, and unique appearance of sighthounds.
Multiple Origins of Sighthound Breeds
Genomic evidence suggests that the switch from hunting to agricultural pursuits may have initiated early breed formation; this could occur in multiple regions (Parker et al. 2017). Ancient dog breeds, such as Greyhounds and mastiffs, may have emerged during periods when human migration was challenging (Wayne and Ostrander 1999). Despite their ancient divergence, sighthounds share not only physical characteristics but also specific internal traits, such as high blood pressure (Bodey and Michell 1996) and cardiac properties (Locatelli et al. 2016). Based on these observations, three hypotheses can be proposed regarding the origin of sighthounds: 1) Sighthounds from different regions have no ancestral relationship but exhibit convergent selection, resulting in a similar phenotype; 2) sighthounds have a single common origin with shared ancestry, with their distinct genetic histories resulting in differentiated populations; and 3) sighthounds derived independently, with shared gene flow, rather than convergent selection, resulting in a similar phenotype. Our results showed that 128 sighthounds were geographically clustered together with African, European, and Middle Eastern village dogs based on the neighbor-joining phylogenic tree, PCA, and population structure analyses (fig. 1). The QpWave test and the different model tests support the multiple origin hypotheses. Phylogenic tree with gene flows by TreeMix, which included 31 modern and ancient wolves spanning from 5.2 to 93.6 kilo years ago (kya), corroborated the findings of the neighbor-joining tree (fig. 2a). Notably, no gene flow was detected among sighthound breeds in the TreeMix analysis, and there were no shared IBD segments observed across all sighthounds based on Refined IBD analysis. These findings provide additional support for the independent breeding of sighthounds in Africa, Europe, and the Middle East. While not all sighthound breeds are extremely ancient, it is possible that sighthounds, which originated before ancient human trade networks, had multiple origins due to extensive global interactions. Consequently, there may be no overlap in PSGs among the scattered sighthound populations across the three continents. However, the RFMix analysis results detected noticeable gene flow among sighthounds, indicating that the single origin hypothesis cannot be entirely ruled out. Repeated ancient backcrossing between foreign sighthounds and indigenous dogs can yield similar results to the close genetic relationships observed in the RFMix and phylogenetic trees.
Analyses using TreeMix and D-statistics revealed gene flow between African native sighthounds and ancient Eurasian wolves (fig. 2c and supplementary fig. S11, Supplementary Material online), it suggests a potential interaction between gray wolf outside of Africa and African native sighthound populations during sighthound's breeding process. This gene flow may explain the abnormal position of African native sighthounds in both the PCA and phylogenetic tree. Interestingly, the characteristics of African native sighthounds, such as medium size, well-muscled physique, and exceptional running abilities, align with descriptions of “Africanis,” an original African dog lineage believed to have ancient origins dating back at least 7 000 years, with an ancestry traced to prehistoric wolf packs in Arabia and India (Gallant 2002).
Genes under Positive Selection Contribute to Sighthound Phenotype
The GO terms enriched in the current study are consistent with the specific traits and abilities observed in sighthounds, such as their focusing ability, specialized cardiovascular fitness, and sport performance. In total, 64 distinct GO terms were enriched in the PSGs identified from the African, European, and Middle Eastern populations. These enriched categories, such as “axon development” (GO: 0061564) and “regulation of heart rate” (GO: 0002027), shed light on the fundamental biological processes that have contributed to the convergent evolution of functional syndromes in sighthounds. The enriched terms “heart development” (GO: 0007507) and “cell–cell adhesion” (GO: 0098609) have been reported in Saluki, a sighthound breed from the Middle East, using indels, copy number variation (CNV), and other structural variant regions (Amiri Ghanatsaman et al. 2020). Furthermore, our analysis revealed the selection of 13 members of the keratin family in Middle Eastern sighthounds, while other keratin family members were reported to be selected in Shaanxi sighthounds (Yang et al. 2019), which were grouped with European sighthound in our study. These findings suggest that phenotypes observed in sighthounds are linked to the complex GO network involving 64 pathways enriched in PSGs from different populations. Mutations in different genes involved in the same biology function categories may result in similar effects at the molecular level (Arendt and Reznick 2008; Wang et al. 2010; Losos 2011), indicating that breed development driven by artificial selection can affect the function of the same pathways and give rise to similar phenotypes, despite their independent breed histories.
ESR1 is a multifunctional gene (Cooke et al. 2017) that affects reproductive capacity (Muñoz et al. 2007), morphogenesis (Prins et al. 2006), breast cancer (Robinson et al. 2013), brain function (Rettberg et al. 2014), and behavior (Lee , Kim, et al. 2014; Pinsonneault et al. 2017), bone development (Weise et al. 2001; Khalid and Krum 2016), cardiovascular health (Zeng et al. 2016), and fat metabolism (Heine et al. 2000). Here, ESR1 was downregulated with a SNP (chr1: g.42,177,149 T > C), which may impact elongation of limb bones (Plassais et al. 2019) and contribute to the slender body observed in sighthounds. In addition, full deletion of ESR1 has been shown to increase bone mineral density in mice (Sims et al. 2003), with lower expression in skeletal muscle related to lean tissue and rapid growth (Voillet et al. 2018).
In our study, we observed a shared JAK2 haplotype among all sighthounds (supplementary fig. S12, Supplementary Material online). However, similar to ESR1, the effects of JAK2 can vary widely. Previous GWAS has linked JAK2 to herding behavior, which may play a role in suppressing aggressive behavior toward livestock (Shan et al. 2021), suggesting that JAK2 may affect the hunting behavior of sighthounds. Moreover, another GO term including JAK2 was enriched by PSGs from different populations and related to exercise: regulation of heart contraction (GO: 0008016). Special cardiovascular characteristic of sighthounds has been reported to be built by artificial selection (Cox et al. 1976a, 1976b). Also, STAT5B is under positive selection in Middle Eastern sighthounds. The JAK/STAT pathway regulates myogenic differentiation (Jang and Baik 2013), while the JAK2/STAT5 signaling pathway is related to hematopoietic function (Lim et al. 2011). This may contribute to sighthounds having a higher red blood cells count, as found in Greyhounds (Zaldivar-Lopez et al. 2011), providing the necessary energy for sprinting (Ilkiw et al. 1989; Rose and Bloomberg 1989). The changes of JAK2 observed in sighthounds likely have complex effects, but combined with the downregulation of JAK2, we inferred that this mutation protects blood vessels from cardiovascular damage (Kirabo et al. 2011; Zhang et al. 2020). Although experiments confirmed that the ESR1 and JAK2 mutations reduced their expression in vitro, their specific effects on phenotype remain unclear due to their pleiotropic nature and complex genome context in vivo.
Our study focused on sighthounds, an ancient group of dogs to investigate their origin and the genetic basis of their physiological characteristics. These traits, which were likely developed through early breeding efforts, would have facilitated hunting for primitive human populations and eased the transition from hunting-gathering to agriculture and animal husbandry. The widespread need for hunting in early human societies may explain the multiple origins of sighthounds, with similar selection pressure leading to convergent evolution. Our research revealed genes associated with the exceptional athletic performance and specialized phenotypes of sighthounds, shedding light on the genetic basis of their remarkable abilities.
Materials and Methods
Sample Collection
Samples from sighthounds were collected from 13 countries of potential sighthound origins (fig. 1a), with a focus on Asian regions as well as Europe and Africa. The samples included frozen blood or tissue stored in 95% alcohol. To understand the population history and identify PSGs, village dogs from Asia and Africa were also collected. Due to the scarcity of village dogs in Europe, other breeding dogs were selected as substitutes.
Whole-Genome Sequencing and SNP Calling
Samples were sequenced using the Illumina WGS workflow, and mapping was performed using the classical BWA-MEM-Samtools-PicardTools (Li 2013) pipeline with the Canfam 3.1 reference. We used GATK gears to yield an analysis-ready SNP data set with the following filter parameters:
QD < 2.0 || FS > 60.0 || MQ < 40.0 || QUAL < 50.0 || MQRankSum < −12.5 || ReadPosRankSum < −8.0 || MQ0 ≥ 4 || ([MQ0/{1.0 * DP}] > 0.1) QD < 2.0 || FS > 200.0 || ReadPosRankSum < −20.0. SNPs on autosomes were used for subsequent workflow.
Population Structure and Phylogeny
We used Genome-wide Complex Trait Analysis (GCTA) (Yang et al. 2011) to perform PCA with whole-genome next-generation sequencing (NGS) data after filtration. A neighbor-joining tree was constructed using MEGA (Tamura et al. 2007). Structure analysis was conducted using ADMIXTURE (Alexander et al. 2009), with the same SNPs used for PCA.
For each population, θπ was calculated using VCFtools (v0.1.13) with a 40-kb window (Danecek et al. 2011), and the Wilcoxon rank sum test was performed using the θπ values with the built-in function in R.
We utilized ADMIXTOOLS (Reich et al. 2009) to conduct D-statistics and f3-tests. In the D-statistics test, we included the red fox (Vulpes vulpes) (Auton et al. 2013) as an outgroup, following the format D (Outgroup [P1 {P2, P3}]).
Difference in Diversity, ROH, and Inbreeding Coefficients between Native Sighthounds and Sighthounds Recognized in FCI or AKC
We categorized the sighthounds into different breeds and retained ten breeds that with a minimum of three samples each. To eliminate possible bias from different sample size in each group, we randomly select three samples from each breed for analyses of diversity, ROH, and inbreeding coefficient. Diversity was analyzed using VCFtools with a 40-kb window.
The ROH of sighthounds was calculated using PLINK v1.9 with the following filter parameters: –homozyg –homozyg-density 50 –homozyg-gap 1000 –homozyg-kb 200 –homozyg-window-snp 100 –homozyg-window-het 5.
The inbreeding coefficient (FROH) was determined by calculating the proportion of the genome covered by ROH. This was achieved by dividing the total length of ROH by the total autosomal length of the genome (2,203,764,842 bp).
IBD Mapping
We use the PLINK v1.9 with option “–genome” to identify the paired combination of individuals that PI_HAT > 0.2 and Z1 > 0.9, individuals in these pairs are removed for high kinship correlation. To detect shared IBD segments between pairs of individuals, we employed the stand-alone program Refined IBD (refined-ibd.17Jan20.102.jar) (Browning and Browning 2013). Analysis was conducted using default parameters; the physical map used in the analysis was based on Canfam3.1.
TreeMix between Sighthounds and Ancient Wolves
We downloaded a genomic data set comprised of 67 published ancient wolves and an additional genome sequence of a 70-ka dhole as the outgroup (Bergstrom et al. 2020). We then used snpAD to jointly estimate error rates and genotype frequency (Prüfer 2018). The ancient genome data set was combined with the sighthound data set using BCFtools (v1.8) (Danecek et al. 2021), with only shared genomic sites retained. To avoid the effects of ancient DNA damage, we restricted the D-statistics and TreeMix analyses into 7,075,777 transversion sites.
The sighthounds were divided into 14 groups based on breed information. Each ancient wolf was then separately added to the data set for TreeMix analysis, with SNPs detected in both sighthounds and ancient wolves used.
Gene Flow between Sighthounds and Modern Wolves
D-statistics was carried out based on breed to determine potential gene flow between sighthounds and modern wolf populations. Sighthounds and nonsighthounds from the same geographical location were pairwise analyzed to calculation D ([{sighthounds, village dog}, modern wolf], Fox) using the R package admixr.
Gene Flow between Sighthounds and Ancient Wolves
Based on the above data set, we calculated D ([{sighthound, village dog}, ancient wolf], Fox) for each ancient wolf and each sighthound breed using the R package admixr. With the same method, we calculated D ([{ancient wolf, modern wolf}, sighthound], Fox) to determine potential gene flow between sighthounds and ancient wolves against the background of modern wolves. To minimize false positives affected by ancient DNA damage, only transversion sites were input to test gene flow.
Demographic Model Testing
Based on population structure analysis, we grouped the samples into ten populations (wolf, Southeast Asian village dog, African village dog, African sighthound, Middle Eastern sighthound, Middle Eastern village dog, European breed dog, European sighthound, and Russian sighthound including Borzoi and Chortai) to generate a site frequency spectrum. After removing the sites with a high missing ratio (>80%), we thinned the data by retaining one SNP within 10 kb to reduce the effect of LD. Based on the fox genome (Auton et al. 2013), SNPs were unfolded as ancestral or derived. The site frequency spectrum was then calculated using easySFS (https://github.com/isaacovercast/easySFS). Subsequently, we determined the demographic history of dogs and wolves using fastsimcoal2 (v 3.7.9) (Excoffier et al. 2013). We set the nuclear mutation rate to 4 × 10⁻⁹ per site per generation (Raghavan et al. 2014; Pendleton et al. 2018) and assumed a generation time of 3 years. We then performed 50 replicate runs for each model and each replicate using 100,000 coalescent simulations and ran 40 optimization cycles. The best-fit model was selected based on the highest mean MaxEstLhood.
Coalescent Simulation
Parameters outputted by the best run of fastsimcoal2 (v 3.7.9), which has the highest MaxObsLhood, were adjusted to adjust ms program (Hudson 2002). We then use ms to simulate 200-kb sequence 20,000 times. The average number of SNPs on a 200-kb sequence was calculated as the product of SNP density and sequence length, that is, 26,547,340 SNPs/2,410,976,875 bp × 200,000 bp ≈ 2,202 SNPs. Therefore, a 200-kb sequence for every haplotypes involved in the selection analysis was simulated 20,000 times using the following script:
ms 522 1 -t 64 -s 2202 -I 10 62 66 24 102 30 30 50 86 26 46 -n 1 19.9724 -n 2 5.37545 -n 3 2.5428 -n 4 1.2108 -n 5 3.9399 -n 6 1.65705 -n 7 0.07 -n 8 4.90885 -n 9 1.42355 -n 10 2.109 -m 4 3 6078.1274 -m 6 4 3533.1232 -m 7 4 2603.9501 -m 6 5 4726.7923 -m 4 6 2459.0507 -m 4 7 9609.5474 -m 6 7 5839.3261 -m 4 9 1094.5907 -m 7 9 1369.8888 -m 4 10 2487.3236 -m 7 10 491.7643 -en 0.068687 10 0.249762 -en 0.068687 9 0.282875 -en 0.22578 8 0.765 -en 0.112096 7 0.0140375 -en 0.0129698 6 0.224675 -en 0.45937 5 0.399487 -en 0.001852832 4 0.191812 -en 0.45937 3 0.955812 -en 0.91053 2 0.085475 -eg 0.0440709 10 0.00134835 -eg 0.0026997 9 0.00406776 -eg 0.178666 8 -0.000080321 -eg 0.0075436 7 0.0651426 -eg 0.012969 6 0.00236844 -eg 0.012969 5 0.00229158 -eg 0.00185283 4 -0.00593132 -eg 0.00185283 3 -0.0374482 -eg 0.8867125 2 -0.000022149 -eg 0.99999 1 -0.000012412 -ej 0.001853 3 4 -ej 0.01297 5 6 -ej 0.068687 10 9 -ej 0.112096 7 9 -ej 0.225781 8 9 -ej 0.45937 4 6 -ej 0.478692 6 9 -ej 0.910535 2 9 -ej 0.99999 9 1 -p 6.
Population Differentiation
Fst analysis was performed using VCFtools (v0.1.13) with a 40-kb window and 20-kb step (Danecek et al. 2011). We selected the top 1% of regions for gene annotation. We calculated XP-EHH and XP-nSL between sighthounds and their sympatric indigenous dogs using selscan (v1.3.0) (Sabeti et al. 2007; Szpiech and Hernandez 2014). The empirical P values of XP-EHH and XP-nSL were calculated following the method as previously studied (Lee, Abecasis, et al. 2014): 1) The genome was divided into nonoverlapping 50-kb windows, and the maximum XP-EHH or XP-nSL score of all SNVs within each window was used as a summary statistic. 2) Genomic windows were binned based on the number of SNVs they contained (in increments of 200 SNVs), with all windows containing 800 or more SNVs combined into a single bin. 3) Within each bin, the empirical P value was calculated for each window (i), representing the fraction of windows within the bin that have a statistic greater than that of window (i), providing a measure of statistical significance. Genomic regions with P < 0.01 were considered for gene annotation. Gene sets were downloaded from Ensembl (version CanFam3.1.104). Allele frequency differences were tested using Fisher's exact test.
Go Enrichment Analysis
After obtaining overlapping PSGs from the three selection signal tests (Fst, XPEHH, and XP-nSL) in each population, we performed GO enrichment at Metascape (Zhou et al. 2019) (http://metascape.org/gp/index.html) with a pooled gene set combining all PSGs from the three comparisons. Using default pathway and process enrichment settings (Min Overlap = 3, P Value Cutoff = 0.01, Min Enrichment = 1.5), four items were calculated (GO molecular functions, GO biological processes, KEGG pathway, and GO cellular components).
Experiment
Cell Culture
H9c2 rat heart myocytes and A673 human muscle Ewing's sarcoma cell lines were obtained from the Chinese Academy of Sciences, Typical Culture Preservation Committee Cell Bank (Shanghai, China). The cells were routinely grown in Dulbecco's Modified Eagle's Medium (DMEM) (Thermo Fisher Scientific, Waltham, MA, USA) with 10% fetal bovine serum (FBS) (Thermo Fisher Scientific). Cells were cultured at 37 °C in 5% CO2 in a humidified incubator (Thermo Fisher Scientific).
Luciferase Reporter Assay
To determine the biological function of the selected signal site in the ESR1 gene, which binds to STAT5A TF, the 300-bp region near the signal site and predicted ESR1 promoter were selected to insert PGL3-basic and construct an expression vector (Tsingke Biological Technology, Beijing, China). An expression vector of the JAK2 promoter and TF SOX5-binding region was also constructed. All plasmids used for reporter assays were confirmed by sequencing. Primer sequences are available in supplementary table S11, Supplementary Material online.
For reporter assays, constructs were transfected into H9c2 and A673 cells using ViaFect transfection reagent (Promega, Madison, WI, USA), and luciferase expression was normalized to Renilla luciferase expression. After 24 h of transfection, cells were harvested, and luciferase activity was measured using the Dual-Luciferase Reporter Assay System (Promega) according to the manufacturer's protocol. Luminescence signals were captured in a Glomax 96 Microplate Luminometer (Promega). Data represent at least six independent experiments. Student's two-tailed t-test was used to determine statistical significance, and the null hypothesis was rejected at P > 0.05.
Supplementary Material
Supplementary data are available at Molecular Biology and Evolution online.
Acknowledgments
The authors are grateful to all volunteers involved in samplings. They thank Yao-Ming Li for their assistance in sample collection. This work was supported by the Spring City Plan: High-Level Talent Promotion and Training Project of Kunming (2022SCP001), National Natural Science Foundation of China (32000298 and 61621003), National Key R&D Program of China (2019YFA0707101 and 2021ZD0203903), Key Research and Development Program of Yunnan Province (202203AC100010), and Key Research Program of Frontier Sciences of CAS (ZDBS-LY-SM011, QYZDB-SSW-SYS008), Jane and Aatos Erkko Foundation, and Agria och SKK Forskningsfond för sällskapsdjur. Y.H.L. and G.D.W. were supported by the Youth Innovation Promotion Association, Chinese Academy of Sciences. This work was also supported by the Animal Branch of the Germplasm Bank of Wild Species, Chinese Academy of Sciences (Large Research Infrastructure Funding).
Author Contributions
Y.-P.Z., G.-D.W., and P.S. supervised and designed the research. Y.-H.L., M.-T.D., and W.-L.L. analyzed the data. J.-X.L., X.Z.H., and G.L.X. performed functional assay. A.C.A., M.-S.P., A.E., Z.A.G., S.C.O., O.J.S., W.-W.Z., C.S., W.-K.Y., M.J.K., H.L., and A.D.P. provided the blood samples of canines. W.-L.L. carried out data submission. A.C.A., M.-S.P., X.Z.H., Z.A.G., A.E., A.D.P., P.S., G.-D.W., Y.-P.Z., and P.M.D. helped perform analysis with constructive discussions. Y.H.L., M.T.D., W.-L.L., and J.-X.L. wrote the manuscript. A.-E., A.D.P, Y.-P.Z., G.-D.W., and P.S. revised the manuscript.
Ethics Approval
This work was approved by the Institutional Animal Care and Use Committee (Kunming Institute of Zoology, approval ID: SMKX-20160805-118), and blood samples were collected under the permission of the County Administrative Board of Southern Finland (ESAVI/7482/04.10.07/2015).
Data Availability
The raw sequence data from this study have been submitted to the GSA (http://gsa.big.ac.cn/) under accession PRJCA001011.
References
Author notes
Wu-Lue Li, Yan-Hu Liu, Jin-Xiu Li and Meng-Ting Ding contributed equally to this work.
Almaz A Aldashev passed away
