


Abstract
Understanding the drivers of speciation is fundamental in evolutionary biology, and recent studies highlight hybridization as an important evolutionary force. Using whole-genome sequencing data from 22 species of guenons (tribe Cercopithecini), one of the world's largest primate radiations, we show that rampant gene flow characterizes their evolutionary history and identify ancient hybridization across deeply divergent lineages that differ in ecology, morphology, and karyotypes. Some hybridization events resulted in mitochondrial introgression between distant lineages, likely facilitated by cointrogression of coadapted nuclear variants. Although the genomic landscapes of introgression were largely lineage specific, we found that genes with immune functions were overrepresented in introgressing regions, in line with adaptive introgression, whereas genes involved in pigmentation and morphology may contribute to reproductive isolation. In line with reports from other systems that hybridization might facilitate diversification, we find that some of the most species-rich guenon clades are of admixed origin. This study provides important insights into the prevalence, role, and outcomes of ancestral hybridization in a large mammalian radiation.
Introduction
Ancient hybridization has been reported in many organisms, including mammals (Taylor and Larson 2019). However, owing to their large genomes, studies of entire mammalian radiations, particularly among species-rich groups, are underrepresented (but see Gopalakrishnan et al. 2018; Chavez et al. 2022), and most cases focus on pairs of species (Taylor and Larson 2019). Yet, large radiations with lineages of different ages offer a unique opportunity to understand how increasing lineage divergence along a speciation continuum may impact the ability to hybridize and the outcome of hybridization events. As reproductive isolation accumulates with genetic distance (Coyne and Orr 2004), the impact and consequences of introgression may vary, as well as the mechanisms that allow for genomic incompatibilities to be overcome. Several studies have reported that introgression between divergent lineages may spark rapid speciation and adaptive radiations by introducing novel genetic variation (Meier et al. 2017; Marques et al. 2019; Svardal et al. 2020). Comprehensive genomic datasets from species-rich radiations offer unique possibilities to study the interplay between hybridization, adaptation, and speciation.
Here, we focus on guenons (tribe Cercopithecini), a species-rich group of African primates that radiated over the last ca. 10 to 15 million years (MY) (Guschanski et al. 2013; Kuderna et al. 2023). With 89 taxa and over 30 distinct species (IUCN 2022), guenons represent one of the world's largest primate radiations, spanning a broad range of divergence times. Guenons are renowned for their ecological, morphological, and karyotypic diversity and have attracted the attention of evolutionary biologists and ecologists for decades (Dutrillaux et al. 1988; Glenn and Cords 2002; Grubb et al. 2003; Enstam and Isbell 2007; Moulin et al. 2008). Yet, despite possessing multiple characteristics that act as reproductive barriers in other study systems, guenons readily hybridize, even across deep evolutionary distances (Detwiler et al. 2005; de Jong and Butynski 2010; Detwiler 2019). For example, Detwiler (2019) reports viable and at least partially fertile hybrids between Cercopithecus mitis and Cercopithecus ascanius, 2 species that diverged ca. 5 million years ago (MYA) (Kuderna et al. 2023) and differ in chromosome numbers. Genomic studies have also identified ancient gene flow in several guenon lineages (Svardal et al. 2017; van der Valk et al. 2020; Ayoola et al. 2021), but the extent and role of ancestral hybridization throughout the clade is unknown.
As such, guenons provide a highly informative system to study the evolution of reproductive isolation and speciation in the context of a large radiation. Specifically, we aim to (i) study genomic patterns of introgression and mechanisms that allow barriers to gene flow to be overcome at different evolutionary distances, (ii) investigate the repeatability of introgression landscapes along the speciation continuum and (iii) explore the functional role of introgressed regions and identify loci contributing to reproductive isolation.
Results
Dataset, Sequencing and Genotyping
We compiled a dataset of whole-genome sequences from 37 samples belonging to 24 primate species (supplementary table S1, Supplementary Material online; van der Valk et al. 2020; Ayoola et al. 2021; Kuderna et al. 2023). These included 22 guenon species from all 6 genera, Allenopithecus, Allochrocebus, Chlorocebus, Erythrocebus, Miopithecus, and Cercopithecus (Fig. 1A), which collectively show a high degree of sympatry throughout sub-Saharan Africa (Fig. 1B). The most species-rich genus, Cercopithecus, is commonly divided into 6 evolutionary distinct species groups: cephus, mitis, mona, neglectus, diana, and hamlyni (Grubb et al. 2003; Lo Bianco et al. 2017), all represented in our dataset. We also included 2 outgroup species: Macaca mulatta (rhesus macaque) and Cercocebus torquatus (red-capped mangabey). Average read mapping depth varied between 15.7 and 57.7 (median = 29.8). We called genotypes against the rhesus macaque reference genome (Mmul_10, GenBank: GCA_014858485.1) and after stringent filtering (Materials and Methods), we obtained 1.18 billion genotyped sites across the autosomes, 52 million sites on the X-chromosome, and 63,565 sites on the Y-chromosome. Of these, 140 and 4.2 million sites were biallelic single nucleotide polymorphisms (SNPs) on the autosomes and the X-chromosome, respectively. Additionally, we assembled and annotated the mitochondrial genomes (mtDNA) of all samples.
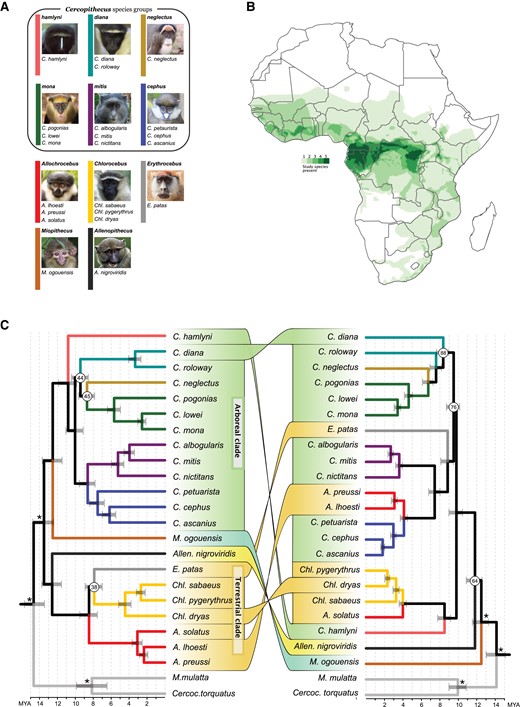
Taxonomy, species richness and mitonuclear discordances among guenons. (A) Taxonomic overview of the 22 species included in this study, shown according to genus and species groups. The color of the vertical bars corresponds to branch colors in (C). (B) Species richness/degree of sympatry for species included in this study, based on species distributions from IUCN (2022). (C) Astral species tree obtained from 3,346 autosomal gene trees (left) and maximum likelihood tree constructed with RaxML from complete mitochondrial genomes (right), with connectors highlighting phylogenetic discordances. Node annotations show branch quartet support (left) or bootstrap support (right), where this was <95%. Branches are colored based on genus/species groups as in (A). Tree topologies were estimated from all available samples (supplementary figs. S1 and S7, Supplementary Material online) and were subsequently pruned to a single sample per species prior to divergence date estimates with MCMCTree, applying fossil calibrations to the nodes annotated with asterisks. Nodes were rotated to aid visualization of mitonuclear discordances. Photo credit for (A): hamlyni: NRowe/alltheworldsprimates.org; diana, Chlorocebus: K. Guschanski; neglectus: M. D’haen; mona: S. Knauf; mitis: M. Mpongo & K. Detwiler; cephus: S. Crawford & K. Detwiler; Allochrocebus: T. Ukizintambara; Erythrocebus: T. Valkenburg; Miopithecus: P. Paixão; Allenopithecus: D. Sutherland.
Species Tree Inferences
We constructed a multispecies coalescence tree in ASTRAL (Zhang et al. 2018), using 3,346 independent autosomal gene trees, each representing a 25 kb genomic region sampled every 500 kb along the genome (Fig. 1C; supplementary fig. S1, Supplementary Material online; Materials and Methods). All genera, species groups and species were monophyletic with maximal local posterior probability (lpp) support (lpp = 1, supplementary fig. S1, Supplementary Material online). The tree topology was largely consistent with the recent primate phylogeny based on ultraconserved elements (UCE; Kuderna et al. 2023), except for the placement of the genus Erythrocebus and the diana species group. Both these discrepancies involve rapid diversifications with short internal branches and strong incomplete lineage sorting (ILS), as illustrated by a high degree of gene tree discordance around these nodes (normalized quartet score = 38% and 44%, respectively), which may be difficult to resolve using UCE loci due to their slow evolution (Bejerano et al. 2004).
We estimated divergence times on the ASTRAL topology by combining 4 independent MCMCTree runs (Yang 2007), which converged at highly similar node age estimates and jointly resulted in effective sample sizes (ESS) ≥ 285 for all nodes (supplementary fig. S2, Supplementary Material online). These analyses suggest that the guenons split from the Papionini tribe ca. 14.6 MYA (Fig. 1C; supplementary table S2, Supplementary Material online), followed by the first split within the guenons ca. 13.4 MYA, dividing them into 2 major clades. One of these clades contains the genera Miopithecus (M) and Cercopithecus (C), which diverged from each other ca. 12.4 MYA. The mainly arboreal species groups belonging to the genus Cercopithecus radiated ca. 8 to 11 MYA, referred to as the “Arboreal clade” hereafter. The other major clade contains the genus Allenopithecus (Allen), as sister to the terrestrial genera Chlorocebus (Chl), Erythrocebus (E), and Allochrocebus (A), hereafter termed the “Terrestrial clade.” The Terrestrial clade split from Allenopithecus ca. 12.5 MYA and underwent rapid radiation ca. 8 MYA.
We repeated the same process with 118 X-chromosomal loci, resulting in an identical topology with highly similar divergence times (supplementary figs. S3 to S5, Supplementary Material online). The placement of Erythrocebus as a sister to Chlorocebus received low support (lpp = 0.53), likely due to rapid radiations and a high degree of ILS.
Samples from male individuals were available for 17 species and they were used to construct a Y-chromosome phylogeny with RaxML (Stamatakis 2014). Compared with the autosomal phylogeny, this tree disagreed only in the placement of Erythrocebus, in line with the incomplete support obtained for this node in other datasets (supplementary fig. S6, Supplementary Material online). Considering the high topological concordance among nuclear markers of different inheritance modes, we hereafter refer to the autosomal phylogeny as the “species tree” (Fig. 1C), although some uncertainty remains regarding the exact placement of Erythrocebus.
Mitonuclear Discordances Suggest Ancient Hybridization
We assembled the mitochondrial genomes of all samples, constructed a maximum likelihood tree in RaxML, and estimated divergence times with MCMCTree (Fig. 1C; supplementary figs. S7 and S8, Supplementary Material online; Materials and Methods). The mitochondrial phylogeny was consistent with previous reports (Guschanski et al. 2013) and showed several hard incongruences with the species tree (Fig. 1C; supplementary fig. S7, Supplementary Material online). Most strikingly, the terrestrial genus Erythrocebus is nested within the Arboreal clade, sister to the cephus and mitis species groups, and 2 terrestrial Allochrocebus species—Allochrocebus lhoesti and Allochrocebus preussi—cluster together with the arboreal cephus species group, whereas their congener Allochrocebus solatus is sister to the terrestrial genus Chlorocebus.
Topological differences between nuclear and mitochondrial phylogenies can be caused by ILS or hybridization. We explored the probability of ILS causing the observed mitonuclear discordances using simulations and found that topological conflicts where a lineage changes position from being nested in one clade to being nested within another were highly unlikely to occur under ILS alone (supplementary fig. S9, Supplementary Material online). For example, while Erythrocebus patas shifted position across a single node in 19% of 10,000 simulations, only a single simulation resulted in a shift across 2 nodes, which would still be insufficient to explain its placement in the real data (supplementary fig. S9B, Supplementary Material online). Thus, ILS remains a plausible explanation for lineages shifting positions across single nodes, e.g. Miopithecus and Cercopithecus diana, whereas the deeper mitonuclear discordances are more likely explained by hybridization and mitochondrial introgression.
Ancient Gene Flow is Prevalent Among Guenons
To further investigate ancient hybridization, we used Dsuite (Malinsky et al. 2021) to calculate D-statistics and f4-ratios (Durand et al. 2011) on autosomal data for all possible trios of guenon species, using the rhesus macaque as outgroup. Out of 1,540 tested trios, 865 produced significant D-statistics, indicative of gene flow. However, these are not independent as shared ancestry may create signals of gene flow in close relatives or descendants of the involved lineages. To disentangle this complex pattern, we used different combinations of D-statistics similar to the DFOIL-method (Pease and Hahn 2015). Additionally, we applied an approach adapted from the partitioned D-statistic (Eaton and Ree 2013), where we excluded shared variants to detect “carryover effects,” a phenomenon that produces positive D-values in close relatives to the actual source, as a consequence of their shared ancestry. Briefly, if directional gene flow occurs from species A to species B, this will also generate a signal of excess allele sharing between any species more closely related to A than to B, whereas this is not the case if gene flow is restricted to the opposite direction (more details in Materials and Methods; Fig. 2). Identifying these effects allowed us to disentangle the primary source and recipient lineages (i.e. infer directionality) for most gene flow events.
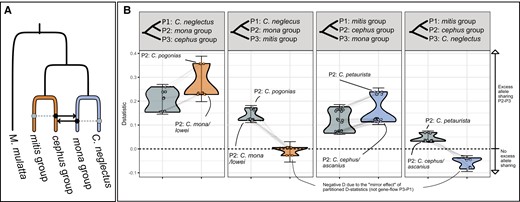
D-statistics and partitioned D-statistics. (A) Schematic overview of gene flow event A (Fig. 3), with branch colors corresponding to the partitions used to estimate private allele sharing. Solid black arrows show the inferred gene flow, and dashed gray lines show allele sharing inferred as “carryover” effects. (B) Four tests for excess allele sharing between the mona group, cephus group, mitis group, and C. neglectus, similar to the DFI, DOL, DIL, and DFO of the DFOIL test (Pease and Hahn 2015), respectively. Gray points and distributions show the D-statistics for all combinations of taxa from the respective groups as depicted in the panel header, with M. mulatta as outgroup, using all SNPs. Colored points and violin distributions show the D-statistics for the same trios (connected by gray lines) after removing sites with shared alleles between the cephus and mitis groups (orange, two leftmost panels) or Cercopithecus neglecus and the mona group (blue, two rightmost panels). Note that some D values turn negative after removing shared ancestral variation, which is an expected consequence of this method and should not be interpreted as excess allele sharing between P1 and P3 (Pease and Hahn 2015). Error bars show the lowest and highest D-statistic ±3 standard errors. Positive D-statistics that approaches zero or become negative after shared alleles are removed are interpreted as carryover effects, indicating directionality.
We detected the strongest signal of excess allele sharing, indicative of ancestral hybridization, between the cephus and mona species groups (D = 0.15 to 0.29, Fig. 2, events A1 and A2 in Fig. 3). The f4-ratios, which provide an estimate of the proportion of introgression across the genome, suggested that at least 10% to 20% of the genome was introgressed (simulations have shown that f4-ratios may substantially underestimate the actual proportion of gene flow [Svardal et al. 2020]). This gene flow event also produced significant values of D between the cephus group and Cercopithecus neglectus, the latter being sister to the mona group (Fig. 2). However, this was likely driven by shared ancestry between C. neglectus and the mona group, as these D-values approached zero when only private alleles were considered (Fig. 2). This suggests directional gene flow from the mona group, with carryover-effects from C. neglectus, into the cephus group.
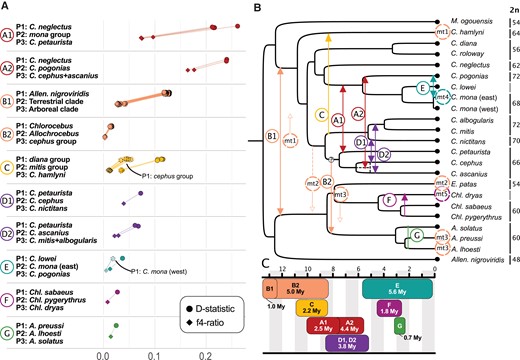
Excess allele sharing and gene flow events among guenons. (A) D-statistic (circles) and f4-ratios (diamonds) as estimated by Dsuite illustrating excess of allele sharing caused by the 7 identified gene flow events. The combinations of tested taxa are shown on the left (with M. mulatta as outgroup). Positive D-statistic values indicate gene flow between P3 and P2 taxa and are connected by lines to the f4-ratios that reflect the proportion of gene flow. The values were obtained for all possible members of the respective species groups, for which more than a single representative was available in our dataset. In events C and E, we observed decreasing D-statistics with more closely related P1 taxa (annotated as dashed shapes), indicating directionality from P2 into P3. (B) Schematic overview of the identified gene flow events. Arrows are shown where directionality could be inferred. Mitochondrial introgressions, accompanying nuclear gene flow between internal branches, are shown as dashed circles with an arrow. Dashed circles on tips highlight species that carry an introgressed mitochondrion, with circle color corresponding to the most likely introgression event. The donor in B2 was not fully resolved, as illustrated by the question mark, and the dashed line of the C. cephus/ascanius divergence illustrates the likely overestimate of this node's age (see main text). Where available, annotations to the right of species labels show the chromosome number of extant species. (C) Schematic overview of the minimum time since divergence at the time of introgression, based on the divergence time estimates. The divergence time estimate between the eastern and western populations of C. mona was retrieved from Ayoola et al. (2021).
Similarly, we found excess allele sharing between the mona and mitis groups, also primarily driven by carryover-effects due to the shared ancestry between the cephus and mitis groups (Fig. 2). Hence, we conclude that there has been bidirectional gene flow between the ancestors of the cephus and mona groups. The D-values varied substantially among cephus and mona group species (Fig. 2), suggesting more than a single ancestral pulse of gene flow. The simplest scenario that could explain the observed D-values involves 2 bidirectional pulses of gene flow: one between Cercopithecus petaurista and the mona group ancestor, and a second between Cercopithecus pogonias and the ancestor of Cercopithecus cephus/ascanius (A1 and A2 in Fig. 3). Notably, the split between C. cephus and C. ascanius pre-dates that between C. pogonias and Cercopithecus mona/lowei in our divergence time estimates, contradicting the proposed second gene flow pulse into the C. cephus/ascanius ancestor. However, divergence time estimates from genomic regions with low introgression between the cephus and mona groups produced a substantially younger split time between C. cephus and C. ascanius, postdating the divergence between C. pogonias and C. mona/lowei by ca. 1 MY (supplementary fig. S10, Supplementary Material online). These estimates are broadly consistent with the divergence times proposed by Kuderna et al. (2023) and suggest that introgression from the mona group likely inflated our divergence time estimates among cephus group species.
The second strongest gene flow signal was detected between the Arboreal and Terrestrial clades (D ∼0.12, f4-ratio ∼0.03 to 0.04; event B1 and B2 in Fig. 3). We applied the same polarization approach and found that most D-values can be attributed to a bidirectional gene flow event between the ancestors of the 2 clades, ca. 11 to 12 MYA (event B1; supplementary fig. S11, Supplementary Material online). However, the terrestrial genus Allochrocebus shares more alleles with the Arboreal clade than its sister genus Chlorocebus (supplementary fig. S12A, Supplementary Material online), suggesting that gene flow continued or reoccurred along the ancestral Allochrocebus branch (event B2; Fig. 3). This is also supported by the presence of a cephus group-like mtDNA in A. lhoesti/preussi (Fig. 1C; discussed below) and a trend towards excess allele sharing between specifically the cephus group and Allochrocebus (supplementary fig. S12B, Supplementary Material online). The reason that this trend is largely nonsignificant is likely due to the extensive gene flow within the Arboreal clade (Fig. 3).
Furthermore, we found evidence of gene flow between the ancestor of the mitis group and Cercopithecus hamlyni (Fig. 3; event C; D ∼ 0.11, f4-ratio = 0.04), the cephus and mitis groups (event D, 2 pulses of gene flow; D ∼ 0.07, f4-ratio = 0.02 to 0.04; Fig. 3; supplementary fig. S13, Supplementary Material online), C. pogonias and the eastern C. mona population (event E; D = 0.04, f4-ratio = 0.01; also reported by Ayoola et al. [2021], Chlorocebus dryas and Chlorocebus pygerythrus (event F; D = 0.03, f4-ratio = 0.01; as reported by van der Valk et al. [2020]) and A. solatus and A. lhoesti (event G; D = 0.02, f4-ratio = 0.01). Using the polarization approach, we could infer that event D was bidirectional. The most parsimonious explanation for the increasing D-statistics with more distant P1-lineages observed in event C and E is directionality from the mitis group into C. hamlyni and from the eastern C. mona populations into C. pogonias, respectively (Fig. 3). We cannot test for the opposite direction in these 2 events since our dataset lacks sister lineages to C. hamlyni and C. pogonias.
In total we pinpoint 7 major ancestral gene flow events (A to G, Fig. 3), some of which occurred in several pulses (A1 and A2, B1 and B2, D1 and D2, treated as separate pulses of the same event as they are strongly interdependent). The difference in age between the nodes separating P2 from its closest sister and that separating P3 from P2, provides a minimum time of divergence at the time of gene flow. These times ranged from 0.7 to over 5 MY (Fig. 3C), suggesting that reproductive isolation may remain incomplete for long periods. We also inferred hybridization events with an independent, model-based approach based on phylogenetic networks using PhyloNetworks (Solís-Lemus and Ané 2016; Solís-Lemus et al. 2017). Since PhyloNetworks does not allow multiple reticulations along the same branch, we analyzed subsets of the tree to test each independent event and found strong support for all of them (supplementary figs. S14 to S21, Supplementary Material online). However, we fully acknowledge that the presented scenarios are likely an oversimplification, and additional gene flow events may have occurred.
Among the identified gene flow events, events D and E most likely involved lineages with different chromosome numbers based on the known karyotypes of the extant species (Fig. 3; Sineo et al. 1986; Lo Bianco et al. 2017). To investigate if this was the case in older events, we reconstructed the ancestral karyotypes using ChromEvol (Hohna et al. 2016; Freyman and Höhna 2018). The 4 independent runs returned unique ancestral states for internal nodes and converged poorly (low support [lpp ≤ 25]; supplementary figs. S22 and S23, Supplementary Material online). However, all reconstructions suggest that the more ancient events A (primarily A2), B, and C occurred across different karyotypes. Thus, 5 out of 7 major gene flow events are most likely examples of cross-karyotypic gene flow. The remaining 2 events occurred within the karyotypically stable Allochrocebus and Chlorocebus genera (F and G), although the karyotype of Chl. dryas is not known and karyotypic differences may involve more than differences in chromosome numbers.
A Combination of Introgression and ILS Best Explains Mitonuclear Discordances
The detected gene flow events directly explain 2 of the 5 hard mitonuclear discordances (Figs. 1C and 3; events F and E), whereas the remaining cases are more complex. Our results suggest that these discordances are best explained by a combination of introgression and ILS: Introgressed mitochondria segregate in the ancestral population and become fixed only in a subset of descendant lineages. For example, the hamlyni group is a member of the Arboreal clade in the species tree, but sister to the Terrestrial clade in the mitochondrial phylogeny. Contradicting the direct introgression of mitochondria into hamlyni from the Terrestrial clade, we found no signal of nuclear gene flow into hamlyni after it diverged from the rest of the Arboreal clade (supplementary fig. S24, Supplementary Material online). A scenario in which a Terrestrial-like mtDNA introgressed into the Arboreal clade ancestor during event B1 and was subsequently retained only in the hamlyni group is thus most compatible with our results (Fig. 3B). Similarly, despite indistinguishable levels of nuclear gene flow between all members of the genus Allochrocebus and the Arboreal clade (supplementary fig. S25, Supplementary Material online), only the A. lhoesti/preussi lineage carries the introgressed cephus group-like mtDNA. This haplotype was most likely transferred into the Allochrocebus ancestor in event B2 but differentially retained during subsequent divergence. The Arboreal-like mtDNA of the genus Erythrocebus is also likely the result of ancestral introgression and subsequent differential sorting, as this lineage shows lower levels of nuclear gene flow with the Arboreal clade than other members of the Terrestrial clade (supplementary fig. S11, Supplementary Material online). A complicating factor is that this scenario requires the retention of mitochondrial polymorphism over 2 speciation events (nodes), according to our species tree. However, as mentioned above, uncertainty remains regarding the phylogenetic position of Erythrocebus, as alternative topologies place it as sister to a clade containing the Chlorocebus and Allochrocebus genera (Kuderna et al. 2023). Given this latter placement, the mtDNA polymorphism only needs to be retained over a single speciation event.
Mitochondrial Introgression Across Deeply Divergent Lineages was Facilitated by the Co-sorting of Alleles in Nuclear Genes With Mitonuclear Interacting Functions
We identified several mitochondrial introgressions across deeply divergent lineages. Nuclear and mitochondrial genes interact during the essential production of ATP via oxidative phosphorylation (OXPHOS), and several reports attributed hybrid inviability to malfunctioning mitonuclear complexes (Burton 2022). Therefore, we investigated whether mitochondrial introgressions were facilitated by cointrogression of mitonuclear interacting genes. We tested this in one of the most extreme cases, the introgression of a cephus group-like mitochondrion into the ancestral Allochrocebus lineage, which involves lineages separated by at least 5 MY of independent evolution (Fig. 3C). While A. lhoesti and A. preussi are fixed for an introgressed mitochondrial genome, their sister, A. solatus, retains the ancestral mtDNA. To test if alleles in genes with known mitonuclear interacting function (N-mt genes, supplementary table S3, Supplementary Material online) were differentially sorted alongside the introgressed mtDNA, we investigated if these genes were more cephus-like in A. lhoesti/preussi compared with genes without such interactions. However, N-mt and control genes showed similar levels of cephus group ancestry in A. lhoesti/preussi, and there was no difference in absolute divergence to A. solatus, suggesting a lack of broad-scale cointrogression of N-mt genes (supplementary fig. S26, Supplementary Material online). Next, we assessed SNP patterns on a gene-by-gene basis to identify signatures of fine-scale cointrogression of N-mt genes (Fig. 4A). Using the same gene sets (N-mt and control), we counted cephus group-like alleles retained only in either A. lhoesti/preussi or A. solatus. We used Chlorocebus to polarize the ancestral Terrestrial clade allele and counted 2 SNP patterns: category 1—grouping A. lhoesti/preussi with the cephus group and A. solatus with Chlorocebus (in agreement with the mtDNA topology) and category 2—grouping A. solatus with the cephus group and A. lhoesti/preussi with Chlorocebus (opposing mtDNA topology, Fig. 4A). If only ILS is involved, we expect equal frequencies of both categories. However, if a non-neutral process favors the retention of coadapted mitonuclear variants, we expect an excess of category 1 SNPs. In line with cointrogression of N-mt alleles, there was a clear excess of category 1 SNPs in N-mt compared with control genes (Fig. 4B; supplementary table S4, Supplementary Material online). In N-mt genes, we found 196 category 1 SNPs and 96 category 2 SNPs, whereas similar numbers of both SNP categories were found among control genes (a maximum of 133 and 131, respectively). More than half of the category 1 N-mt SNPs were located in the genes NDUFA10 and LRPPRC (70 and 31, respectively) and included several nonsynonymous variants (3 and 1, respectively, supplementary table S3, Supplementary Material online). No nonsynonymous cephus-like variants were found in A. solatus in these genes, and across all considered N-mt genes, we detected a greater number of cephus-like nonsynonymous variants in lhoesti/preussi than in solatus (11 vs. 1). Mutations in NDUFA10 and LRPPRC have been linked to dysfunction of mitochondrial complexes I (Hoefs et al. 2011) and IV (Oláhová et al. 2015), both of which are involved in OXPHOS. Our results thus suggest that retaining cephus-like variants in these genes may have been essential to overcome mitonuclear incompatibilities and to facilitate mitochondrial introgression.
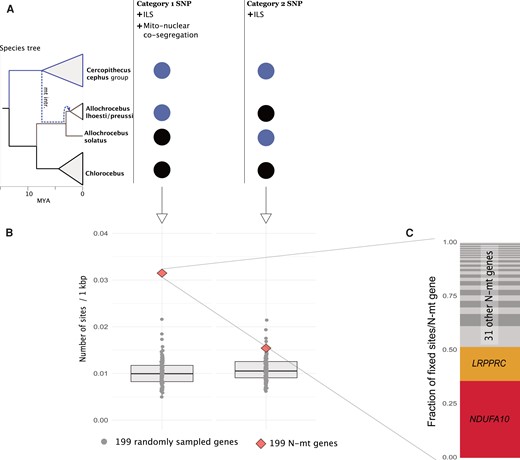
Prevalence of privately retained introgressed cephus group alleles in A. lhoesti/preussi and A. solatus in nuclear genes involved in mitochondrial functions (N-mt) compared with the genomic background. (A) Schematic overview of the 2 considered SNP categories. The dashed line in the species tree illustrates the mitochondrial introgression from the cephus group to the ancestral Allochrocebus branch, subsequently retained only in the A. lhoesti/preussi lineage. The circles illustrate the 2 categories of SNPs differentially fixed between the cephus group (light circles) and Chlorocebus (black circles): Category 1 groups A. lhoesti/preussi with cephus and can arise through ILS and mitonuclear cosegregation, whereas category 2 groups A. solatus with cephus and is expected only from ILS. (B) Number of SNPs per 1,000 base pairs of categories 1 and category 2 across 199 N-mt genes (red diamonds) and 100 samples of 199 other nuclear genes (gray dots). (C) Proportion of category 1 SNPs contributed by 33 N-mt genes with at least one such site, highlighting the identity of the 2 most important genes.
Admixed Genomes are a Mosaic of Different Ancestries With Elevated Heterozygosity in Introgressed Regions
Next, we investigated the spatial patterns of gene flow to understand the genomic architecture of introgression. For simplicity, we only tested the trio setup ((P1, P2) P3) with the highest D-values for events occurring in several pulses (A1, B1, D1, Fig. 3). We constructed neighbor-joining trees in non-overlapping 25 kb windows along the genome and assigned them to 3 main topologies: Tree 1 corresponds to the species tree, Tree 2 shows the introgressed topology, and Tree 3 is consistent with ILS. The species tree—the most frequent topology in all instances—was interspersed with short regions of introgressed and ILS-derived ancestry in all events (Fig. 5A; supplementary figs. S27 to S32, Supplementary Material online). Consecutive windows of introgressed ancestry were rare, in line with ancient timing of gene flow (supplementary fig. S33, Supplementary Material online). Notably, Tree 2 may also arise through ILS and the proportion of introgressed ancestry must be assessed relative to Tree 3, which is expected to result only from ILS. Tree 2 was always more frequent than Tree 3 and, in line with our D-statistics analyses, we found the highest relative proportions of Tree 2 in events A to D.
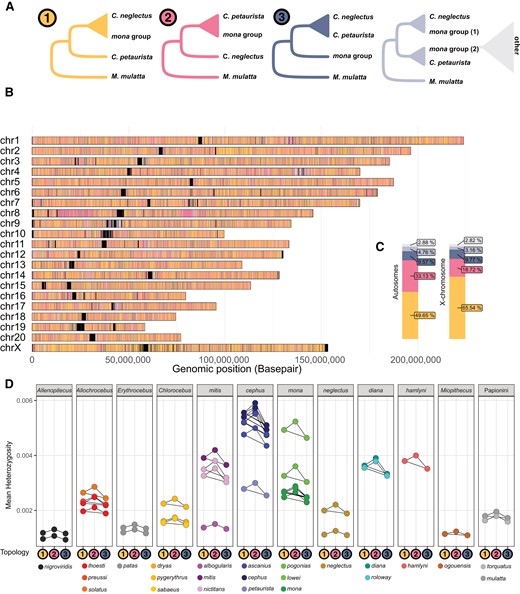
Distribution, prevalence and heterozygosity of introgressed genomic segments. (A) Five possible tree topologies obtained from 25 kb genomic windows for the introgression event A1 (Fig. 3), involving C. neglectus, mona, and cephus groups (here represented by C. petaurista), rooted with M. mulatta as outgroup. Tree 1 groups the lineages according to the species tree. Tree 2 groups the mona group species and C. petaurista monophyletically to the exclusion of C. neglectus and can be caused by ancestral introgression or ILS. Tree 3 places the C. petaurista with C. neglectus and is expected to be caused only by ILS. The remaining 2 trees (light blue and gray) represent more complex topologies, which could be caused by, e.g. more recent introgression or ILS. (B) The genomic location of the different tree topologies along the M. mulatta chromosomes, and (C) their relative abundance on the autosomes and the X-chromosome. Black blocks in (B) correspond to regions of the genome with insufficient information for inferences, frequently located around centromeres and telomeres. (D) Heterozygosity in windows corresponding to Tree 1, Tree 2, and Tree 3 topologies (shown as colored circles along the x axis) calculated for all samples and species. Connectors show significant within-sample differences in heterozygosity between tree topologies, as assessed by ANOVAs followed by post hoc Tukey's tests corrected for multiple testing.
To assess how genetic diversity relates to local ancestry, we calculated heterozygosity in the same 25 kb autosomal windows as above. Heterozygosity correlates positively with local recombination rate, mainly due to reduced linked selection (Nachman 2001; Cutter and Payseur 2013). The same mechanism is predicted to create a positive correlation between introgression and recombination rate: Introgressed haplotype blocks, which are predominantly deleterious, are efficiently purged in regions of low recombination, whereas high recombination rate may decouple neutral or beneficial alleles from their deleterious neighbors, leading to a higher local introgression rate (Figueiró et al. 2017; Veller et al. 2023). Since most of our study species lack recombination maps, we used heterozygosity as a rough proxy for recombination rate, hypothesizing that it would be higher in regions with introgressed ancestry. Indeed, we observe this pattern in 3 of the 4 strongest gene flow events (A, B, and D), with Tree 2 windows showing higher heterozygosity than Tree 1 and Tree 3 windows (Fig. 5D; supplementary figs. 27D and 29D, Supplementary Material online). Remarkably, this pattern was not restricted to taxa involved in the particular gene flow event (cephus and mona in the event A; Fig. 5D), arguing against higher heterozygosity being driven by segregating introgressed alleles, which would only affect the recipient lineages. Instead, it is consistent with a globally higher recombination rate in regions prone to retaining introgressed material. We do not find elevated heterozygosity in introgressed regions in some of the weaker gene flow events (C, E, F, G; supplementary figs. S28D, S30 to S32D, Supplementary Material online). It is possible that the introgressed regions are too short and too few in these events or that the positive correlation between introgression and local recombination rate is not a universal pattern.
Introgressed Regions Show Low Repeatability Across Independent Gene Flow Events and are Enriched for Immune Genes
Next, we quantified the introgression proportion in regions along the genome by calculating FD in non-overlapping 25 kb windows (Martin et al. 2015). If genomic architecture and local recombination rate are the main determinants of the genomic location of introgressed regions and if synteny is conserved in different guenon species, we expect to repeatedly find the same genomic regions introgressing in separate gene flow events (Langdon et al. 2022). We found weak, albeit significant, correlations in the introgression landscape across all 21 comparisons (Pearson's R2 range 0.008 to 0.100 P < 0.05, supplementary fig. S34, Supplementary Material online), suggesting low levels of parallelism.
We investigated the functional relevance of introgression for each event by identifying genes overlapping genomic regions with exceptionally high signals of introgression (FD ≥ 99th percentile). To reduce the risk of false positives, we also required that P2 showed higher sequence similarity with P3 than with P1, and excluded windows where sequence divergence between P1 and P3 was below the 10th percentile (as FD tend to be biased upwards in regions of low divergence [Martin et al. 2015]). In principle, differential sorting of ancestral polymorphisms could generate similar patterns (Guerrero and Hahn 2017), but the regions would be on average shorter due to their old age and less likely to pass our outlier criteria. Hence, we call these windows putatively introgressed. We found 1,588 genes in these putatively introgressed regions (n = 188 to 345 per event, supplementary table S5, Supplementary Material online). Most genes were present in a single event (n = 1,412), in line with low repeatability of introgression. No functional enrichment was detected when considering the gene lists from each event separately (Fischer's exact test corrected with false discovery rate [FDR] > 0.05), but the total set of introgressing genes was significantly enriched for functions involved in “regulation of lymphocyte mediated immunity (GO:0002706)” (FDR = 0.0493; supplementary table S6, Supplementary Material online), suggesting that sympatric species may benefit from exchanging alleles adapted to circulating pathogens. For example, the gene CCR2 was repeatedly introgressed in 3 separate events (B, C, and D). This gene is involved in the immune response to the simian immunodeficiency virus (SIV; Bissa et al. 2023), which is known to be a strong selective force in guenons (Svardal et al. 2017). We also note 11 introgressed genes involved in meiotic chromosome segregation (supplementary table S5, Supplementary Material online), as they may play a role in cross-karyotypic gene flow events. Nine of them introgressed between lineages that most likely differed in karyotypes. Among them are SMC2, which is critical for bivalent chromosome formation during meiosis (Lee et al. 2011), and the well-studied PRDM9, which is vital for shaping the recombination landscape (Parvanov et al. 2010). Both introgressed in event B, most likely from the Arboreal to the Terrestrial clade ancestor (supplementary fig. S35, Supplementary Material online).
Introgression Deserts Contain Genes Encoding Morphological Traits
Regions with strong signals of introgression were significantly depleted for several gene ontology (GO)-terms related to anatomy and development (e.g. cell differentiation [GO:0030154], animal organ development [GO:0048513] and anatomical structure morphogenesis [GO:0009653], FDR < 0.05, supplementary table S6, Supplementary Material online). This suggests that genes related to morphological traits may reduce gene flow, maintaining species integrity. To better understand the processes involved in reproductive isolation, we also specifically investigated the gene content of long genomic regions (≥500 kb) devoid of introgression, here termed “introgression deserts” (see Materials and Methods). Such regions were likely purged of introgressed variants rapidly after hybridization and may thus contain genes acting as barriers to gene flow. We found 59 to 135 such regions across all introgression events, containing 3,354 protein-coding genes (n = 391 to 995 per event, supplementary table S7, Supplementary Material online), without any significant GO enrichments. In events A, B, and G, the proportion of the X-chromosome contained in introgression deserts was substantially larger than for any autosome, suggesting that the X-chromosome plays an important role in reproductive isolation in these events (supplementary fig. S36, Supplementary Material online). In the remaining events, the introgression deserts were approximately equally common across the autosomes and the X-chromosome, spanning ca. 0% to 5% of the chromosomal length. The majority of genes located in introgression deserts were unique to one event (n =2,647). However, 2 genomic regions were identified as introgression deserts in 5 independent events. These contained 10 genes, including HPS6 which is involved in melanogenesis and has been associated with pelage coloration in the African wild dog Lycaon pictus (Chavez et al. 2019). Guenons have distinct face colorations, suggested to be important for species recognition and mate choice (Allen et al. 2014). It is thus likely that genes with functions related to pelage coloration are important for maintaining species identity in sympatry. Among genes repeatedly found in introgression deserts are also several genes involved in reproductive traits. For example, APPBP2 and USP32 (events A, B, and C) are associated with reproductive seasonality in sheep (Martinez-Royo et al. 2017), a trait that is also highly variable in guenons (Enstam and Isbell 2007).
Discussion
Using a comprehensive whole-genome dataset, we reveal a complex evolutionary history of guenons that was shaped by multiple ancient hybridization events despite the presence of ecological, morphological and karyotypic differences. In addition, we present a well-resolved guenon species tree that provides a foundation for future studies of guenon evolution.
Supporting the idea that ancestral introgression may spark subsequent radiations through the introduction of novel genetic variation (Han et al. 2017; Meier et al. 2017; Grant and Grant 2019; Svardal et al. 2020), we find that several species-rich guenon lineages are descendants of hybridization events. For example, we detect strong signals of gene flow between the ancestors of the Arboreal and Terrestrial clades, both of which subsequently underwent extensive radiations. However, their nonadmixed sister genera, Miopithecus and Allenopithecus, remained largely monotypic (2 and 1 species, respectively [IUCN 2022]). Similarly, the ancestors of the diverse mona and cephus species groups showed the most pronounced ancestral gene flow and exchanged up to 20% of their genomes. Similar admixture proportions have been reported as “hybrid speciation” in other studies of primates (Zhang et al. 2023) and may have provided genetic fuel for subsequent radiations in these species-rich groups. Explicitly testing for the contribution of hybridization to diversification requires broader sampling across the primate phylogeny, but it is possible that rampant ancient hybridization events have contributed to the remarkable diversity of guenons.
Our results suggest frequent gene flow across guenon lineages with different chromosome numbers. While karyotypic differences can act as reproductive barriers (Giménez et al. 2013; Garagna et al. 2014; Augustijnen et al. 2023; Mackintosh et al. 2023), gene flow across different karyotypes has been demonstrated in the common shrew Sorex araneus (Horn et al. 2012) and rock wallabies Petrogale spp. (Potter et al. 2015). Furthermore, cross-karyotypic hybridization may generate novel, intermediate karyotypes (Lukhtanov et al. 2020). Considering their extreme karyotypic diversity and highly reticulate evolution, guenons provide an excellent system to better understand the influence of hybridization on chromosomal reorganization and, in turn, the role of such events in reproductive isolation and speciation. We found several genes with reported functions in chromosomal segregation that show strong signatures of introgression across lineages with different karyotypes (Fig. 3; supplementary table S5, Supplementary Material online). Introgression of such genes has been suggested to be an important mechanism to retain stable meiotic chromosome segregation, following whole-genome duplication in plants (Marburger et al. 2019; Seear et al. 2020). Hence, they may be involved in facilitating cross-karyotypic gene flow by promoting pairing and recombination across homologous chromosomes despite karyotypic differences. Particularly intriguing is the ancestral introgression of PRDM9, which is known for shaping the recombination landscape in mammals (Parvanov et al. 2010) and rapidly causing sterility in mouse hybrids (Forejt et al. 2021). Homogenization of PRDM9 during hybridization between the Arboreal and the Terrestrial clades may have promoted hybrid fertility, thus facilitating gene flow.
Mitochondrial introgression has been found in many study systems, including primates (Zinner et al. 2018; Bailey and Stevison 2021), and is more likely to occur across recently diverged lineages as mitonuclear incompatibilities accumulate rapidly and can act as early contributors to reproductive isolation (Tobler et al. 2019; Burton 2022). In line with previous studies (Guschanski et al. 2013), we identified multiple cases of ancestral mitochondrial introgressions in guenons, several of which occurred across deeply divergent lineages separated by at least 4 to 5 MY of independent evolution. Biogeographical analyses suggest that mitochondrial introgression commonly occurs from the resident into the dispersing taxon (Toews and Brelsford 2012; Mastrantonio et al. 2016). Female guenons tend to be philopatric, whereas males disperse at sexual maturity (Enstam and Isbell 2007). Mitochondrial introgression is thus likely to happen when males at the front of an expanding population hybridize with resident females of a different species, a process sometimes referred to as “nuclear swamping” (Zinner et al. 2018; Detwiler 2019; Sørensen et al. 2023). While the nuclear genome remains homogenized across the population, mainly through male-mediated gene flow, the introgressed mitochondria can persist at high frequency at the expansion front. If such edge populations subsequently become isolated, the pattern of differential retention of mitochondria in the presence of equal levels of nuclear gene flow may arise. Such a scenario fits well with current and inferred historical distribution ranges of guenon species with introgressed mitochondria. Ancient mitochondrial introgression events tend to have happened in lineages that likely diverged from the source population through range expansion leading to secondary contact with other species (Guschanski et al. 2013). It is intriguing to speculate whether introgression of mitochondrial and coadapted nuclear variation, as we found e.g. in the A. lhoesti/preussi lineage, may have contributed to reproductive isolation from the ancestral population. A similar idea was raised by Moran et al. (2022), who reported a cointrogression of mitochondrial and coadapted nuclear genes in swordtail fish, Xiphophorus spp., and proposed reproductive isolation arising from mitonuclear incompatibility between the resulting lineage and its closest sister species. If this is a general pattern, mitochondrial introgressions, particularly between deeply divergent lineages, might be an important mechanism in the early stages of speciation.
An intriguing question in speciation research is: To what extent is the outcome of introgression predictable? Studies analyzing multiple independent hybridizing populations between the same pairs of taxa report highly similar admixed genome compositions (Runemark et al. 2018; Langdon et al. 2022; Nouhaud et al. 2022). Guenons constitute an excellent model to study the predictability of introgression between different taxa in a speciation continuum, which has not been previously done. In contrast to the aforementioned studies, our results reveal introgression landscapes primarily unique to each admixed lineage. This difference could be due to the level of evolutionary divergence among hybridizing lineages. High repeatability and predictability may be present in closely related populations or species, whereas low repeatability may be the hallmark of independent hybridizations between different, deeply divergent lineages. The weak repeatability of the introgression landscapes in guenons suggests that genomic incompatibilities accumulated in different genomic regions and genomic barriers to gene flow are predominantly lineage specific. It is possible that the karyotypic diversification in guenons has altered their recombination landscape, which is expected to be a critical factor in driving introgression (Edelman et al. 2019; Martin et al. 2019; Langdon et al. 2022). As chromosome-level genome assemblies from nonmodel organisms become increasingly available, this is an emerging future research topic. Nevertheless, we find an underrepresentation of genes involved in morphological structures and development among introgressed regions (supplementary table S6, Supplementary Material online) and a repeated occurrence of genes involved in pelage coloration and reproductive characteristics among introgression deserts (supplementary table S7, Supplementary Material online), pointing to their functional importance in maintaining species boundaries.
Supporting the notion of repeatability on the level of gene function, we detect an enrichment for immune genes among introgressed loci. Sympatric species are likely to be exposed to similar pathogens. Viruses in particular are known to be a strong selective force in guenons (Svardal et al. 2017), and exchanging genes adapted to circulating pathogens may thus be highly beneficial. Guenons are natural hosts to the SIV, which is closely related to the human immunodeficiency virus (HIV). Supporting the importance of adaptively introgressed loci with immune function, we detect CCR2 in multiple introgression events (B, C, and D). This gene plays an important role in the inflammatory response following SIV infection, mainly through the mobilization of monocytes (Tsou et al. 2007; Bissa et al. 2023).
We also find that elevated heterozygosity in introgressed genomic regions, a predicted outcome given a positive correlation between recombination rate and introgression, is not a universal pattern. Although the karyotypic diversification of guenons may have altered their recombination landscape, heterozygosity is still expected to be elevated in introgressed regions in the admixed lineage (but not necessarily globally). However, a recent theoretical study suggested that the relationship between recombination and introgression rates may be absent or negative in the early stages of species divergence and only later become positive (Dagilis and Matute 2023). Two out of 4 events lacking this relationship occurred between closely related lineages (F and G, diverged < 2 My before hybridization) and may thus not have been diverged enough to develop the positive relationship between recombination and introgression. However, we caution that accurately identifying introgressed haplotype blocks from phylogenomic data is challenging, particularly when hybridization is ancient and these blocks are short and contain few informative sites. There may also be other factors obscuring these inferences, e.g. large proportions of ILS.
In summary, our study untangles a complex evolutionary history of guenons shaped by extensive ancient introgression. We found gene flow across deeply divergent lineages, suggesting that reproductive isolation in this primate clade may remain incomplete for extended periods despite ecological, morphological, and karyotype differences. We note that while hybridization frequently resulted in interspecific transfers of mitochondrial genomes, not a single case of introgression of the paternally inherited Y-chromosome was identified in our dataset. This strongly suggests that male hybrids experience lower fitness, in line with Haldane's rule (Haldane 1922), which predicts that postzygotic barriers will likely be stronger in the heterogametic sex. Our study offers insights into the role and prevalence of ancient gene flow in mammalian radiations and provides an important framework for future studies of this diverse primate group.
Materials and Methods
Mapping and Variant Calling
Our dataset consisted of short-read whole-genome sequencing data from 37 individuals (22 guenon species and 2 outgroup species) from different sources (van der Valk et al. 2020; Ayoola et al. 2021; Kuderna et al. 2023; see supplementary table S1, Supplementary Material online for details). We followed the Genome Analysis Toolkit best practices for mapping and variant calling (Van der Auwera et al. 2013). Briefly, we marked adapters with MarkIlluminaAdapters (Picard v. 2.23.4, http://broadinstitute.github.io/picard) and mapped reads to the rhesus macaque (M. mulatta) reference genome (Mmul_10, GenBank: GCA_014858485.1) using bwa-mem (v 0.7.17). Duplicate reads were marked using MarkDuplicates (v. 2.23.4), and we used HaplotypeCaller (v. 4.1.4.1) and GenotypeGVCFs (v. 4.1.1.0) to call genotypes, including invariable sites. Next, we excluded insertions and deletions (indels) and filtered the remaining calls using VariantFiltration (v. 4.1.1.0) with the recommended exclusion criteria (QD < 2.0, QUAL < 30, SOR > 3, FS > 60, MQ < 40, MQRankSum < −12.5, ReadPosRankSum < −8.0). Next, we excluded multiallelic sites and repetitive regions annotated in the repeat-masker track for the Mmul_10 reference with BCFtools (Li et al. 2009) and set heterozygous genotypes with minor allele support to <0.25 to no call. Last, we used BCFtools to remove sites with coverage below and above one standard deviation of the genome-wide average or with a fraction of missing genotypes higher than 0.1.
Phylogenetic Inferences
Autosomal and X-chromosomal Trees
We used IQTree (v 2.0, Minh et al. 2020) to construct gene trees across autosomes and the X-chromosome, using the GTR model with 1,000 rapid bootstraps. We used a window size of 25 kb and sampled one region every 500 kb, as the multispecies coalescence model (see below) assumes independent gene trees without internal recombination. Sites with missing data were filtered out and windows with a filtered length below 10 kb were removed. The filtered gene trees were then used to independently estimate phylogenies for autosomes and the X-chromosome under the multispecies coalescence model with ASTRAL (Zhang et al. 2018). ASTRAL was run on all samples and, after confirming the monophyly of all species, we pruned the tree to include a single sample per species when estimating divergence times. We followed the IUCN taxonomy (IUCN 2022), with the exception that we elevated C. (mitis) albogularis to species status, following several recent publications (Lo Bianco et al. 2017; Detwiler 2019; Shao et al. 2023).
We used MCMCTree (Yang 2007) for divergence time estimates. To make the analyses computationally feasible, we generated sequence alignments of 20 randomly sampled genomic windows from the filtered ASTRAL input for the autosomal analyses and 10 windows for the X-chromosome. Using a custom python script, genotypes were converted into haploid alignments by selecting a random allele at heterozygous sites. The windows were treated as partitions to allow for rate heterogeneity and we used the approximate likelihood calculation (usedata = 3). We applied fossil data calibrations with uniform prior distributions, using hard minimum and soft maximum bounds (2.5% probability of exceeding upper limit), following de Vries and Beck (2023), on 3 nodes: (i) the split between Cercocebus and Macaca (5.33 to 12.51 MYA), (ii) the split between the tribes Papionini (including Cercocebus and Macaca) and Cercopithecini (6.5 to 15 MY), and (iii) the oldest split within Cercopithecini (6.5 to 12.51 MYA). We used the HKY85 substitution model and ran 4 independent runs of 2,000,000 iterations, sampled every 100, and discarded the first 2,000 samples as burn-in. After confirming that the runs converged at similar age estimates, the 4 runs were combined and analyzed jointly. Convergence and ESS were assessed in R (R Core Team 2017).
Mitochondrial Genome Assembly and mtDNA Phylogenic Tree
The mitochondrial genomes were assembled using the MitoFinder pipeline (Allio et al. 2020). We trimmed adapter sequences from input reads using Trimmomatic (Bolger et al. 2014) and then ran MitoFinder with the metaspades assembler. Next, assemblies were rotated to the same starting position using a custom Python script, and aligned with MAFFT (Katoh et al. 2019). The alignment was visually inspected, and assembly errors from incomplete circularization leading to a short, duplicated sequence were corrected. The cleaned assemblies were then annotated with MitoFinder, using the annotation of Chlorocebus sabaeus (NC_008066.1) as a reference, and divided into 42 blocks as follows: Each of the 13 protein-coding genes were divided into 1st, 2nd, and 3rd codon position resulting in 39 blocks, the tRNAs were concatenated into a single block, and the 2 rRNAs were kept as 2 separate blocks. We used PartitionFinder2 (Lanfear et al. 2017) to find the optimal partitioning scheme. First, retaining all samples, we built a maximum likelihood tree with RaxML (Stamatakis 2014), with the GTRGAMMA substitution model and 1,000 rapid bootstraps. The obtained topology was then pruned to keep one sample per species, and divergence times were estimated with MCMCTree, using the likelihood function (–usedata 1). As this function is more computationally intense than the approximate likelihood, we ran 4 independent runs of 1,000,000 iterations, sampling every 50th and discarded the initial 2,000 samples as burn-in. The 4 runs converged to highly similar age estimates, and after merging we obtained good ESS (≥219) for 20/23 nodes, and acceptable ESS (≥181) for all nodes.
Phylogenetic Simulations to Explore the Role of ILS
To explore the probability that ILS could cause the observed topological conflicts between the nuclear and mitochondrial trees, we used msprime (Baumdicker et al. 2022) to simulate a demography mimicking the guenon radiation. We simulated a single lineage per species group/genus, using the divergence date estimates from the present study. The ancestral effective population sizes (Ne) of guenons were estimated in the approximate range of 100,000 to 250,000 by Kuderna et al. (2023), and since the mitochondrial genome has an Ne of 1/4th of the autosomal genome, we used a fixed Ne of 50,000, which is likely to be in the upper range of the true mitochondrial Ne for most lineages. We simulated a haploid sequence of 15,000 bp in 10,000 replicates. Next, we identified all unique topologies and quantified their relative frequencies using a custom Python script. Additionally, we measured the node distance between Erythrocebus (one of the lineages involved in a deep mitonuclear discordance) and its sister genus Chlorocebus in all replicates, to quantify the frequency of deep ILS (supplementary fig. S9, Supplementary Material online).
Y-chromosome Phylogenetic Tree
We identified males in our study dataset as samples with mapped read coverage on X/Y at approximately half of that across the autosomes. The Y-chromosomal genotypes were then filtered to obtain high-confidence consensus sequences for these samples by excluding sites where any female had a called genotype or any male was heterozygous. The filtered sites were concatenated into a single alignment, and RaxML was run using the same parameters as for the mitochondrial data.
Gene Flow
D-statistics
We used Dsuite (Malinsky et al. 2021) to calculate the D-statistics (Patterson et al. 2012) for autosomal biallelic SNPs for all possible trios of species in agreement with our inferred species tree (see Results), using the macaque as outgroup. For this analysis, we grouped the samples by species and focused only on interspecific gene flow. The only exception was C. mona, for which we kept the eastern and western lineages separate, as they were shown to have experienced differential gene flow and mitochondrial introgression with an unknown lineage (Ayoola et al. 2021). A significant D-value indicates gene flow between the mid-group (P3) and either of the in-group sisters P1 (negative D) or P2 (positive D). Since a single hybridization event can cause multiple significant D-values, additional steps were taken to identify hybridization events. First, we used a parsimonious approach to explain all significant D-values with as few gene flow events as possible: if all species of a particular clade produced similar D-values, we interpreted this as gene flow in their common ancestor. Second, we used an approach combining the methods of DFOIL (Pease and Hahn 2015) and the partitioned D-statistic (Eaton and Ree 2013), which uses a symmetrical 4-taxon topology plus an outgroup, e.g. (((A, B), (C, D)), Outgroup), and offers a more detailed understanding of the timing and directionality of gene flow. We used the following rationale: If gene flow occurs from C into B in this example topology, the shared ancestry between C and D will lead to significant D-values also between D and B, albeit lower than between C and B (i.e. when using A as P1, B as P2 and either D or C as P3, respectively). However, if gene flow occurred in the opposite direction, from B into C, there would be no excess allele sharing between B and D, but instead between A and C (due to the shared ancestry between A and B). DFOIL uses 4 different D-statistics (DFO, DIL, DFI, DOL), where the directionality of gene flow will result in various combinations of positive, negative, or nonsignificant D-values (Pease and Hahn 2015). The partitioned D-statistics (Eaton and Ree 2013) also make use of the shared ancestry between the respective sister lineages, such that if a positive D-value between D and B is solely driven by sites introgressing from C into B (here referred to as “carryover”-effects), there should be no introgression of alleles emerged on the D lineage after the split from C. Based on both these methods, we calculated D-statistics in a 2-step fashion for all significant quartets for which a symmetrical 4-taxon topology was available. In step 1, the baseline D-statistics were calculated for the 4 possible combinations (similar to the DFO, DIL, DFI, and DOL of DFOIL, except that we only considered sites where P3 had the derived allele, following Svardal et al. [2020]). In step 2, we used a custom Python script to exclude SNPs with shared alleles between either A and B (DFI and DOL) or C and D (DIL and DFO), thus removing any signal caused by shared ancestry, and then recalculated the 4 D-statistics with Dsuite. For example, we can consider the case of bidirectional gene flow between the mona and cephus group ancestors (Fig. 2). In addition to the positive D-statistics between these lineages (DFI and DIL) that are the result of direct gene flow, mona will introduce some alleles into cephus that it shares with its sister C. neglectus, returning a positive DFI, and cephus will, in turn, transfer some alleles to mona that it shares with the mitis group (positive DOL). The positive D-values resulting from these indirect effects disappear after step 2, as the shared alleles are removed.
Phylogenetic Networks
We used PhyloNetworks (Solís-Lemus et al. 2017), a model-based approach, to independently test for the gene flow events inferred from D-statistics. We used IQTree to construct ML trees in 25 kb windows, separated by 75 kb, to reduce linkage between windows. We applied the GTR model of evolution and 1,000 rapid bootstraps. Windows with <5,000 called sites across all samples were discarded. As network approaches quickly become computationally unfeasible with increasing taxa, and only first-level networks can be inferred with this approach (Solís-Lemus and Ané 2016), this method does not allow for testing all the identified events (see Results) in a single run. Therefore, we ran PhyloNetworks on subsections of the species tree (subsets of species), both to give an overview of the most pronounced gene flow events and test the support for each (supplementary figs. S14 to S21, Supplementary Material online). Ten runs were performed with hmax 0 to 4 to identify the optimal upper limit of hybridization events. Following this, we ran 30 additional runs with the optimal hmax and selected the network with the best likelihood score with a topology concordant with our inferred species tree.
Reconstructing Ancestral Chromosome Numbers
To identify which of the detected gene flow events occurred across karyotypes, we used ChromEvol, a Bayesian approach implemented in RevBayes (Höhna et al. 2016), to reconstruct the ancestral karyotypic states along the guenon species tree. All lineages/species with known chromosome numbers were used in this analysis (Sineo et al. 1986; Lo Bianco et al. 2017). First, we used equal rates of chromosomal gains and losses (delta ∼ dnExponential(10)) and ran 100,000 iterations, discarding 25% as burn-in. Second, since the karyotypic diversity of guenons has been attributed mainly to fissions (Moulin et al. 2008), we also performed 2 runs with higher probability of fissions than fusions (delta ∼ dnExponential(11 and 12)).
Characterizing and Comparing the Introgression Landscapes
To map the introgression landscape for all inferred gene flow events, we conducted a number of statistical analyses in nonoverlapping windows along the reference genome. We chose a window size of 25 kb for these analyses, which we considered adequately short given the ancient timing of gene flow but long enough to retain informative sites. We restricted the analyses to windows with at least 1,000 called genotypes and constructed neighbor-joining trees for each window using PhyML (Guindon et al. 2010). For each introgression event, we then used a custom Python script to classify the topology of each window into 1 of 5 categories: (i) “((P1/P2),P3)”; “species tree”, (ii) “((P2/P3),P1);” “ancestral introgression,” (iii) “((P1/P3),P2)”; “ILS control,” (iv) “((P1/P3_1),(P2/P3_2))”; “differential introgression” or (v) “complicated/other.” Note that the latter 2 trees only occur in cases where P3 or P2 contain more than one sample (either multiple samples per species or multiple species per group in case of ancestral introgression events). The relative abundance of these 5 topologies and their distribution along the genome was then visualized in R to infer the spatial distribution of introgressed regions.
We also investigated how local genomic ancestry relates to heterozygosity (as a rough proxy for recombination, see Results), by testing if topology category 1, 2, and 3 was associated with different levels of heterozygosity. Window heterozygosity for each sample was calculated using a custom Python script, the effect of topology was tested with analysis of variance (ANOVA) in R and post hoc Tukey's tests were applied where significant P-values (P < 0.05) were retrieved. P-values from the Tukey's test were corrected for multiple testing using the Benjamini and Hochberg method (Benjamini and Hochberg 1995).
Next, we used the python scripts ABBABABAwindows.py and popgenWindows.py (https://github.com/simonhmartin/genomics_general) to calculate FD and nucleotide divergence (DXY), respectively, along the reference genome, for each event. FD is related to the D-statistic and estimates discordant allele-sharing patterns in a 4-taxon topology but is more robust in short genomic windows where data is sparse (Martin et al. 2015). To assess whether windows harbored similar levels of introgression among independent gene flow events, we used R to calculate Pearson's correlations of FD in all pairwise combinations of gene flow events. To investigate gene content of introgressed regions and to reduce the risk of false positives, we required a number of criteria to be fulfilled: FD ≥ 99th percentile of the genome-wide FD, topology classified as category 2 (“introgressed”), DXY P2–P3 < DXY P2–P1, and, since FD tend to be higher in regions of low absolute divergence (Martin et al. 2015), DXY P1–P3 > 10th percentile of genome-wide divergence. Consecutive windows were merged, and protein-coding genes overlapping and contained within 50 kb up and downstream such regions were identified using the Mmul_10 annotation. The lists of genes were analyzed for GO enrichments using the online tool PANTHER (Ashburner et al. 2000; Mi et al. 2021). We used the human annotation database, included all annotated protein-coding genes in the macaque annotation as a reference list, and restricted the analyses of GO-terms to biological processes.
We also specifically investigated long genomic regions with low levels of introgression, as this indicates that introgressed alleles were purged rapidly after hybridization and suggests a potential role in reproductive isolation. We call such regions “introgression deserts,” defined as a region of at least 500 kb (≥20 consecutive windows) with FD below the genome-wide average, allowing for a maximum of 5% of windows with missing data. Gene content was assessed and analyzed in the same way as for highly introgressed regions.
The Effect of Introgression on Species Divergence Time Estimates
To investigate if introgression affected the species divergence time estimates, we recalculated divergence times using sequence data from 20 windows, 25 kb in length, windows, randomly sampled from 3 different sets of windows depending on the levels of local introgression (FD) between cephus and mona: (i) low introgression, FD < 25th percentile, (ii) random, and (iii) high introgression, FD > 75th percentile. MCMCTree was used to estimate divergence times with the same settings as for the species tree.
Coevolution/introgression of Mitonuclear Genes
To investigate if the coevolution of nuclear genes facilitated mitochondrial introgression, we focused on the mitochondrial introgression event from the cephus group ancestor into A. lhoesti/preussi. This event stands out in 2 ways: (i) it occurred across branches separated by at least 5 MY (according to the mitochondrial divergence dates closer to 9 MY) and (ii) A. solatus, the sister of A. lhoesti/preussi, retained the ancestral mtDNA genome and thus provides an opportunity for comparative analyses. We compiled a list of 199 nuclear-encoded genes with reported mitochondrial function (Signes and Fernandez-Vizarra 2018; Bailey and Stevison 2021; supplementary table S3, Supplementary Material online). Next, we constructed control gene sets by sampling one gene from the remaining protein-coding genes for each N-mt gene, requiring that they have the same gene length ±10%. This process was repeated 100 times with replacement, retrieving 100 control gene sets of 199 genes each. We calculated FD and DXY for each gene set with popgenWindows.py and ABBABABAwindows.py (https://github.com/simonhmartin/genomics_general). Fd was calculated for both A. lhoesti/preussi and A. solatus as P2, using all members of the cephus group as P3, Allenopithecus nigroviridis as P1 and M. mulatta as outgroup. DXY was calculated across 3 pairs: A. lhoesti/preussi versus cephus group, A. lhoesti/preussi versus A. solatus, and A solatus versus cephus group. If N-mt genes coevolved with the introgressed mtDNA genome, we expect to find a stronger signal of cephus group introgression in these genes compared with control genes in A. lhoesti/preussi, but no such pattern in A. solatus. This would also lead to lower DXY between A. lhoesti/preussi and the cephus group but increased DXY between A. lhoesti/preussi and their sister A. solatus in the N-mt genes.
We also counted private cephus group SNPs in A. lhoesti/preussi in relation to A. solatus. This was done to assess fine-scale variation that may have facilitated the mitochondrial introgression. A custom python script was used to identify and count SNPs in 2 categories: Category 1: A. lhoesti/preussi fixed for the same allele as the cephus group, whereas A. solatus and Chlorocebus spp. are fixed for the alternative allele (a nuclear pattern that is concordant with mtDNA genome ancestry), Category 2: A. solatus fixed for the cephus group allele, A. lhoesti/preussi and Chlorocebus spp. fixed for the alternative allele (discordant with mtDNA genome ancestry). The number of SNPs in each category was then compared between N-mt and control genes, and the predicted impact of these mutations was estimated using the Ensembl Variant Effect Predictor (McLaren et al. 2016).
Supplementary Material
Supplementary material is available at Molecular Biology and Evolution online.
Acknowledgments
We thank Christophe Escudé, Laurianne Cacheux, and Bertrand Bed’Homme at the Muséum National d’Histoire Naturelle, Paris, for providing guenon cell culture samples, and Jean-Pierre Gautier for tissue samples that form the bulk of data used in this project, as well as Mareike Janiak, Tom van der Valk, Simon Martin, and Konrad Lohse for bioinformatic support and helpful discussions. The computations were enabled by resources in projects SNIC 2022/6-325 and SNIC 2022/5-561, provided by the Swedish National Infrastructure for Computing (SNIC) at Uppsala University (UPPMAX), partially funded by the Swedish Research Council through grant agreement no. 2018-05973. The project was supported by the Swedish Research Council VR (2020-03398) to K.G., Zoologiska Stiftelse grants to A.J., and a UKRI NERC Standard grant (NE/T000341/1) to D.d.V and R.M.D.B.
Author Contributions
Conceptualization: A.J., K.G., Methodology and analyzes: A.J., K.G., F.S., D.d.V., R.B.; Sample acquisition: K.G., L.F.K.K., S.K., I.S.C., J.D.K., A.C.K., K.F., J.R., T.M.-B., C.R.; Writing—original draft: A.J., K.G.; Writing—review and editing: all authors.
Data Availability
The sequencing data used in this project are available on the European nucleotide archive (https://www.ebi.ac.uk/ena), under accession numbers as listed in supplementary table S1, Supplementary Material online. Custom scripts used for data analyses are available at (https://github.com/axeljen/guenon_phylogenomics).
References
Author notes
Conflict of interest statement. Employees of Illumina, Inc. are indicated in the list of author affiliations. All other authors declare no conflict of interest.
