


Abstract
Genetic variation and phenotypic plasticity are both important to adaptive evolution. However, how they act together on particular traits remains poorly understood. Here, we integrated phenotypic, genomic, and transcriptomic data from two allopatric but closely related congeneric oyster species, Crassostrea angulata from southern/warm environments and Crassostrea gigas from northern/cold environments, to investigate the roles of genetic divergence and plasticity in thermal adaptation. Reciprocal transplantation experiments showed that both species had higher fitness in their native habitats than in nonnative environments, indicating strong adaptive divergence. The southern species evolved higher transcriptional plasticity, and the plasticity was adaptive, suggesting that increased plasticity is important for thermal adaptation to warm climates. Genome-wide comparisons between the two species revealed that genes under selection tended to respond to environmental changes and showed higher sequence divergence in noncoding regions. All genes under selection and related to energy metabolism exhibited habitat-specific expression with genes involved in ATP production and lipid catabolism highly expressed in warm/southern habitats, and genes involved in ATP consumption and lipid synthesis were highly expressed in cold/northern habitats. The gene for acyl-CoA desaturase, a key enzyme for lipid synthesis, showed strong selective sweep in the upstream noncoding region and lower transcription in the southern species. These results were further supported by the lower free fatty acid (FFA) but higher ATP content in southern species and habitat, pointing to significance of ATP/FFA trade-off. Our findings provide evidence that noncoding variation and transcriptional plasticity play important roles in shaping energy metabolism for thermal adaptation in oysters.
Introduction
Genetic variations, as well as phenotypic plasticity, in which a single genotype produces different phenotypes under different conditions, are both important for organisms to respond to and survive in changing environments (Davis et al. 2005; Gienapp et al. 2008; Whitman and Agrawal 2009; Chevin et al. 2010; Kelly 2019). Plasticity could increase the likelihood of species surviving challenging environments, altering traits toward the phenotypic optimum, and allowing more time for selection to act on genetic variation (Pfennig et al. 2010; Ghalambor et al. 2015; Fischer et al. 2016; Levis and Pfennig 2016). The regulation of energy metabolism is a significant part of the plastic response to climatic gradients (Sokolova et al. 2012; Schulte 2015), especially for the temperature-driven divergence of marine ectothermic species (Freitas et al. 2010; Sarà et al. 2012; Sussarellu et al. 2016). Understanding the genomic architecture of plastic genes related to the stress response and the contribution of plasticity to environmental adaptation is critical for assessing the adaptive capacity of organisms in the context of rapid climate change, especially for stationary marine invertebrates with limited mobility. The integration of genomic and transcriptomic data allows us to determine whether environmentally responsive genes disproportionally exhibit high levels of variation among species or populations across spatially and temporally heterogeneous environments.
Sessile oysters living in the intertidal zone provide an interesting model for investigating adaptive evolution under highly dynamic environments and rapid climate change. Although many investigations have indicated the critical role of energy homeostasis in oyster adaptation (Sussarellu et al. 2016; Li et al. 2017; Li L, Li A, Song, et al. 2018), an understanding of the regulatory pathways linking genomic variation, gene expression, and fitness-related traits is lacking. Two allopatric but closely related Crassostrea oysters, C. gigas and C. angulata, which diverged approximately 2.7 Ma (Ren et al. 2010), are naturally distributed along the northern and southern coasts of China, separated by Yangtze River, and adapted to cold and warm climates, respectively (Wang et al. 2008, 2010). Previous studies have shown that the two species have evolved divergent responses to acute (several hours) high temperature stress, where the southern oyster exhibited higher Arrhenius break temperature, higher metabolic rate, and higher plasticity in energetic parameters and gene expression than the northern species (Li et al. 2017, 2019; Ghaffari et al. 2019). With the availability of reference genome for C. gigas (Zhang et al. 2012), it is now possible to explore genomic variations underlying energy metabolism and regulation that may mediate plasticity and thermal adaptation.
In this study, we integrated phenotypic, genomic, and transcriptomic data following reciprocal transplantation and acute heat challenges in the laboratory to investigate the roles of genetic divergence and plasticity in thermal adaptation of two oyster species. We conducted coexpression and selective sweep analyses to identify genes responding to environmental transplantation and thermal stress, and the link between selection and transcriptional plasticity. Our findings provide a genomic basis for the interaction between genetic variation and plasticity in adaptive responses to warm climates.
Results
Phenotypic and Transcriptional Divergence for Warm Adaptation
F1 progeny of C. angulata and C. gigas were produced from wild adult oysters collected from the intertidal zones of the southern and northern habitats, respectively, and used in common garden experiments to alleviate environmental effects (Sanford and Kelly 2011; Somero 2012). To assess their divergence in transcriptomic and phenotypic responses to environmental change, 8-month-old F1 progeny of both species were deployed in northern and southern habitats and evaluated after two months of reciprocal transplantation in their native and nonnative environments (Li et al. 2019). The average sea surface temperature (SST) of the southern habitat (22.0 °C) was significantly higher than that of the northern habitat (15.3 °C, P < 0.01, supplementary fig. S1a, Supplementary Material online), as well as the air temperature (24.4 °C and 15.5 °C, respectively) (Li et al. 2017). Both species grew faster and had a greater wet weight in their native habitats than in their translocated nonnative habitats (P < 0.01). When transplanted to the same environment, the native species showed a higher wet weight than the nonnative species (P < 0.01, fig. 1a). Both oyster species had higher survival in their native habitats than in their translocated or nonnative habitats (P < 0.05, supplementary fig. S2, Supplementary Material online). When challenged with an acute heat (42 °C for 1 h) stress in the laboratory, oysters of both species that had been in nonnative habitats for two months showed higher mortality than those from native habitats (P < 0.01, fig. 1b). These findings suggest that the two species are locally adapted, grow, survive, and respond to heat stress better in their native habitats than in their translocated habitats.
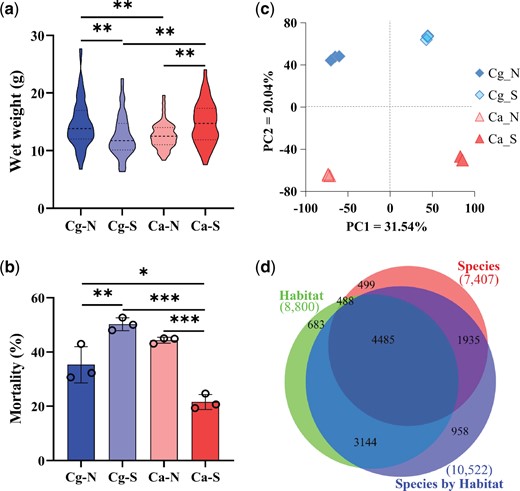
Phenotypic and transcriptomic divergence between the northern Crassostrea gigas and southern C. angulata. (a) Wet weight and (b) mortality postheat stress of 10-month-old F1 progeny of C. gigas and C. angulata from northern and southern habitats. (c) Principal component analysis (PCA) plot of transcriptional expression of the two species in northern and southern habitats. (d) Venn diagram of the number of genes that were differentially expressed due to species, habitat, and their interactions. Overlaps indicate genes differentially expressed under multiple factors. Ca, C. angulata; Cg, C. gigas; N, northern habitat; S, southern habitat. Cg_N and Ca_S indicate oysters in their native habitats. Asterisks indicate significant differences (*P < 0.05, **P < 0.01, and ***P < 0.001). Error bars represent SD values.
To assess transcriptomic divergence, the F1 progeny of the two species deployed in their native and translocated habitats were sampled for RNA-seq (supplementary table S1, Supplementary Material online). A total of 31.6–39.7 million clean reads per sample pool were obtained, covering 26,090 of the 28,027 genes in the C. gigas genome. The average mapping rate to the C. gigas reference genome (Zhang et al. 2012) was slightly higher for C. gigas (74.1 ± 1.0%) than C. angulata (71.9 ± 1.4%) (P < 0.05, Student’s t-test, supplementary table S2, Supplementary Material online). To test whether genomic divergence influences basal gene expression, we explored the relationship between the difference in nucleotide diversity (π) and the difference in expression level (FPKM) at native conditions between the two species for all genes in the genome. No significant association was detected (P > 0.05, supplementary fig. S3, Supplementary Material online), indicating that genomic divergence had no influence on basal gene expression for the two species in our study. Genome-wide gene expression was found to exhibit significant divergence between the two species under natural conditions (PC2 = 20.04%) and between native and translocated habitats (PC1 = 31.54%) (fig. 1c). To further assess their response to heat stress, oysters of the two species from native and nonnative habitats were subjected to sublethal heat (35 °C for 6 and 24 h) stress. Transcriptomic analysis revealed significant differences in responses to heat stress between species and habitats (supplementary fig. S4, Supplementary Material online). In addition, we characterized differentially expressed genes (DEGs) according to the species (two species in the same habitat), habitat (the same species in two habitats), and their interactions (two species in different habitats). Of the 12,192 DEGs (43.50% of the gene repertoire), 7,407 (26.43%) were differentially expressed between the two species, 8,800 (31.4%) between the two habitats, and 10,522 (37.54%) due to species–habitat interactions (fig. 1d).
Increased Transcriptional Plasticity in Thermal Adaptation
To investigate the role of plasticity in adaptive divergence between the two species, transcriptomic plasticity in response to habitat translocation was quantified via discriminant analysis of principal components (DAPC) (Jombart et al. 2010) using genes expressed at a minimum of 10 unique reads in more than 90% of individuals (n = 18,336). The southern species exhibited significantly greater transcriptional plasticity than the northern species when transplanted to nonnative habitats (PMCMC < 0.01, supplementary fig. S5, Supplementary Material online). Most importantly, under acute sublethal heat stress in the laboratory, the southern species showed significantly higher plasticity than the northern species, regardless of whether the oysters were from native or nonnative habitats (fig. 2a, PMCMC < 0.05, supplementary table S3, Supplementary Material online). We also examined the transcriptional plasticity of the three types of DEGs due to species, habitat, and their interactions. The southern species consistently showed higher plasticity in gene expression than the northern species for all three types of DEGs (supplementary fig. S6, Supplementary Material online, Wilcoxon signed-rank test, P < 0.001), which further supports the higher plasticity observed in the southern species.
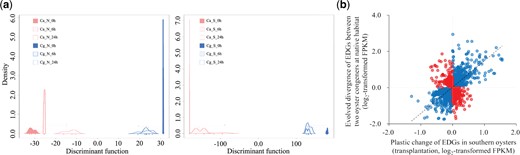
Characterization of transcriptomic plasticity. (a) Discriminant analysis of principal components (DAPC) for variation in transcriptomic plasticity in response to acute heat stress of two oyster species from northern (N, left) and southern (S, right) habitats. Ca, C. angulata; Cg, C. gigas. Cg_N and Ca_S indicate oysters in their native habitats. (b) A scatter plot of the plasticity (changes in gene expression of Crassostrea angulata in response to transplantation) against evolutionary divergence (EDGs, changes in gene expression between two species in their native habitats). Light-blue dots denote genes exhibiting adaptive plasticity, whereas pink dots denote nonadaptive genes.
To further understand the role of higher plasticity in the adaptation of the southern oyster, we evaluated whether plasticity is adaptive or nonadaptive (Ghalambor et al. 2015; Fischer et al. 2016; Li L, Li A, Song, et al. 2018). Evolutionarily divergent genes (EDGs) were defined as genes with divergent expression between species in the same environment (Cg_N vs. Ca_N and Cg_S vs. Ca_S) and species in their native habitats (Cg_N vs. Ca_S). A total of 1,616 genes were identified as EDGs (supplementary fig. S7, Supplementary Material online). With 183 genes showing low expression in more than 90% of individuals excluded, the remaining 1,433 EDGs not only showed divergent expression patterns between the two species, but also responded to environmental transplantation in both species (supplementary fig. S8, Supplementary Material online). A robust positive correlation between evolved divergence in comparison to northern species and transcriptional plasticity in response to transplantation was observed in the southern species (ρ = 0.51, P < 0.001, fig. 2b). The majority of EDGs (1,060 of 1,433 or 74.0%) exhibited an evolutionary response in the same direction as plastic changes (in fig. 2b). In addition, EDGs contained higher proportion (140 of 1,616) of genes under selection than all genes in the genome (1,401 of 28,027, see Materials and Methods) (P < 0.01, χ2 test).
Thermal Adaptation-Related Gene Coexpression Modules
We implemented weighted gene coexpression network analysis (WGCNA) (Langfelder and Horvath 2008) to investigate the relationship between gene expression in the two species (in northern and southern habitats and under unstressed and heat stressed conditions) and three binarily coded categorical traits (0 or 1) related to thermal stress (normal [unstressed] and thermal stress [6 and 24 h]), species, and habitat (northern and southern). A soft-thresholding power of 14 was selected, which is the lowest power at which the scale-free topology fit index reached 0.80 (supplementary fig. S9, Supplementary Material online). Highly expressed genes were assigned to 16 coexpression modules (represented by 16 color identifiers in fig. 3a). We focused on four modules that were most positively or negatively associated with the three factors (fig. 3a) according to the module-trait analysis (supplementary fig. S10, Supplementary Material online). Genes in the black (n = 619), green (n = 929), and turquoise (n = 2,907) modules were significantly correlated with species (ρ = 0.99, P < 0.001), habitat (ρ = 0.92, P < 0.001), and thermal stress for 24 h (“heat24h”, ρ = 0.78, P < 0.001), showing higher expression levels in the northern species (fig. 3b), in northern environment (supplementary fig. S11, Supplementary Material online) and under thermal stress for 24 h (supplementary fig. S12, Supplementary Material online), respectively. Genes in the yellow module (n = 1,227), which were the most positively associated with unstressed conditions (ρ = 0.58, P < 0.001) and negatively associated with thermal stress for 24 h (ρ =−0.92, P < 0.001), showed higher expression levels under unstressed conditions, and lower expression after 24 h thermal stress in the two species at both habitats (supplementary fig. S13, Supplementary Material online).
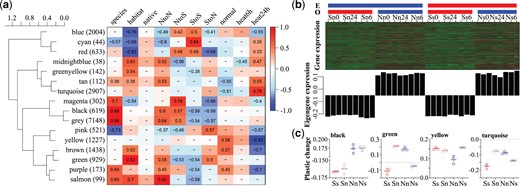
Association analysis between eigengene expression and qualitative traits. (a) Clustering of module eigengenes and heat maps of module–trait correlations. Number in parentheses is the number of genes in each module. Blue indicates a negative correlation and red indicates a positive correlation. Pearson’s R is reported for significant correlations (P < 0.05). “species,” “habitat,” “native,” “NtoN,” “NtoS,” “StoS,” “StoN,” “normal,” “heat6h,” and “heat24h” are binarily coded categorical traits, indicating the species (Crassostrea gigas = 1, C. angulata = 0), habitat (north = 1, south = 0), oysters cultured in the native (1) or nonnative (0) site, northern species cultured in the north (1, otherwise 0), northern species cultured in the south (1, otherwise is 0), southern species cultured in the south (1, otherwise 0) and southern species cultured in the north (1, otherwise 0), oysters were not stressed (1, otherwise 0), oysters were heat stressed for 6 h (1, otherwise 0) and for 24 h (1, otherwise 0), respectively. (b) Expression of candidate genes in black eigengene module that associated with species. The top panels are heatmaps of all genes assigned to black module in each individual. E and O indicate culturing and origin environments (north, blue; south, red), respectively. 0, 6, and 24 indicate unstressed, thermal stressed for 6 and 24 h, respectively. The bottom panels show the expression of eigengenes in each individual. (c) Plastic changes of eigengene expression of four modules in two oyster species in response to environmental transplantation. Uppercase S and N indicate southern and northern oyster species and lowercase s and n indicate south and north environments, respectively. Nn and Ss indicate oysters in their native habitats. Error bars represent SD values.
All genes in the four eigengene modules responded to environmental transplantation in the two species. Although the magnitudes of the changes in expression of the yellow eigengenes were greater in the northern species, changes in the other three modules, black, green, and turquoise, were notably higher in the southern species when translocated to nonnative environments (fig. 3c). This result is consistent with the finding that the southern species have higher transcriptional plasticity at the genome-wide level.
We performed functional enrichment analysis for genes from four eigengene modules which significantly clustered GO terms related to energy metabolism and stress response (P < 0.05, supplementary table S5, Supplementary Material online). GO terms involved in fatty acid metabolism (GO:0006631) and chaperone-related protein folding (GO:0051085 and GO:0061077) were enriched in the black module related to the species (supplementary table S5a, Supplementary Material online). GO terms involved in responses to temperature (GO:0009266), heat (GO:0009408), and abiotic stimulus (GO:0009628) were enriched in the green module related to the habitat, as well as those responsible for ATP metabolism (GO:0046034) and tricarboxylic acid transport (GO:0006842) (supplementary table S5b, Supplementary Material online). Interestingly, GO terms related to responses to temperature, heat, and abiotic stimuli, and ATP metabolism were also identified in the turquoise module related to thermal stress for 24 h, as well as those involved in lipid (GO:0044255) and glycogen (GO:0005977) metabolism (supplementary table S5d, Supplementary Material online). In addition, for the EDGs identified above, protein folding, ATP, and fatty acid metabolic processes were significantly enriched (P < 0.05, supplementary table S5e, Supplementary Material online). Moreover, a total of 53 genes belonging to the heat shock protein family (hsp), especially hsp70s (n = 47) (supplementary table S4a, Supplementary Material online), were identified in these modules associated with species, habitat, and thermal response. Although many biological processes are involved in thermal adaptation, pathways regulating energy metabolism appear to be the most prominent (Guo et al. 2015; Zhang et al. 2016).
Selective Sweeps in the Genome
Whole-genome resequencing data from 26 northern C. gigas and 21 southern C. angulata (Li L, Li A, Song, et al. 2018) (accession number PRJNA394055) collected from the same sampling sites used in this study were used to identify potential selective sweeps. We identified 14,664,035 high-quality SNPs and 3,687,476 indels, averaging 25.0 SNPs and 6.3 indels per kilobase. The paired overall average FST (fixation index) between the two species was 0.076 (ranging from 0 to 0.64), which was much greater than that among populations of C. gigas (the maximum FST was 0.042) (Li L, Li A, Song, et al. 2018). Genomic regions with the largest divergence in FST (top 5% FST > 0.22, supplementary fig. S14a, Supplementary Material online) and nucleotide diversity (top and bottom 5% θπ ratio: >1.19, or <0.67, supplementary fig. S14b, Supplementary Material online) were defined as regions with selection signals (see Materials and Methods). The number of regions under selection with low and high θπ ratios (fig. 4a) was 10,426 and 1,550, spanning 29.31 Mb and covering 1,195 and 225 genes, respectively (supplementary table S4b and c, Supplementary Material online). The π for the whole genome was significantly higher in the northern oyster than in the southern oyster (supplementary fig. S15, Supplementary Material online, P < 0.001, Wilcoxon signed-rank test). In the selective sweep regions presented on the left, southern oysters showed significantly lower selection statistics (median Tajima’s D = −0.56, P < 0.001, Wilcoxon signed-rank test), whereas northern oysters showed significantly lower selection statistics for selective regions presented on the right (median Tajima’s D =−0.02, P < 0.001) (fig. 4b).
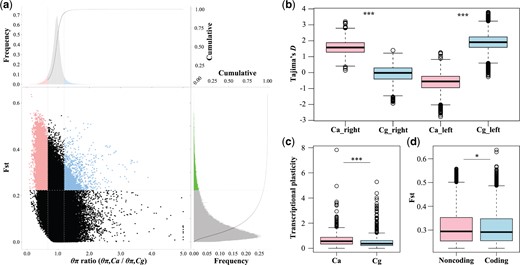
Genomic regions with selective sweep signals in two oyster species Crassostrea gigas and C. angulata. (a) Distribution of θπ ratios (θπ,Ca/θπ,Cg) and FST values, which are calculated in 10-kb windows sliding in 1-kb steps. Data points located above the horizontal dashed line (the 5% right tail of the empirical FST distribution, where FST is 0.22), and to the left and right of the left and right vertical dashed lines (corresponding to the 5% left and right tails of the empirical θπ ratio distribution, where the θπ ratios are 0.67 and 1.19, respectively), were identified as regions under selection in southern C. angulata (pink points) and northern C. gigas (light blue points), respectively. (b) Selection statistics of Tajima’s D in right and left selective regions for each species. (c) Transcriptional plasticity (log2-fold change of expression between two habitats) of genes under selected in response to environmental transplantation in two species. (d) FST values for coding and noncoding regions of genes under selection between the two species (pink and light blue points of panel a). Cg, C. gigas; Ca, C. angulata. Asterisks indicate significant differences (*P < 0.05 and ***P < 0.001).
More than half of the genes identified by selective sweep analysis exhibited differential expression due to the effects of species, their habitat, and their interactions (771 of 1,401 or 55.03%), which was significantly higher than that at the genome-wide level (P < 0.01, χ2 test). The majority of the DEGs (96.76%, n = 746) were differentially expressed due to different environments (75.88%, n = 585) or their interaction with species (89.23%, n = 688) (supplementary fig. S16, Supplementary Material online), indicating that natural selection mainly acts on environmentally responsive loci. The transcriptional plasticity of these genes in the southern species was significantly higher than that in northern oysters in response to transplantation (26.11%, P < 0.001, fig. 4c). Although the FST values in coding regions were significantly higher than those in noncoding regions for all genes in the genome (P < 0.001, Wilcoxon rank sum test, supplementary fig. S17, Supplementary Material online), the FST values in noncoding regions were significantly higher than those in coding regions for genes under selective sweep identified here (P < 0.05, fig. 4d).
Environmentally Responsive Genes in Energy Metabolism
Functional enrichment analysis of genes under selection identified 77 enriched GO terms covering 281 genes (P < 0.05, supplementary table S5f, Supplementary Material online), most of which exhibited transcriptional plasticity in response to environmental transplantation within species (supplementary fig. S18, Supplementary Material online). Consistent with enrichment results of genes in eigengene modules associated with species, habitat and thermal stress, GO terms and genes for energy metabolism including lipid and ATP related metabolic processes, were also significantly enriched among genes under selection (P < 0.05, supplementary table S5f, Supplementary Material online), pointing to their significance. Thus, they were selected for further analyses.
A total of 29 genes under selection were associated with GO terms for lipid (GO:0006629, n = 20) and ATP (GO:0046034, n = 9) metabolic processes, 15 of which responded to environmental transplantation in the two species and exhibited significant differential expression between northern and southern habitats (fig. 5a, P < 0.05, supplementary table S4d, Supplementary Material online). In other words, all 15 genes showed strong evidence of genetic divergence and transcriptional plasticity in response to environmental changes. About 13 of the 15 genes (87%) exhibited higher plastic changes in the southern species than in the northern species in response to environmental transplantation (supplementary fig. S19, Supplementary Material online). Selected regions in most of these genes (11 of 15) were located in the upstream or downstream noncoding regions (supplementary fig. S20, Supplementary Material online). An identical pattern was also found in hsp genes, which exhibited higher transcriptional plasticity in the southern species and higher sequence divergence in upstream or downstream noncoding regions (supplementary figs. S21 and S22, Supplementary Material online).
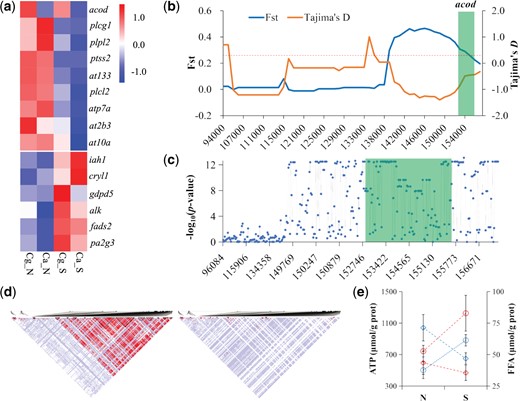
Characterization of environmentally responsive genes with selective signals associated with lipid and ATP metabolisms and related phenotypes. (a) Heatmaps for genes with selective signals that are highly expressed at northern (up) and southern (bottom) environments. (b) FST and Tajima’s D values of acod along the coding (marked in green), upstream and downstream noncoding regions. FST values and Tajima’s D values are plotted using a 10-kb sliding window. Numbers along the x axis indicate positions in the corresponding scaffold. Dashed line indicates top 5% significance level of FST values, where FST is 0.22. (c) Divergence for genotype frequency of SNPs in coding (marked in green), upstream and downstream noncoding regions of acod between the two species. The y axis represents log(10) transformed P value of χ2 test. (d) Linkage disequilibrium (LD) blocks in acod flanking regions (as depicted in b) in the southern Crassostrea angulata (left) and northern C. gigas (right). The red boxes indicate transcription start site (TSS). (e) ATP and free fatty acid (FFA) content of two species cultured at northern and southern habitats. Red and blue dashed lines indicate the northern and southern oyster species, and circles and diamonds indicate the content of ATP and FFA, respectively. Error bars represent SD values. Ca, C. angulata; Cg, C. gigas; N, northern habitat; S, southern habitat. Cg_N and Ca_S indicate oysters in their native habitats.
Most importantly, all of the genes involved in energy metabolism under selection showed habitat-specific expression in both species. The majority of genes involved in ATP consumption (at10a, atp7a, at2b3, and at133) and lipid synthesis (acod, plcl2, and ptss2) were highly expressed in colder northern habitats, whereas many genes involved in ATP production (alk) and lipid catabolism (gdpd5, iah1, pa2g3, and cryl1) were highly expressed in warmer southern habitats in both species (fig. 5a). As an example, the gene acyl-CoA desaturase (acod), which encodes a key enzyme for lipid biosynthesis, was under selection and showed higher levels of expression in the colder northern habitat than in the warmer southern site in both species; and the northern species showed higher levels of expression than the southern species regardless of habitat (fig. 5a). We found that the adjacent 14 kb upstream noncoding region of acod showed high divergence between the two species with an average FST value of 0.42, and strong signals for recent selection sweep in the southern species (Tajima’s D, median =−1.21) (fig. 5b). Loci (SNPs) in this region showed significant differentiation between the northern and southern species (fig. 5c, P < 0.01, χ2 test). Moreover, loci under selection in this region exhibited strong linkage disequilibrium (LD) in the southern species, especially for a block around the transcriptional start site (TSS), whereas LD in the same region was weak in the northern species (fig. 5d). Furthermore, the southern species had a lower free fatty acid (FFA) content but higher ATP content than the northern species at both sites. In addition, lower FFA but higher ATP contents were detected at the warm/southern site, whereas higher FFA and lower ATP contents were detected at cold/northern sites for both species (fig. 5e), suggesting an evolutionary trade-off between ATP and FFA contents.
Discussion
This study reveals adaptive divergence between two closely related oyster species by integrating whole-genome resequencing, transcriptomic and phenotypic data. Both species showed patterns of faster growth and lower mortality in their native habitats compared with nonnative habitats, confirming that they are well adapted to their native habitats. Temperature is likely to be one of the major forces driving adaptive divergence between the two species, as they live in southern and northern waters at similar salinity and tidal depths but with significantly different temperatures (Li et al. 2017, 2019; Gagnaire et al. 2018; Ghaffari et al. 2019). The notable differentiation in the transcriptional response to heat stress between the two species supports thermal adaptation as the primary force underlying their divergence. Furthermore, more DEGs due to the interactions between species and habitat was found to contribute to transcriptional divergence between the two species, in contrast to the prominent effect of environment (salinity gradients) on transcriptional divergence observed between intraspecific populations of the Eastern oyster Crassostrea virginica (Eierman and Hare 2016). If species differences represent genetic divergence and habitat difference represents plasticity, our results suggest that both genetic divergence and plasticity are important for the adaptation of oysters. In addition, more DEGs due to the interactions indicate genes that were environmentally responsive were heavily involved in species divergence and adaptation. In other words, genetic divergence may favor or work in concert with plasticity to facilitate thermal adaptation (Kelly 2019).
The observation that warm-adapted southern species has higher plasticity in response to elevated temperatures in both native and nonnative habitats implies that its higher plasticity is genetic and important for its adaptation to warm climates (Waddington 1953; Crispo 2007). Moreover, for different types of DEGs identified between species, habitats, and due to their interactions, and from different eigengene modules, the southern species also exhibited higher transcriptional plasticity when translocated to nonnative habitats. The exception that the yellow eigengene module showed higher transcriptional plasticity in the northern species may be due to a particular set of genes. High plasticity has been widely demonstrated in corals (Kenkel et al. 2013; Kenkel and Matz 2016), mussels (Gracey et al. 2008), and oysters (Li A, Li L, Wang, et al. 2018; Li L, Li A, Song, et al. 2018) in adaptation to complex conditions associated with intense environmental fluctuations. Along with previous studies, our results indicate that sessile organisms living in the intertidal zone, such as oysters, may depend on increased plasticity to cope with dynamic fluctuations in environmental conditions, since they cannot rely on avoidance.
A positive correlation between evolutionary divergence and plastic changes means that the plasticity is adaptive (Ghalambor et al. 2015; Fischer et al. 2016). This positive correlation was also strong in oyster populations from different environmental gradients, especially with regards to temperature and salinity (Eierman and Hare 2016; Li A, Li L, Wang, et al. 2018; Li L, Li A, Song, et al. 2018), as well as in other aquatic animals (Fraser et al. 2014; Makinen et al. 2016; Kelly et al. 2017), where plasticity is adaptive. Adaptive plasticity enhances fitness in new environments and facilitates adaptive evolution over time. Given the increased mortality of southern oysters in northern environments, higher plasticity did not reach the fitness optimum that was needed to prevent evolutionary change by buffering against natural selection. Instead, higher plasticity enabled evolutionary rescue by providing time (or increased likelihood of survival) and allowing southern oysters to move closer to a changing optimum (Fischer et al. 2016). Thus, our finding of higher plasticity in the southern species supports the notion that plasticity is evolved and plays a significant role in the adaptation of the southern species to a warm climate, and that adaptively increased plasticity may facilitate evolutionary rescue in a changing climate, enhancing adaptive capacity of organisms migrating to novel environments (Pfennig et al. 2010; Levis and Pfennig 2016; Kelly 2019).
Significant divergence in genomic variation supports the phenotypic and transcriptional differences observed, indicating that strong selection underpins adaptive divergence between the two oyster species (Wang et al. 2016; Li et al. 2017, 2019; Gagnaire et al. 2018; Ghaffari et al. 2019). Both directional and balance selections were important in the divergence of oysters (Guo et al. 2018), whereas more genes in the southern species were found to be under directional selection in this study. We hypothesize that the southern environment, especially at high temperatures, has imposed strong selection pressure on C. angulata compared with the northern environment on C. gigas. Moreover, higher FST values in noncoding regions suggest that selection may preferentially target noncoding or regulatory regions. Selection may favor divergence in noncoding regulatory regions, which would affect the binding of transcription factors and consequently modify gene expression, leading to differences in transcriptional plasticity upon environmental changes (Grishkevich and Yanai 2013; Kelly 2019). Our findings provide a link between genetic variation (particularly in noncoding regions) and transcriptional plasticity, whose interactions provide a genomic basis for adaptive responses to climate change (Chevin et al. 2010; Kelly 2019).
Genes participating in ATP and lipid metabolism were found to be under selection, enriched or overrepresented among genes under selection, and associated with differential expression due to species, habitat, and thermal stress. Most of the genes showed habitat-specific expression patterns and strong selective sweeps in the noncoding region, suggesting that directional selection leads to significant divergence that is responsible for the expression alteration in adaptation to a warm climate. The transcriptional downregulation of acod, a gene encoding a key enzyme for lipid biosynthesis, in the southern environment and in the southern species provides insights into how lipid metabolism participates in thermal adaptation. Fatty acid synthesis is known to be highly dependent on acod gene expression (Miyazaki et al. 2001), which is often upregulated in cold environments (Lee et al. 2004). The regulation of lipid content is also important for adaptive divergence within species, where C. gigas from highly stressful environments have lower lipid content, and those from moderate environments prefer storing lipids (Li L, Li A, Song, et al. 2018). This adaptive strategy was also found in other species where organisms inhabiting cold environments prefer storing lipids as the primary energy source (Liu et al. 2014). Integrating the observation of a higher FFA content in northern species and habitat but a higher ATP content in southern species and habitat, our results indicated that the regulation of energy homeostasis between ATP and lipid trade-off is important in thermal adaptation. The critical role of energy homeostasis in temperature-driven adaption has been demonstrated with genomic variation, gene expression, and downstream phenotypes in the two oyster species (Li et al. 2017; Ghaffari et al. 2019) and among intraspecific populations (Li A, Li L, Wang, et al. 2018; Li L, Li A, Song, et al. 2018), as well as in other species exposed to various stresses (Sokolova et al. 2012; Tomanek 2014; Schulte 2015; De Wit et al. 2016). This study provides a model where selection in the noncoding region leads to transcriptional divergence or plasticity which, through genes regulating energy metabolism, refines energy allocation, and facilitates thermal adaptation.
Materials and Methods
Environmental Temperature
The air temperature at the experimental sites was recorded by weather stations at Qingdao (northern site, 35°44′N) and Xiamen (southern site, 24°33′N) (Li et al. 2017). The monthly average SST within 30 km of the northern and southern sites was obtained from satellite remote sensing data (Li L, Li A, Song, et al. 2018). The seawater temperature at the site and depth for oyster acclimation was recorded using HOBO Conductivity U24 Data Loggers with a time interval of 2 h during May 2015. The air temperature and SST of April 2015 were averaged to denote the ambient temperature of intertidal zones at the sampling sites. The temperature difference between acclimation seawater (15.2 °C) and southern intertidal zone (19.9 °C) was 4.7 °C, and 4.6 °C from the northern intertidal zone (10.6 °C) (supplementary fig. S1b, Supplementary Material online).
Sample Collection and Experimental Design
Wild adult oysters of C. gigas and C. angulata were collected from intertidal zones of the northern (Qingdao, China) and southern (Xiamen, China) sites, respectively, and used as broodstock and resequencing. Broodstock oysters were transported in coolers (6–8 °C) to the acclimation site (Qingdao) and deployed in cages at a depth of ∼3 m for two months before spawning. Artificial breeding including broodstock conditioning, fertilization, and larval cultures were conducted in a hatchery at 22–26 °C. The seawater had a salinity of 31 ± 1‰ and sand-filtered. A total of 30 males and 30 females from each species were used to produce the F1 populations. Eggs from 30 females were pooled and then divided into 30 beakers, each fertilized with sperm from one of the 30 males, to maximize parental contribution. At the D-stage, larvae from six males were combined into one group and cultured in three replicate tanks. Oyster larvae were cultured in 70-l plastic containers. Larvae were fed with Isochrysis galbana during D-stage, Nitzschia closterium during umbo stage, and Platymonas halgolandica during metamorphosis. Chlorella vulgaris was used during all larval stages. Feeding level was gradually increased from 30,000 cells/ml depending on clearing rate. Juvenile F1 progeny (8 months old) of each species were divided into two groups: one group was deployed at the northern site and the other group was deployed at the southern site, creating reciprocal transplantation for both species. Two months after transplantation when oysters had experienced the greatest temperature difference of 10.1 °C between two sites, 10-month-old oysters were sampled from each site and used for subsequent studies.
Phenotype Measurement
Ten-month-old oysters (n = 99–150 per species) were randomly sampled from each site for the phenotypic measurements. Wet weight of each oyster was measured as an indicator of growth. For laboratory challenges, oysters were cleaned to remove epifauna and reared in aquaria at 20 °C for two weeks with aerated and sand-filtered seawater, and daily water changes. Oysters were fed with commercial Spirulina powder once per day. No mortality was detected during laboratory acclimation. To determine the survival of the two species under acute heat stress, oysters (n = 33–102 per replicate per species, three replicates) were exposed to 42 (±0.5) °C seawater for 1 h (LT50, Li A, Li L, Wang, et al. 2018) and then allowed to recover under ambient temperature for two weeks. The oysters were fed with Spirulina powder, and the seawater was changed daily during recovery. Survival was recorded on each of the 14 days postheat shock. For each species, the gills of 12 oysters were sampled in situ at both northern and southern sites, immediately frozen in liquid nitrogen, and stored at −80 °C. Four samples were obtained by combining equal amounts of gills from the three individuals. The ATP and FFA contents were determined using the corresponding measurement kits (Nanjing Jiancheng Bioengineering Institute, Nanjing, China). To assess fitness in the field, the survival of the two species (2 years old) from November 2016 to April 2017 were determined at both northern and southern sites.
The Shapiro–Wilk test and Bartlett test were used to test the normality and homogeneity of variances, respectively. Differences in wet weight, survival, ATP, and FFA content between C. gigas and C. angulata were tested using the function aov if the data showed a normal distribution and homoscedasticity of variances. Otherwise, a nonparametric Kruskal–Wallis test was performed. Statistical analyses were performed using R software.
Samples for Transcriptome
To profile transcriptomes under natural conditions, F1 progeny (10 months old) of both species were sampled in situ at the two field sites creating four groups for transcriptome sequencing: C. gigas (Cg) and C. angulata (Ca) from the northern (Cg_N and Ca_N) and southern (Cg_S and Ca_S) sites. Further, to evaluate their transcriptomic response to heat stress in the laboratory, the four groups of oysters (two species from two sites) were exposed to an acute sublethal heat shock of 35 °C for 24 h in three replicates. Gills from five individuals per heat-stress replicate of each oyster group were collected at 6 and 24 h, encompassing the transition from aerobic to anaerobic metabolism (Li et al. 2017) (supplementary table S1, Supplementary Material online), flash frozen in liquid nitrogen, and stored at −80 °C for subsequent RNA extraction and sequencing.
RNA Extraction and Sequencing
Total RNA was isolated using an RNAprep Pure Tissue Kit following the manufacturer’s protocol. DNase I was used to enzymatically digest genomic DNA during this procedure. NanoDrop 2000 spectrophotometry and agarose gel electrophoresis (1.2% gel) were used to determine the concentration and integrity of the RNA. Total RNA (1 μg) from the five oysters from the same sampling point was pooled in equal molarity for each of the four groups to reduce effects of random individual variation. RNA integrity was evaluated using an Agilent 2100 Bioanalyzer. Samples with RNA integrity number ≥7 were used for library construction. A total of 36 libraries (five oysters per library) were constructed using a TruSeq Stranded mRNA LT Sample Prep Kit according to the manufacturer’s instructions. These libraries were sequenced on an Illumina HiSeq X Ten sequencing platform for 150 bp paired-end reads (Shanghai OE Biotech. Co., Ltd., Shanghai, China). Raw data were processed using the NGS QC Toolkit with parameters “IlluQC_PRLL.pl N 5 -l 70 -s 20; TrimmingReads.pl -q 20; AmbiguityFiltering.pl -t5 -n 35” (Patel and Jain 2012). Unpaired, fragmental reads, reads containing poly-Ns and adapters, and low-quality reads with Qphred < 20 in more than half of bases were removed. The clean reads were mapped to the reference Pacific oyster genome (NCBI assembly Bioproject: PRJNA276446, GCA_000297895.2) (Zhang et al. 2012) using Bowtie2 with parameters “-k30 –t” (Langmead and Salzberg 2012). The read counts for each gene were determined at gene level using the htseq-count with parameters “-f bam -s reverse -r name” and union mode was used to ignore multimapping reads.
Principal Component Analysis and Differential Expression
We conducted principal component analysis (PCA) of all genes using the princomp function in R to visualize the overall differences in gene expression between northern C. gigas and southern C. angulata oysters in response to reciprocal transplantation and acute heat stress.
DEGs were identified using the DESeq2 package (Love et al. 2014) implemented in R. Read counts were log-transformed and normalized. To explain expression variations, three factors were tested using separate likelihood ratio tests: 1) species (two species in the same habitat), 2) habitat (the same species in two habitats), and 3) their interactions (two species in different habitats). The resulting P values were corrected for multiple comparisons using Benjamini and Hochberg’s false discovery rate (FDR) (Benjamini and Hochberg 1995). Genes with an FDR < 0.05 were considered significantly differentially expressed. We thus obtained three sets of DEGs that were attributed to three factors: species, habitat, and their interactions. Differences in absolute log2-fold change between the two species for different genes responding to different experimental factors were tested using the two-sample Wilcoxon rank sum test. Differences in transcriptional plasticity for the same genes from each of the three sets of DEGs between the two species in response to habitat transplantation were tested using the two-sample Wilcoxon signed-rank test.
Discriminant Analysis of Principal Components
DAPC was used to quantitatively characterize variation in gene expression profiles between the two species using the adegenet package in R (Jombart et al. 2010). To quantify the extent to which oysters were able to change their gene expression upon transplantation to nonnative habitats and upon exposure to heat stress, oysters in native habitat and oysters under normal conditions (0 h) were used as reference points. Genome-wide gene expression plasticity was quantified as the magnitude of the shift away from the reference points. Markov chain Monte Carlo (MCMC) linear mixed models (MCMCglmm package) were used to infer the shift sizes, and the P value for between-group differences was derived by analyzing 2,800 MCMC samples of parameter estimates, as described in our previous studies (Li A, Li L, Wang, et al. 2018; Li L, Li A, Song, et al. 2018).
Relationship between Evolutionary Divergence and Plasticity
Evolutionarily divergent genes were defined as those exhibited concordant expression divergence between the two species. DESeq functions estimateSizeFactors and nbinomTest were used to identify EDGs with concordant divergent expression between species in the same environment (Ca_N vs. Cg_N and Ca_S vs. Cg_S) and in their native habitat (Ca_S vs. Cg_N). We further assessed the relationship between the evolutionary changes (Cg_N vs. Ca_S) and plastic changes in C. angulata in response to nonnative habitats Ca_N versus Ca_S in the EDGs using Spearman’s rank correlation and compared the values to the distribution of values obtained from 1,000 random permutations of the species/treatment labels in SPSS 19.0.
Weighted Gene Coexpression Network Analysis
We performed WGCNA of the oyster data sets for F1 progeny under unstressed and thermal stress conditions, following tutorials for one-step automatic single-block WGCNA of RNA-seq data in R. First, variance-stabilized counts were filtered for outlier samples with the function goodSampleGenes, discarding one thermally stressed (24 h) sample of C. gigas oysters in the southern habitat (Cg_S_24-1, supplementary fig. S23, Supplementary Material online). Second, we computed Pearson correlation coefficients for all gene pairs across all oyster samples to construct a similarity matrix of gene expression, and expression correlations were transformed into connection strengths with a power adjacency function to choose an appropriate soft-thresholding power based on the criterion of approximate scale-free topology. Third, hierarchical clustering of the gene network based on topological overlap was conducted to identify groups of genes for which expression varied across samples (eigengene modules), and highly similar modules (correlation of r > 0.75) were then merged. Finally, external qualitative traits (0 or 1), including species (C. gigas: 1, C. angulata: 0), habitat (northern: 1, southern: 0), native (native: 1, nonnative: 0), normal (unstressed: 1, thermal-stressed: 0), “heat6h” (thermal-stressed for 6 h: 1, others: 0), and “heat24h” (thermal-stressed for 24 h: 1, others: 0), were related to the gene expression of individually inferred modules by defining gene significance (P < 0.05) as the correlation between the gene and the trait. The first principal component of the expression matrix describes module eigengene expression patterns.
Genotyping and Genome Scanning for Divergent Loci
Genomic resequencing reads for northern C. gigas (n = 26) and southern C. angulata (n = 21) were extracted from our previous data set (PRJNA394055) and mapped to the Pacific oyster reference genome (Zhang et al. 2012) (GenBank accession number GCA_000297895.2) using Burrows–Wheeler Aligner (BWA) software (Li and Durbin 2009). Additionally, we performed local realignment using GATK (DePristo et al. 2011) module HaplotypeCaller for variant calling of each sample with the parameter “–genotyping_mode DISCOVERY -stand_emit_conf 10 -stand_call_conf 30.” The SNPs were filtered with the parameter “QD < 2.0 ‖ FS > 30.0 ‖ MQ < 40.0 ‖ DP < 6 ‖ DP > 888 ‖ ReadPosRankSum < −8.0 ‖ BaseQRankSum < −8.” These variants were used to perform base quality score recalibration, and the reads were printed for variant calling. The identified SNPs were further classified by SnpEff (Cingolani et al. 2012), based on the gene annotation of the reference genome.
A sliding-window approach (10-kb window sliding in 1-kb steps) was used to calculate nucleotide diversity (π), population–differentiation statistic (FST), selection statistic (Tajima’s D, a measure of selection in the genome), and polymorphism levels (θπ, pairwise nucleotide variation as a measure of variability) (Fumagalli et al. 2013, 2014; Korneliussen et al. 2013). Considering the two species are closely related with a divergence time of only about 2.7 My (Ren et al. 2010) and regarded as subspecies by some (Wang et al. 2010), we used the reference genome of C. gigas to calculate nucleotide diversity of C. angulata due to the lack of a reference genome for C. angulata. Although reference genome would affect nucleotide diversity estimates, the mapping rate for C. angulata reads was only slightly lower than that for C. gigas (Qi et al. 2021). We detected candidate regions with selection signatures by screening the genome for regions with the largest differences in θπ ratio (θπ,Ca/θπ,Cg, bottom and top 5%) and fixation index (FST, top 5%) values (Weir and Cockerham 1984). First, we filtered out SNPs with a minor allele frequency of <5%. Then, we calculated the FST and θπ ratios between two species along the genome using VCFtools with pairwise comparisons (Danecek et al. 2011). The P values of these regions were calculated using permutation tests through the random replacement of samples in pairs. Candidate genes under selection were defined as those within or overlapping regions showing a selection sweep.
Functional Enrichment Analysis
Enrichment analyses were conducted using the function runTest with parameters of “algorithm = classic, statistic = fisher” of topGO package in R based on the hypergeometric distribution to identify functional groups that were overrepresented in gene sets belonging to four eigengene modules from WGCNA analysis, EDGs, and genes under selection. Gene Ontology (GO) terms with P < 0.05 were considered significantly enriched. Genes included in enriched GO terms were further examined for their expression in the two species in two habitats using the pheatmap package in R. Baseline expression patterns of candidate genes were determined for the two species in their native habitat.
Supplementary Material
Supplementary data are available at Molecular Biology and Evolution online.
Acknowledgments
We thank Y. Ning and Z. Zeng for assisting with the experiments at the southern site, and P.D. Wit, L. Zhang, R.D. Reed, and M.P. Hare for providing constructive comments on the manuscript. This work was supported by the National Key R&D Program of China (2018YFD0900304 to L.L.), the Strategic Priority Research Program of the Chinese Academy of Sciences (No. XDA23050402 to L.L.), the Distinguished Young Scientists Research Fund of Key Laboratory of Experimental Marine Biology, Chinese Academy of Sciences (KLEMB-DYS04 to A.L.), the China Postdoctoral Science Foundation (2019TQ0324 to A.L.), the Key Deployment Project of Centre for Ocean Mega-Research of Science, Chinese Academy of Sciences (COMS2019Q06 to A.L. and L.L.), the National Natural Science Foundation of China (31572620 to L.L.), and the Technology and Modern Agro-Industry Technology Research System (CARS-49 to L.L.).
Author Contributions
L.L., G.Z., and X.G. conceived the study and participated in the final data analysis, interpretation, and drafting of the manuscript. A.L. carried out the molecular laboratory work, participated in data analysis, and drafted the manuscript. Z.Z. helped in determining the ATP and FFA contents. S.L. contributed to the selective sweep analysis. L.L. and W.W. collected the oyster samples. L.L., A.L., and W.W. produced F1 progeny. A.L., L.L., X.G., and G.Z. revised the manuscript. All the authors have approved the manuscript for publication.
Data Availability
The whole-genome resequencing and transcriptome data sets have been deposited in the Sequence Read Archive (SRA) database under accession numbers PRJNA394055 (https://www.ncbi.nlm.nih.gov/biosample?LinkName=bioproject_biosample&from_uid=394055) and PRJNA516773 (https://www.ncbi.nlm.nih.gov/biosample?Db=biosample&DbFrom=bioproject&Cmd=Link&LinkName=bioproject_biosample&LinkReadableName=BioSample&ordinalpos=1&IdsFromResult=516773), respectively.
