


Abstract
Coexistence and cooperation between dogs and humans over thousands of years have supported convergent evolutionary processes in the two species. Previous studies found that Eurasian dogs evolved into a distinct geographic cluster. In this study, we used the genomes of 242 European dogs, 38 Southeast Asian indigenous (SEAI) dogs, and 41 gray wolves to identify adaptation of European dogs . We report 86 unique positively selected genes in European dogs, among which is LCT (lactase). LCT encodes lactase, which is fundamental for the digestion of lactose. We found that an A-to-G mutation (chr19:38,609,592) is almost fixed in Middle Eastern and European dogs. The results of two-dimensional site frequency spectrum (2D SFS) support that the mutation is under soft sweep . We inferred that the onset of positive selection of the mutation is shorter than 6,535 years and behind the well-developed dairy economy in central Europe. It increases the expression of LCT by reducing its binding with ZEB1, which would enhance dog’s ability to digest milk-based diets. Our study uncovers the genetic basis of convergent evolution between humans and dogs with respect to diet, emphasizing the import of the dog as a biomedical model for studying mechanisms of the digestive system.
Dogs were domesticated between 15,000 and 40,000 years ago and spread around the world alongside humans (Vilà et al. 1997; Germonpré et al. 2009; Ostrander et al. 2019). They have adapted to both natural and human environments through natural and artificial selection (Wang et al. 2013, 2014, 2020; Gou et al. 2014; Li et al. 2014; Freedman et al. 2016; Liu et al. 2018; Wu et al. 2020). For example, AMY2B (amylase-alpha-2B) and MGAM (maltase-glucoamylase) which are under positive selection in dogs are known to play an important role in starch digestion (Axelsson et al. 2013; Wang et al. 2013). Thus, adaptation to a starch-rich diet during the agricultural revolution was crucial to the domestication of dogs. Meanwhile, a new copy of AKR1B1 (aldo-keto reductase family 1 member B) transcript is identified in the dog genome but absent in gray wolf and dhole genomes (Wang, Shao, et al. 2019b). That may enhance de novo fatty acid synthesis and antioxidant capacity in dogs. These genetic changes are indicative of the dog’s adaptability to dietary changes during the spread of prehistoric agriculture (Arendt et al. 2016). It is undeniable that human culture heavily impacts the evolution of dogs (Ollivier et al. 2016).
Based on whole-genome sequencing of canids, Eurasian dogs bifurcate into two major genetic groups: European dogs and Southeast Asian indigenous (SEAI) dogs (Frantz et al. 2016; Wang et al. 2016). Another study revealed that Eurasian dogs split into four distinct geographic clusters: Southeast Asia, India, Middle East, and Europe (Botigué et al. 2017). This population structure implies that Eurasian dogs underwent divergent evolution. Recently, 722 canine whole-genome sequences were published (Plassais et al. 2019), expanding the capacity for in-depth investigation of the adaptive evolution in European dogs.
Genetic basis of adaptation to milk-based diets in Europeans has been reported (Hollox et al. 2001; Enattah et al. 2002). Human has a great impact on dogs, including the diets (Axelsson et al. 2013; Arendt et al. 2016; Wang, Larson, et al. 2019a). Here, we have studied the genomes of 242 European dogs, 38 SEAI dogs, and 41 gray wolves to understand the adaptation of European dogs. We discuss how dogs were influenced by the dietary cultures of the European people.
Results and Discussion
Sample Information and Population Structure
Previous study confirmed that the best cost/benefit argument of whole-genome sequencing is two dogs per breed (Dreger et al. 2016). To avoid sampling bias (from 1 to 44 individuals per breed), we picked 5 individuals with the highest genome coverage for every breed with more than 5 individuals. We used all individuals for breeds in which sample size is less than 5. In total, we have 242 European dog sequences including 239 samples from 96 European breeds and 3 Portugal village dogs, 38 SEAI dogs, and 41 gray wolves from the public 722 canine genomes data set (supplementary table S1, Supplementary Material online) (Plassais et al. 2019). Principal component analysis (PCA) explores the consistency of the genetic structure and the origin information assigned in the Federation Cynologique Internationale (FCI). PC1 and PC2 showed clear three groups: SEAI dogs, European dogs, and gray wolves (supplementary fig. S1, Supplementary Material online).
PSGs in European Dogs
We performed extended number of segregating sites by length (XP-nSL) (Garud et al. 2015) and cross-population extended haplotype homozygosity (XP-EHH) tests (Sabeti et al. 2007) to scan for positively selected signals in the autosomes. Using empirical P < 0.01 as threshold (supplementary note, Supplementary Material online), 104 positively selected genes (PSGs) were commonly identified by XP-nSL (363 PSGs) and XP-EHH (429 PSGs) in European dogs. To identify the unique PSGs in European breeds, XP-nSL and XP-EHH were also carried out to detect the PSGs in SEAI dogs. There are 137 PSGs commonly identifying in SEAI dogs by both methods. Out of the 104 PSGs in European dogs, 86 genes (supplementary table S2, Supplementary Material online and fig. 1) were retained after excluding 137 PSGs detected in SEAI dogs.
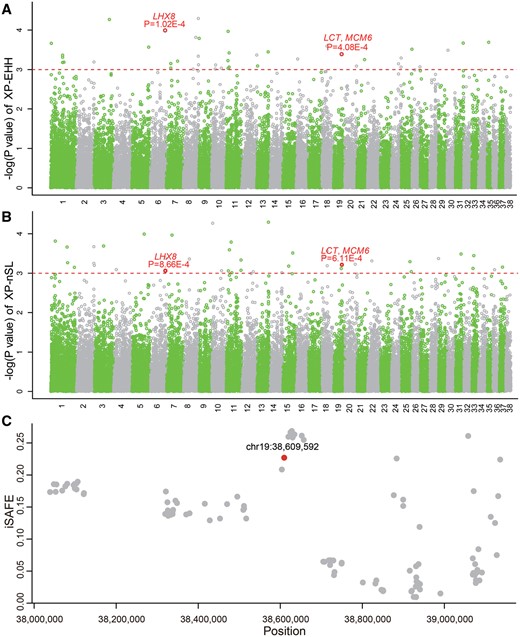
The positive selection analysis of European dogs. Genome scans with XP-EHH (A) and XP-nSL (B). Red dotted line marks empirical P = 0.001. (C) iSAFE analysis across 1.2 Mb around chr19:38,609,592 (red).
Among the 86 PSGs, three genes show strong positively selected signals (P < 0.001) in XP-EHH and XP-nSL (fig. 1), including lactase (LCT), minichromosome maintenance complex component 6 (MCM6), and LIM homeobox 8 (LHX8). LCT is a hydrolase that hydrolyze lactose into galactose and glucose. After weaning, most mammals reduced expression of LCT in the intestinal tissues and cannot digest milk (Sebastio et al. 1989; Büller et al. 1990; Lacey et al. 1994). However, lactase persistence (LP) is common in adult humans who live at northern and western Europe, as well as in African and Middle Eastern pastoralist groups, providing for by mutations in LCT and MCM6 (Hollox et al. 2001; Enattah et al. 2002; Ingram et al. 2009). A Steppe-associated expansion during the early Bronze Age contributed to advance LP in South Asians (Satta and Takahata 2020). Positive selection always creates long linkage disequilibrium (LD). LD analysis using Haploview (Barrett et al. 2005) shows that LCT and MCM6 are tightly linked in European dogs (supplementary fig. S2, Supplementary Material online). It is consistent with the finding in Finnish pedigrees (Enattah et al. 2002).
The Convergent Distribution of LP in Humans and LCT-G SNP in Dogs
To identify candidate SNPs, Fst by site between European dogs and gray wolves were calculated across whole genome and the top 1% sites taken for gene annotation (Danecek et al. 2011). One SNP (chr19:38,609,592, A-to-G) showed high allele frequency in European dogs (91.7%) compared with the SEAI dogs (61.8%) and wolves (6.1%). Thus, we used integrated Selection of Allele Favored by Evolution (iSAFE) analysis to search for candidate SNPs in a 1.2-Mb around chr19:38,609,592 (fig. 1C) (Akbari et al. 2018). To exclude effects of the demographic history, we simulated 100,000 regions with 1.2 Mb to calculate iSAFE under the demographic history (Liu et al. 2018). The result of iSAFE shows that the A-to-G mutation is significantly under positive selection (P = 1.09E-7). We performed 2D SFS to infer the core region under selection (Fujito et al. 2018; Satta et al. 2020). There are 69 SNPs located at the core region with strong LD (r2 > 3/4). Thus, we performed the simulations for 20,000 regions with 11,630 bp containing 69 SNPs and calculated 2D SFS under the demographic history (Liu et al. 2018). The significantly small values of Fc, Lc0, and large imax, γ*(10) and G*c0 support that LCT is under soft sweep in European dogs (supplementary table S3, Supplementary Material online). It suggests that more than one derived allelic lineages have been undergoing the selective sweep. The time to the most recent common ancestor (tcoa) of A-to-G mutation is 6,535 ± 180 years ago. This time is longer than 4,000 years that LP-associated allele earliest appeared in ancient Europeans (Gamba et al. 2014; Mathieson et al. 2015), and longer than the tcoa (3,280 ± 480 years ago) of T at rs4988235 in Europeans inferred by 2D SFS (Satta et al. 2020; Satta and Takahata 2020). Because T at rs4988235 in Europeans is under hard sweep, its onset time of positive selection (tSEL) is longer than tcoa (3,280 years) (Satta and Takahata 2020). On the contrary, the tSEL of A-to-G mutation in European dogs is younger than tcoa (6,535 years) due to its soft sweep. Considering the presence of A-to-G mutation in wolves and gene flows between dogs and wolves (Wang et al. 2016), it is plausible that A-to-G mutation had been existing in European dogs before the onset of positive selection. The tSEL of A-to-G mutation is shorter than the time that the earliest milk consumption in the Near East and southeastern Europe appeared around 6,500 BC (Evershed et al. 2008). Dairy economy was well developed in central Europe by 6,500 years ago (Curry 2013).
To further explore the global distribution of LCT-G in dogs, we calculated its allele frequency from 737 individuals (fig. 2) (Plassais et al. 2019). The LCT-G allele is almost fixed in Middle Eastern dogs (92.2%). A similar pattern has been reported in Middle Eastern human populations (Swallow 2003; Ingram et al. 2009). Because milk consumption emerged in the Near East and southeastern Europe 7,000–8,500 years ago (Evershed et al. 2008). On the contrary, most Chinese adult humans are lactose intolerant (Bolin et al. 1970; Bolin and Davis 1970; Bryant et al. 1970; Wang et al. 1984). Therefore, it is clearly plausible that the increased expression of LCT helps European dogs to adapt to a milk-based diet. The allele frequency is also high in Indian dogs (90.0%). The LP among Indian human populations is complex, with LP high in the North Indians but low in South Indians (Tandon et al. 1981; Enattah et al. 2002). In Africa, the allele frequency is low among Congolese (basenji, 12.5%) and Nigerian indigenous dogs (31.6%), but high in Namibian village dogs (83.3%) and Moroccan (Sloughi, 87.5%). Notably, central Namibian dogs are genetically closest to American dogs, which implies predominantly non-African origins (Boyko et al. 2009). Their high allele frequency might be caused by the nonindigenous lineage. For African human populations, pastoralist populations predominantly exhibit high LP in contrast to nonpastoralists (Mulcare et al. 2004; Tishkoff et al. 2007).
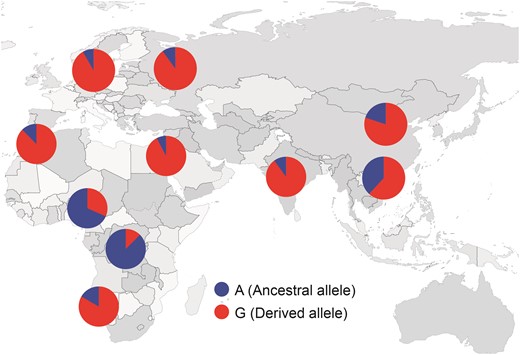
The distribution SNPs of LCT in the global panel. Red portions of the pies represent the ratio of LCT SNP (G) whereas the blue represents the ratio of LCT SNP (A). The breed origin was obtained from FCI.
LCT SNP (A > G) Increase the LCT Expression
The A-to-G mutation is located in intron 2 of LCT. The intron 2 is highly conserved across mammals and its deletion significantly reduces the expression of LCT in mice (Labrie et al. 2016). Based on JASPAR database (Khan et al. 2017), transcription factor ZEB1 (zinc finger E-box-binding homeobox 1) potentially binds to this SNP position (supplementary table S4, Supplementary Material online). The A-to-G mutation in LCT reduces its consistency with ZEB1 (relative score 0.987 vs. 0.853). Additionally, the base in ZEB1 which binds to this SNP in LCT is highly conserved in Homo sapiens (sequence logo = 2, supplementary fig. S3, Supplementary Material online). It is plausible that the A-to-G mutation may change LCT expression by modifying ZEB1 binding. To verify this, LCT-G and LCT-A luciferase reporter constructs were engineered (fig. 3A and supplementary note, Supplementary Material online) and cotransfected into HEK-293T cells with ZEB1 expression vector (fig. 3B). Luciferase activity shows that LCT-G has a higher expression than LCT-A (fig. 3C). When ZEB1 was cotransfected, the luciferase activity of LCT-A and LCT-G luciferase reporter constructs were significantly decreased. These results suggest that A-to-G mutation in LCT increases the expression of LCT by weakening the binding of ZEB1. Thus, we infer that the mutation enhances the function of LCT, resulting in LP of European dogs. The similar pattern is found in humans. For Europeans, the SNP C/T-13910 located ∼14 kb upstream of LCT is associated with the LP and under strong positive selection (Enattah et al. 2002). The region surrounding C/T-13910 increases the expression of LCT as a strong enhancer (Enattah et al. 2002; Olds and Sibley 2003; Troelsen et al. 2003). The LCT intron 2 is a regulatory element for the development of LP in humans and mice (Labrie et al. 2016). We therefore infer that an elevated expression of LCT in European dogs confers their adaptation to milk-based diets.
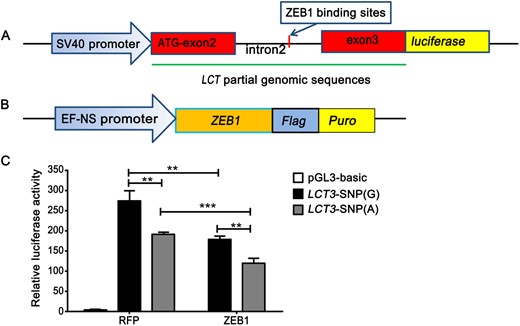
LCT SNP (G > A) influences the suppression of LCT expression with the involvement of ZEB1. (A) A schematic representation of the LCT construct. The DNA sequence including exon2, intron2, and exon3 of LCT are linked by a promoter and luciferase. (B) A schematic representation of the ZEB1 construct. ZEB1 is linked by a promoter, flag and puro. (C) HEK-293T cells were cotransfected with pCMV-Renilla (control), LCT SNP (G) or LCT SNP (A) Luciferase reporter construct as well as the ZEB1 expressing vector in sextuplicate. Two days after transfection, the cells were collected for the dual-luciferase reporter assays. Data are means ± SD. ** Mean P < 0.05 (t-test), *** Mean P < 0.001. RFP, red fluorescent protein.
Conclusion
Genes for LP coevolved over time with variations in human dietary preferences and milk-ingestion cultures (Beja-Pereira et al. 2003) . Of all domestic animals, dogs have had one of the longest mutual coexistence with humans, sharing among other things like food and living environments. There is evidence for convergent evolution between humans and dogs regarding several factors (Perry et al. 2007; Axelsson et al. 2013; Wang et al. 2014; Liu et al. 2018). Here, we describe the coevolution between dogs and human dietary culture at the genome level. Based on whole-genome analyses and gene expression assays, we outline the mutational change in LCT gene which increases its expression to confer adaptability to milk-based diets. This study expands our understanding of the genetic basis of dogs’ adaptation to human diets. It is imperative that the dog provides a suitable large animal model for studying human diseases and medicines, especially those of the digestive tract.
Materials and Methods
Sample Information
The raw SNPs files of 722 individuals were downloaded from NCBI (https://www.ncbi.nlm.nih.gov/bioproject/PRJNA448733, last accessed July 17, 2021) (Plassais et al. 2019). SNPs in autosomes marked by PASS were used for analysis. We created a metadata of countries of origins of dog breeds from the FCI (http://www.fci.be, last accessed July 17, 2021). PCA was carried out using smartpca in EIGENSOFT (v7.2.1). Chr19:38,609,592 SNP information of 15 Nigerian dogs were obtained from Liu et al. (2018).
Positive Selection
Based on the genetic map downloaded from https://github.com/auton1/dog_recomb/tree/master/canFam3.1/maps (last accessed July 17, 2021)(Auton et al. 2013), genotypes were phased by SHAPEIT (v2.r904) with 0.5 Mb windows and an effective population size of 83,600 (Delaneau et al. 2012). Subsequently, XP-EHH and XP-nSL were calculated using selscan (v1.3.0) (Sabeti et al. 2007; Szpiech and Hernandez 2014). The empirical P value of XP-EHH and XP-nSL were calculated following the method previously reported (supplementary note, Supplementary Material online) (Lee et al. 2014). The genomic regions with P < 0.01 were considered for gene annotation. Gene set was download from Ensembl (version CanFam3.1.101). iSAFE was performed for 1.2 Mb around the chr19:38,609,592 (chr19:36,109,592-41,109,592) with gray wolves as the control. 2D SFS was carried out for 69 SNPs located at the core region with strong LD (chr19: 38,600,610-38,612,240, r2 > 3/4). P values for iSAFE and 2D SFS were got based on the simulations (supplementary note, Supplementary Material online) of population history from Liu et al (2018) by ms (Hudson 2002). LD was carried out for LCT and MCM6 (19:38,572,058-38,660,280) by haploview (Barrett et al. 2005). SNPs with minor allele frequency ≥0.01 were used.
Generation of Constructs and Dual-Luciferase Assays
The 5,643-bp partial genomic DNA sequences of LCT genes, including exon 2, intron 2, and exon 3, were amplified. The PCR products were cloned into pGL3-basic Luciferase Reporter Vector (Promega, Madison, WI, USA) in XbaI and BamHI (NEB, USA) digestion sites to generate wild-type LCT luciferase constructs. It is formed the template for making mutated LCT luciferase constructs. The 3,378-bp full-length CDS (Coding DNA Sequence) of dog ZEB1 was amplified by primers. The PCR products were cloned into LentiV2-RFP vector in XbaI and XhoI digestion sites to generate ZEB1 expressing vector (supplementary note, Supplementary Material online). The HEK-293T cells were seeded into 24-well plates at 1 × 10⁵ cells per well (supplementary note, Supplementary Material online). On the following day, the cells were transfected with SNP (G) or SNP (A) luciferase reporter construct (500 ng per well), and an internal control pCMV-Renilla control (25 ng per well) as well as the ZEB1 expressing vector or negative control LentiV2-RFP vector (25 ng per well) in sextuplicate using Lipofectamine 3000 reagent (Invitrogen, Carlsbad, CA, USA). Two days after transfection, cells were collected to measure the luciferase activity by the Dual-Luciferase Reporter Assay System (Promega), and luciferase expression was normalized to renilla luciferase expression. Student’s two-tailed t-test was used to analyze the statistical significance of data.
Supplementary Material
Supplementary data are available at Molecular Biology and Evolution online.
Acknowledgments
The authors are thankful to Laurent A. F. Frantz (School of Biological and Chemical Sciences, Queen Mary University of London) for helpful feedback and discussions related to this work. This work was supported by National Natural Science Foundation of China (32000298), and the Innovative Research Team (in Science and Technology) of Yunnan Province (201905E160019), the National Key R&D Program of China (2019YFA0707101), Strategic Priority Research Program (XDPB17) of the Chinese Academy of Sciences (CAS), and Key Research Program of Frontier Sciences of the CAS (ZDBS-LY-SM011). G.-D.W. was supported by the National Youth Talent Support Program. They also acknowledge the following for funding: the grant (2018KF004) from State Key Laboratory for Conservation and Utilization of Bio-Resources in Yunnan, Yunnan University. This work was supported by the Animal Branch of the Germplasm Bank of Wild Species, Chinese Academy of Sciences (the Large Research Infrastructure Funding).
Data Availability
The data underlying this article are available in FigShare (https://doi.org/10.6084/m9.figshare.14411024, last accessed July 17, 2021). The VCF file containing 91 million variants and 722 genomes was published on NCBI (https://www.ncbi.nlm.nih.gov/bioproject/PRJNA448733, last accessed July 17, 2021) (Plassais et al. 2019) and at https://doi.org/10.1038/s41467-019-09373-w (last accessed July 17, 2021). No new genome sequencing data were yielded.
References
Author notes
Yan-Hu Liu, Lu Wang and Zhiguo Zhang authors contributed equally to this work.
