


Abstract
Snub-nosed monkeys (genus Rhinopithecus) are a group of endangered colobines endemic to South Asia. Here, we re-sequenced the whole genomes of 38 snub-nosed monkeys representing four species within this genus. By conducting population genomic analyses, we observed a similar load of deleterious variation in snub-nosed monkeys living in both smaller and larger populations and found that genomic diversity was lower than that reported in other primates. Reconstruction of Rhinopithecus evolutionary history suggested that episodes of climatic variation over the past 2 million years, associated with glacial advances and retreats and population isolation, have shaped snub-nosed monkey demography and evolution. We further identified several hypoxia-related genes under selection in R. bieti (black snub-nosed monkey), a species that exploits habitats higher than any other nonhuman primate. These results provide the first detailed and comprehensive genomic insights into genetic diversity, demography, genetic burden, and adaptation in this radiation of endangered primates.
Introduction
Snub-nosed monkeys (Rhinopithecus spp.) represent a diverse radiation of endangered leaf-eating monkeys (colobines or foregut fermenters) that exploit a diet composed principally of leaves, seeds, bark, and lichen (IUCN 2011). These primates were once widely distributed across Asia but now are limited to mountain forests in south China, Myanmar, and Vietnam (Kirkpatrick 1998; Quan and Xie 2002). Five extant species with different census population sizes are recognized: R. roxellana, the Sichuan or golden snub-nosed monkey, ∼25,000 individuals; R. brelichi, the gray snub-nosed monkey, ∼800 individuals; R. bieti, the black or Yunnan snub-nosed monkey, ∼2,000 individuals; R. avunculus, the Tonkin snub-nosed monkey, ∼200 individuals; and R. strykeri, the Myanmar snub-nosed monkey, ∼300 individuals (fig. 1a and supplementary fig. S1, Supplementary Material online) (Quan and Xie 2002). Three species, the golden, gray, and black, are endemic to China, while a fourth species, the Tonkin snub-nosed monkey is restricted to northern Vietnam. The Myanmar snub-nosed monkey, which was discovered from Myanmar (Burma) in 2011, has now also been reported to range into southwestern China (Nujiang prefecture) (Geissmann et al. 2011). Genetic evidence suggests that Rhinopithecus represents the most basal lineage of Asian colobines, however, evolutionary relationships within the genus Rhinopithecus, remain unclear (Liedigk et al. 2012). During the Pleistocene changes in rates of gene flow, population isolation, and periods of population expansion and population reduction, associated with major climatic (glacial) and geological events (uplifting of the Tibetan plateau), make this clade an instructive model for investigating questions concerning evolutionary genetics and adaptation.
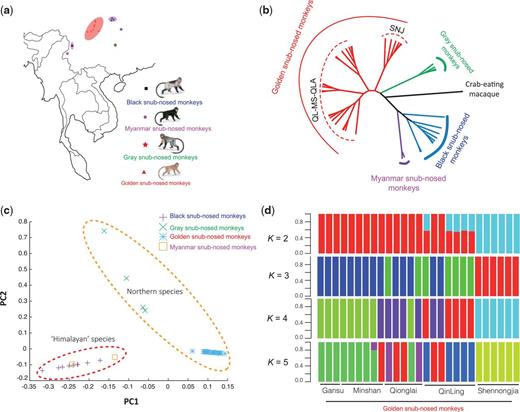
Geographic distribution, phylogenetics, and population structure of snub-nosed monkeys. (a) Current geographic distribution of snub nosed monkeys. (b) The neighbor-joining tree constructed from the allele-shared matrix of variants of 42 snub-nosed monkeys (crab-eating macaque, Macaca fascicularis, is the outgroup). (c) The Principal components analysis (PCA) of 42 snub-nosed monkeys. (d) Genetic structure of the golden snub-nosed monkeys inferred by frappe analysis. The number of populations (K) from 2 to 5 is shown. The sample location for each individual is also indicated.
Moreover, the black snub-nosed monkey which is confined to high altitude forests from 3,400 and 4,600 meters above sea level within a narrow region of the Tibetan plateau between the Yangtze and Mekong rivers (98°37′ to 99°41′E, 26°14′ to 29°20′N) has the highest elevational range of any primate species (Long et al. 1994, 1996; Li et al. 2002). Across their range, R. bieti is exposed to significant challenges associated with hypothermia, hypoxia, and locating calorie-rich food during winter (2–3 months) when temperatures commonly fall below −10 °C. In response to these challenges, R. bieti exhibits a set of derived anatomical and behavioral traits such as increased body mass, predominantly black pelage and a behavioral pattern characterized by travel to locations above the tree line and preferred use of southern mountain slopes to increase exposure to solar radiation (supplementary table S1, Supplementary Material online). It has been proposed that the tectonic migration of the Hengduan Mountains, located in southwest China and northern Myanmar, and concomitant environmental perturbations associated with periods of glacial expansion and glacial retreat during the last 1.9–2.8 mya (million years ago) are likely to have led to population isolation events in snub-nosed monkeys (Pan and Jablonski 1987; Liedigk et al. 2012). However, the genetic implications of population isolation and the genomic basis of adaptations of black snub-nosed monkeys to high altitude environments have not been determined (Yu et al. 2011).
Here, we sequenced 38 wild snub-nosed monkey genomes (four Rhinopithecus species). By conducting extensive species and population comparisons, we have reconstructed the phylogenetic relationships, demographic history, and species ancient distributions, as well as have determined the effects of changes in population size and the relative frequency of deleterious mutations across the genus. We also examined selected regions of the genome that indicate genetic changes that facilitated the exploitation of high altitude forests and recent population divergence among snub-nosed monkey species.
Results and Discussion
Phylogeny and Genetic Diversity
Genome mapping of 42 individuals (27 golden, four gray, two Myanmar and nine black snub-nosed monkeys) across the snub-nosed monkey’s 3.05 Gb genome resulted in an average of 98.6% sequencing coverage with ∼10.39-fold and ∼25.38-fold coverage depth for 35 and 7 individuals, respectively (Zhou et al. 2014) (supplementary tables S2–S7 and figs. S2–S4, Supplementary Material online). The neighbor-joining (NJ) tree of snub-nosed monkeys features two clusters, with golden and gray snub-nosed monkeys, both northern species, grouping together, and black and Myanmar snub-nosed monkeys (“Himalayan” species) forming the other cluster (fig. 1b and supplementary fig. S5, Supplementary Material online). The principal components analysis (PCA) (Patterson et al. 2006) also recovered these groupings, with the first and second eigenvectors separate R. roxellana, R. brelichi and R. strykeri/R. bieti (fig. 1c and supplementary table S8, Supplementary Material online). Within golden snub-nosed monkeys, only individuals from the Shennongjia (SNJ) mountains clustered together and formed a monophyletic group distinct from the remaining populations (Sichuan/Gansu populations, including Minshan [MS] and Qionglai [QLA] mountains, and Qinling mountains [QL], termed as non-SNJ cluster) (fig. 1b and supplementary fig. S5, Supplementary Material online). Both PCA and frappe analyses (Tang et al. 2005) recapitulated these findings. In particular, the first eigenvector separated the two genetic lineages (SNJ and non-SNJ clusters) (variance explained = 5.98%, Tracy–Widom P = 1.09 × 10⁻⁸), but the second eigenvector failed to separate the Qinling population from the other populations (variance explained = 3.65%, Tracy–Widom P = 1.09 × 10⁻⁸) (supplementary fig. S6 andtable S9, Supplementary Material online). Cross validation analysis using ADMIXTURE (Alexander et al. 2009) offers support for two clusters (supplementary fig. S7, Supplementary Material online). Using frappe, we found a division between the SNJ and the non-SNJ (QL-MS-QLA) when K = 2, with slight shared ancestry sequences between these two groups (fig. 1d and supplementary fig. S8, Supplementary Material online). Although three distinct clusters were found at K = 3, this result was not corroborated by cross-validation and was inconsistent with the population’s biogeographic distribution, i.e., Qinling (QL), Minshan-Qionglai (MS-QLA), and Shennongjia (SNJ) mountains, indicating strong gene flow between the Qinling (QL) and Minshan-Qionglai (MS-QLA) populations (Li et al. 2007; Luo et al. 2012).
Compared to other primate taxa, the heterozygosity of snub-nosed monkeys, defined as the number of heterozygous SNPs divided by total callable sequence in each individual, at 0.015%–0.068%, was found to be generally lower than in humans (0.08%–0.12%) and great apes (0.065%–0.178%) (Prado-Martinez et al. 2013), and was similar to that reported in endangered carnivores, such as the Amur Tiger, African Lion, and Snow Leopard (0.048%–0.0073%) (Cho et al. 2013) (supplementary figs. S9 and S10 and table S10, Supplementary Material online). In contrast, the heterozygous SNP rate of the snub-nosed monkeys was higher than the Yangtze River dolphin (0.0121%) (Zhou et al. 2013) and Chinese alligator (0.015%) (Wan et al. 2013), both of which are considered critically endangered. The low genetic diversity of snub-nosed monkeys is consistent with their small extant population sizes, which may be related to an evolutionary history of environmental change associated with severe forest fragmentation across isolated mountain terrain (Pan and Jablonski 1987; Quan and Xie 2002). Within snub-nosed monkeys, the heterozygosity of the two northern species (golden: 0.041% ± 7.16 × 10⁻⁵ [mead ± standard deviations] and gray: 0.068% ± 5.40 × 10⁻⁵) was higher than that of the Himalayan species (black: 0.032% ± 1.02 × 10⁻⁵ and Myanmar: 0.015% ± 2.05 × 10⁻⁵) (P < 0.05) (supplementary fig. S10, Supplementary Material online), suggesting differences in population histories, with smaller population sizes in the Himalayan species.
Demographic History and Correlation with Climate Change
To explore the demographic histories of snub-nosed monkeys, we inferred historical population size changes using the PSMC model (Li and Durbin 2011) based on the distribution of heterozygous sites across the genome. We found that individuals from the same species showed a highly similar pattern of historical fluctuation in effective population sizes (Ne) (fig. 2a and supplementary fig. S11, Supplementary Material online). However, the historical trends in Ne for black, gray and Myanmar snub-nosed monkeys showed a very different pattern from those of golden snub-nosed monkeys, with continuing declines of Ne in the first three species and two bottlenecks and two expansions in golden snub-nosed monkeys (Zhou et al. 2014). Within golden snub-nosed monkeys, individuals from the same habitats or mountain region showed a similar pattern of historical fluctuation of Ne with very few exceptions (two individuals), possibly due to migration or hybridization that occurred in these populations (fig. 2b). The postbottleneck population expansion after 105 years was not found in individuals from the Shennongjia (SNJ) and southern Qinling mountain populations, consistent with their reduction in heterozygosity when compared to other populations.
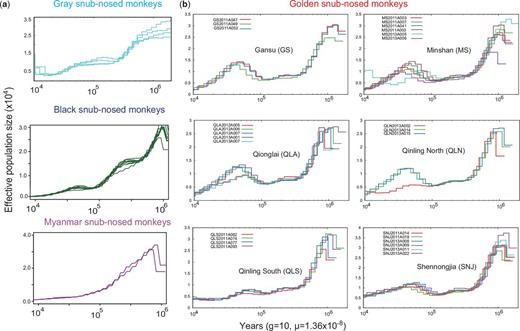
Ancestral population size of snub-nosed monkeys. (a) Ancestral population size was inferred using a PSMC model for each individual from gray, black, and Myanmar snub-nosed monkeys. Generation time (g) = 10 years, and neutral mutation rate per generation (µ) = 1.36 × 10⁻⁸. (b) Ancestral population size was inferred for each golden snub-nosed monkey individual from six current habitats or mountains. PSMC of black and Myanmar snub-nosed monkeys shown here are under 2% and 4% FDR, respectively.
For golden snub-nosed monkeys, we also inferred the time of the divergence event between the Shennongjia (SNJ) and Qinling-Minshan-Qionglai (non-SNJ) populations, as well as recent demographic fluctuations in population size. Using the joint site frequency spectrum between SNJ and non-SNJ and the diffusion approximations method (Gutenkunst et al. 2009), the IM-pre model, identified the split between SNJ and non-SNJ populations around 4.60 thousand years ago (Upper Pleistocene and Holocene) (fig. 3a, supplementary table S11 and fig. S12, Supplementary Material online), similar to the timing of separation revealed by the SM model (split with migration) and PSMC analyses. Relative cross coalescence rates (CCR) estimated by a MSMC (multiple sequentially Markovian coalescent) model (Schiffels and Durbin 2014) revealed that the complete split between the SNJ and non-SNJ populations occurred 10 kya (thousand years ago), near the end of the last glacial maximum (LGM, 25–15 kya) (fig. 3b). In the early stages of the LGM (∼20 kya), substantial alpine glaciations (for example, Gongga glacial II in Qinghai-Tibetan Plateau, 15–20 kya) (Zheng et al. 2002) resulted in extensive loss and fragmentation of forested habitats across the snub-nosed monkey distribution, likely leading to population isolation. Population studies using allozyme loci polymorphisms (Li, Meng, et al. 2003b) also proposed a recent bottleneck for golden snub-nosed monkeys, in that case within the last 15,000 years.
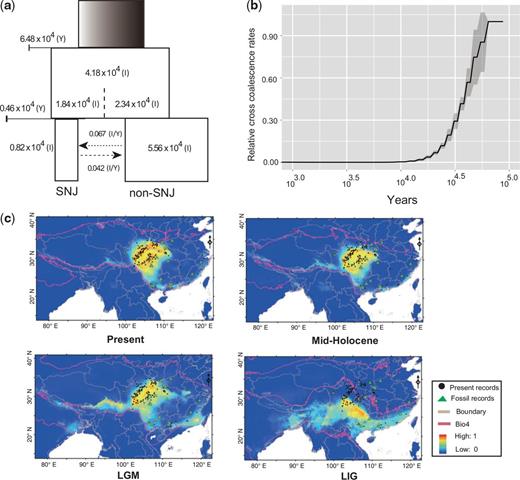
Recent demographic history and species distribution models of golden snub-nosed monkeys. (a) ∂a∂i simulations showing the recent demographic history of golden snub-nosed monkeys using IM-pre models. Y in brackets denotes years and I in brackets denotes individuals. (b) Relative cross coalescence rates (CCR) for the Shennongjia (SNJ) and Qinling-Minshan-Qionglai (non-SNJ) populations divergence within Golden snub-nosed monkeys. (c) Species distribution models of golden snub-nosed monkeys. Present occurrences (Upper left), fossil records (green triangles), and the Mid-Holocene (∼6 kya), LGM (∼21 kya), and LIG (∼120–140 kya) species distribution predictions of golden snub-nosed monkeys made using occurrence records (black dots) and the climatic and elevation variables. Areas in red indicate the most suitable environmental conditions and those in blue are background areas (values ranging from 0 to 1). The red line is the value of seasonal changes in temperature (standard deviation × 100), which has the highest contribution among the 19 climatic variables used.
During the Pleistocene, climatic fluctuations, and periodic uplifting of the Qinghai-Tibetan Plateau had important effects on biodiversity and changes in the geographic distribution of mammals in southwest China (He and Jiang 2014). For example, it has been suggested that the LIG (Last Interglacial Maximum) was an unfavorable period for mole shrews (Anourosorex squamipes) because of increased seasonality in temperature extremes. During this period, mole shrews survived in isolated interglacial refugia mainly located in the southern subregion and then rapidly expanded during the LGM (He et al. 2016). The amount and distribution of suitable habitat for snub-nosed monkeys also is likely to have been affected by these climatic events. To assess the role of climate using species distribution models and palaeoclimatic data on temperature and precipitation, we estimated suitable habitat of golden snub-nosed monkeys during the time periods of 120–140 kya (LIG), 21 kya (LGM), 6 kya (Mid-Holocene), and the present (fig. 3c and supplementary table S12, Supplementary Material online). The model revealed that suitable habitat during the LIG was more widely available than during both the colder LGM and warmer mid Holocene. Specifically, climate change during the LIG period resulted in an expansion of suitable habitat in northward areas (fig. 3c). This result parallels patterns of population size change in golden snub-nosed monkeys estimated from the PSMC model, which suggested an expansion in population size beginning at 0.1 mya and a bottleneck occurring at the LGM. Strikingly, the suitable habitat of golden snub-nosed monkeys expanded toward warmer southern areas during the LGM; in contrast, the fossil record implied that population have moved into colder northern areas during the mid-Holocene (fig. 3c). Given that seasonal extremes in temperature have a significant effect on forest productivity (Ni et al. 2001), climate change likely dramatically contributed to the shifts in the geographic distribution of golden snub-nosed monkey populations from the LIG to the LGM. In addition, combined with genetic evidence of population history, these results are consistent with severe population isolation of golden snub-nosed monkeys during the LGM, followed by subsequent in situ survival in their extant ranges.
Signatures of Deleterious Variation and Positive Selection
As demonstrated above and reported in a previous study (Zhou et al. 2014), levels of heterozygosity and demographic trajectories varied substantially among snub-nosed monkey species and populations. Genome-wide linkage disequilibrium (LD) also varied markedly within Rhinopithecus; specifically, the average distance over which LD decayed to half of its maximum value in gray (>100 kb) and black snub-nosed monkeys (∼66.7 kb) was substantially longer than that of golden snub-nosed monkeys (∼17.5 kb) (fig. 4a). Because deleterious mutations should be removed more efficiently in larger populations (Kimura 1983; Charlesworth 2009; Xue et al. 2015), we examined the genetic load of deleterious variation in different snub-nosed monkeys. We found a similar number of derived missense and loss-of-function (LoF) alleles among golden, gray, and black snub-nosed monkeys (fig. 4b). We did not observe a larger number of derived missense alleles in gray snub-nosed monkeys and black snub-nosed monkeys compared to golden snub-nosed monkeys (fig. 4b). Thus, despite their larger census population size, selection was not more effective at removing moderately deleterious mutations in golden snub-nosed monkeys, a pattern also seen in humans (Do et al. 2015). This may either be because golden snub-nosed populations were still too small for selection to effectively remove deleterious mutations or that ancient bottlenecks had an impact on purifying and background selection (Lynch 2006). We found that black snub-nosed monkeys had more LoF variants than golden snub-nosed monkeys. However, the ratio of homozygous LoF genotypes in black snub-nosed monkeys is higher than in golden snub-nosed monkeys (fig. 4c), which is consistent with the assumption that LoF variants are more likely to be strongly deleterious and are more frequently exposed in a homozygous state (Glémin 2003). We also found LoF variants differing significantly in homozygous and heterozygous tracts (fig. 4d), which is consistent with that recessive LoF variants are likely more deleterious in the homozygous rather than the heterozygous state, where they are masked.
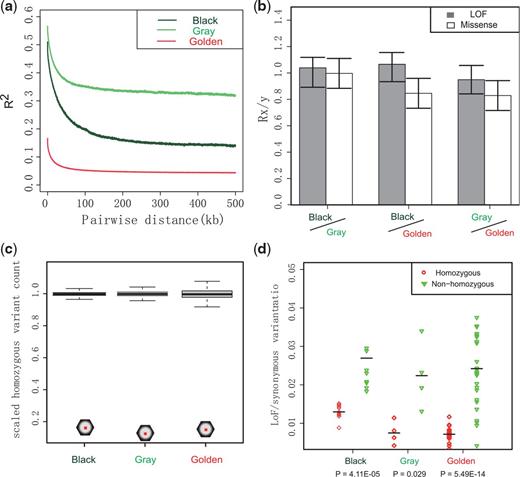
The linkage disequilibrium and genetic load. (a) LD patterns. (b) Relative number (Rx/y) of derived alleles at LoF (shade) and missense (blank) sites in pair-wise comparing groups among gray, black, and golden snub-nosed monkeys. Error bars represent ± 2 SD. (c) The scaled number of LoF variant sites (hexagon) in each population where at least one sample is homozygous for the derived allele. The distributions of the synonymous sites using the same statistic are shown in box. Whiskers show 5th and 95th percentiles. (d) The rate of LoF variants relative to synonymous variants in homozygous tracts for each sample (red circles) and in nonhomozygous regions (green diamonds). Horizontal bars denote population means; P values received from Kolmogorov–Smirnov test.
Finally, we looked at variation in genes or genomic regions that were possibly under selection and adaptation in snub-nosed monkeys. We first focused on black snub-nosed monkeys. This species inhabits the highest known mountain elevations among Rhinopithecus and among non-human primates generally (Long et al. 1996; Li et al. 2002). Given that the divergence between black snub-nosed monkeys and other snub-nosed monkeys was relatively recent, we used a population genetic methodology to identify selective regions and adaptations. Using fixation (FST) and genetic diversity (θπ), we identified 19 genes, containing a total of 2.16 Mb of genomic sequence, with maximum FST values (top 5%) and minimum θπ1/θπ2 (top 5%) in black snub-nosed monkeys (fig. 5a and supplementary table S13, Supplementary Material online). Of these potentially selected genes, ADAM9, which encodes a cell-surface membrane glycoprotein, is a member of the ADAM (a disintegrin and metalloprotease domain) family (fig. 5b). Members of this family have been implicated in a variety of biological processes involving cell–cell and cell–matrix interactions, muscle development and neurogenesis (Primakoff and Myles 2000). Several ADAM family members have been identified as positively selected genes in Tibetan yak and ground tit, compared to their lowland relatives (Qiu et al. 2012; Cai et al. 2013). With regard to ADAM9, previous study has showed that the mRNA and protein expression levels of this gene are elevated by the regulation of reactive oxygen species under hypoxic stress conditions in prostate cancer cells (Shen et al. 2013). In addition, hypoxia (1% oxygen) can also induce the expression of ADAM9 in gastric cancer cells (Kim et al. 2014). Interestingly, ADAM9 has also been identified as one of the positively selected genes in Tibetan chicken (Zhang et al. 2016), suggesting a common strategy for hypoxia adaption has been utilized in both two species. Also, it is well documented that that an unfolded protein response (UPR) is involved in O2-sensitive signaling pathways caused by hypoxia in cancer (Wouters and Koritzinsky 2008) and moderate to severe hypoxia will affect the pulmonary vascular remodeling and cardiac muscle function (Julian 2007). Accordingly, we found another two genes positively selected in the black snub-nosed monkey (supplementary tables S14 and S15, Supplementary Material online) that are associated with such pathways, i.e., Ubiquitin mediated proteolysis (HERC1) and Cardiac muscle contraction (SLC9A6).
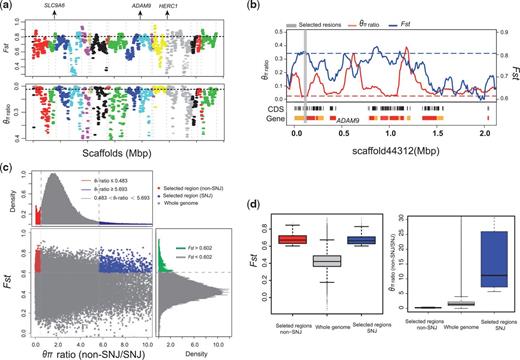
Genomic regions with selective sweep signals. (a) The θπ ratios (black snub-nosed monkeys/other snub-nosed monkeys) and FST values of the scaffolds where 19 positively selected genes in black snub-nosed monkey located. (b) Example of genes with strong selective sweep signals in black snub-nosed monkeys. θπ ratios and FST values are plotted using a 10 kb sliding window. (c) Distribution of θπ ratios (SNJ/Non-SNJ) and FST values, which are calculated in 100 kb windows sliding in 10 kb steps. Data points located to the left and right of the left and right vertical dashed lines, respectively (corresponding to the 5% left and right tails of the empirical θπ ratio distribution), and above the horizontal dashed line (the 5% right tail of the empirical FST distribution) were identified as selected regions for the SNJ (blue points) and non-SNJ (red points) populations. (d) Box plot of FST values (left) and θπ ratios (SNJ/non-SNJ) (right) for genomic regions of the SNJ and non-SNJ populations of golden snub-nosed monkeys that have undergone positive selection versus the whole genome. Boxes denote the interquartile range (IQR) between the first and third quartiles (25th and 75th percentiles, respectively) and the line inside the box denotes the median. Whiskers denote the lowest and highest values within 1.5 times IQR from the first and third quartiles, respectively. Outliers beyond the whiskers are shown as black dots.
To examine the local adaptations of golden snub-nosed monkey populations, we measured selected regions across genome between the SNJ and non-SNJ golden snub-nosed monkey populations, which are geographically and genetically distinct. We found twice as many genomic regions were under positive selection in the SNJ population (161 genes containing 17.86 Mb of sequence, or 0.625% of the genome) as there were in the non-SNJ populations (64 genes containing 7.77 Mb, or 0.272% of the genome) (fig. 5c and supplementary table S14, Supplementary Material online). Genes embedded in selected regions of the SNJ and non-SNJ populations were significantly associated with lipid metabolism process, such as negative regulation of very-low-density lipoprotein particle remodeling (two genes, P = 2.0 × 10⁻⁴, Fisher exact test), steroid metabolic process (eight genes, P = 2.5 × 10⁻³, Fisher exact test), and cellular lipid catabolic process (four genes, P = 4.4 × 10⁻³, Fisher exact test) (supplementary tables S16 and S17, Supplementary Material online). Moreover, several genes (including GTF2I, TRIPL1, DTNB, CATSPER3, PPIL6, and RBBP8) that under selection in SNJ populations associated with adult height and organ development in humans. This may be related to the fact that golden snub-nosed monkeys living in Shennongjia mountain differ from other golden snub-nosed monkey populations in possessing extremely reduced or absent nasal bones and fusion of the premaxilla superior to the piriform aperture, a longer tail and longer forelimbs (supplementary tables S18 and S19, Supplementary Material online) (Kirkpatrick 1998; Wang et al. 1998; Mittermeier et al. 2013). Interestingly, one of those genes (i.e., GTF2I) is located in the causal region (7q11.23) of the Williams–Beuren syndrome, a microdeletion or contiguous-gene-deletion disorder, resulting in a distinctive, ‘elfin’ facial appearance, along with a flat nasal bridge (Francke 1999; Pober 2010). Moreover, given that some traits characteristic of the SNJ population, for example their long tail, are also found in other species of snub-nosed monkeys, we speculate that the natural selection on genes corresponding to these common characters has relaxed in the non-SNJ population of golden snub-nosed monkeys, leading to an increase in the frequency of this polymorphism.
Conclusions
In the present study, we first provide a comprehensive analysis of genomic polymorphism within the genus Rhinopithecus and then reconstruct phylogenetic relationships across snub-nosed monkey genomes. Our results indicate that biogeography and climate change critically shaped the demographic history of snub-nosed monkeys. We found low genetic diversity within each species of this primate clade, likely the result of historical bottlenecks caused by glacial and tectonic events the Pleistocene. This is consistent with biogeographical and fossil information indicating that snub-nosed monkeys were once widely distributed throughout China and parts of South Asia but that currently all five endangered species are confined to isolated mountain forests. We also found that a larger census population size of golden snub-nosed monkeys did not result in a reduction of burden of deleterious mutations compared to other snub-nosed monkeys. Given the limited remaining population size of each snub-nosed monkey species, it is likely that continued habitat loss and fragmentation resulting from climate change and human interference will lead to further population isolation and decline.
We found evidence of positive selection in the genome of the black snub-nosed monkeys for several genes that potentially facilitate an adaptive response to hypoxia. We do caution, however, that genomic variation can be affected by many evolutionary processes and that without functional experiments, it is difficult to distinguish natural selection from genetic drift on specific loci, including candidate genes listed in the present study. This study highlights the value of genomic data in assessing genetic diversity, measuring the power of natural selection, and identifying local adaptations.
Materials and Methods
Sampling and Sequencing
This study was approved by the Animal Ethics Committee of the Institute of Zoology, Chinese Academy of Sciences. The muscle and dried skin samples were collected from individuals who died of natural causes in Nature Reserves. The blood samples were collected from injured individuals who were treated by veterinarians from the rescue station of the nature reserves or zoos. The procedure of blood collection was in strict accordance with the Animal Ethics Procedures and Guidelines of the People's Republic of China. Our sample included 26 golden, 3 gray, 1 Myanmar, and 8 black snub-nosed monkeys. For golden snub-nosed monkeys, our samples included each of the five extant mountain populations, i.e., Sichuan/Gansu (GS or SG), Minshan (MS), Qinling mountains (QL), Qionglai mountain (QLA), and Shennongjia (SNJ). Individuals from the same location were avoided in order to reduce the potential effect of kinship on genetic diversity. Genomic DNA of 38 snub-nosed monkeys was extracted from blood or muscle using a Gentra Puregene Blood Kit (Qiagen) according to the manufacturer's instructions. Sequencing libraries were constructed with insert size 500 bp or 300 bp, and then sequenced on an Illumina HiSeq 2000 platform using paired-end (PE) 100 bp reads. The average sequencing depth was ∼30× per sample for the three golden snub-nosed monkey individuals and ∼10× per sample for the other 35 individuals (supplementary table S3, Supplementary Material online). Resequencing reads of snub-nosed monkeys in this study have been deposited in NCBI Sequence Read Archive (SRA) under accession SRP051679. Four previously published snub-nosed monkey genome data were retrieved from NCBI under accession SRP033389.
Read Mapping and Variant Calling
Adapter and low quality reads [e.g., Reads with ≥ 10% unidentified nucleotides (N); reads with > 10 nt aligned to the adapter, allowing ≤ 10% mismatches; bases having phred quality < 30] were removed from the raw data using inhouse Perl script. The remaining high quality reads were aligned to the golden snub-nosed monkey (GSM) genome (Zhou et al. 2014) using Burrows–Wheeler algorithm implemented in BWA software (Li and Durbin 2009) with parameters “BWA aln -o 1 -e 10”. In order to reduce mismatch generated by PCR amplification before sequencing, duplicated reads were removed using Samtools (version 1.2) (Li et al. 2009).
We performed variant calling on population-scale for all samples using Samtools (version 1.2) mpileup with parameters “-q 1 -C 50 -S -D -m 2 -F 0.002” and using bcftools (with parameters “view –cvg”) to view variants (Li 2011). The following filtering steps were applied in order to obtain high quality variants: (1) minimum read depth was 8; (2) maximum read depth was 30; (3) minimum root-mean-square (RMS) mapping quality was 20; and (4) SNP within 3 bp around a mapping gap to be filtered. Other parameters in “bcftools/vcfutils.pl varFilter” are default. Genotype quality less than 20 and variants with allele frequency less than 10% of the 42 samples also were filtered. To assess sequence accuracy, we genotyped 100 randomly selected variants in 38 snub-nosed monkeys using a PCR-based KASP (Kbioscience Allele-specific Polymorphism) genotyping approach. Of the 2,330 loci successfully genotyped, 95.45% SNPs (2,224 loci) were consistent with the SNPs identified from resequencing, demonstrating the high quality and reliability of our variant calls.
Heterozygosity Analysis
Genetic diversity was assessed using heterozygosity in each individual. Heterozygosity (h) for each individual was calculated as the number of heterozygous sites divided by the total number of callable sites across the whole genome.
Phylogenetics, Population Structure and Principal Components Analysis
Phylogenetic trees were inferred using neighbor joining (NJ) method and implemented in TreeBest (http://treesoft.sourceforge.net/treebest.shtml) with 500 bootstraps. Population structure within golden snub-nosed monkeys was inferred by ADMIXTURE (Alexander et al. 2009) with 10-fold cross-validation (Alexander and Lange 2011). The ancestral sequences of snub-nosed monkeys were inferred using the program frappe (Tang et al. 2005), which implements an expectation–maximization algorithm. We did not assume any prior information about their structures in these analyses and predefined the number of genetic clusters K from 2 to 5. The maximum iteration of the expectation-maximization algorithm was set to 10,000.
The principal component analysis (PCA) of 42 samples was conducted using EIGENSOFT3.0 (Patterson et al. 2006) and the significance of eigenvectors were determined with the Tracey–Widom test in the EIGENSOFT 3.0 (Patterson et al. 2006). The numbers of individuals differ greatly between species and this can potentially influence the PCA. Therefore, we repeated the PCA analyses by randomly selecting 9 and 4 golden snub-nosed monkey individuals, respectively (five replicates for each). The repeated analyses supported the original results.
Demographic History Reconstruction
Changes in effective population size were inferred from a haploid pairwise sequentially Markovian coalescence (PSMC) model (Li and Durbin 2011) with parameters “-g 10 -R -u 1.36e-8 -m 100 -X 2000000 -p ‘4 + 25*2 + 4 + 6’”. Several gradient levels for the parameter “-p” were set (from 26 free interval parameters with 60 atomic time intervals to 30 free interval parameters with 68 atomic time intervals) to test the performance of PSMC model in golden snub-nosed monkeys. The estimated TMRCA is in units of 2N0 time and the mean generation time was set at 10 years and μ (unit: nt/generation) was estimated as 1.36 ×10⁻⁸ according to our previous estimation (Zhou et al. 2014). Given that the reduced genetic variation in X chromosomes would affect the inference of population genetic information, we excluded SNPs located in X chromosomal regions and kept autosomal SNPs for PSMC analyses and later MSMC analyses. We aligned the scaffolds of the golden snub-nosed assembly to the human (genome hg19) using LASTZ (Harris 2007) and excluded the longest scaffold that showed a syntenic relationship with the human X chromosome.
The recent demographic history of golden snub-nosed monkeys was inferred using ∂a∂i (Gutenkunst et al. 2009). Many divergence models between two genetic populations, including the Standard neutral model (SNM), the Instantaneous size change followed by exponential growth with and without population split model, Split into two populations with migration (SM) model, Isolation-with-migration model with exponential pop growth (IM) model, and Isolation-with-migration model with exponential pop growth and a size change prior to split (IM-pre) were considered. The IM_pre and SM models were chosen as the optimal models by comparing the optimized model likelihood. The ancestral population size (NA) was estimated on the basis of the optimized parameters and the estimated mutation rate. Nonparametric bootstrapping was performed 100 times to determine the variance of each parameter using equal numbers of loci sampled without replacement from the original data set. The relative cross coalescence rates (CCR) for the Shennongjia (SNJ) and Qinling-Minshan-Qionglai (non-SNJ) populations divergence within Golden snub-nosed monkeys was estimated under MSMC model (Schiffels and Durbin 2014).
Species Distribution Modeling
Geographical information on species presence (n = 127) was obtained from the State and local records in China since 1616 and published in previous studies (Quan and Xie 2002; Li et al. 2002; Li, Jia, et al. 2003b). A total of 25 fossil localities were drawn from the literature (Pan 1995; Hijmans et al. 2005) to collate the modeled past species distribution areas. Generally, the fossil localities represent a subset, rather than an exhaustive search of the literature available, and modeled ranges consequently represent a subset of the entire past distribution of the species.
We developed the present-day Species Distribution Models (SDMs) based on current climate data, and then projected the SDMs to three periods: mid-Holocene (∼6000 years BP), last glacial maximum (LGM, ∼21,000 years BP), and last interglacial (LIG, ∼120,000–140000 years BP). Nineteen bio-climatic variables used for model construction and projections were obtained from the WorldClim 1.4 database at a spatial resolution of 2.5 arc-minutes (Hijmans et al. 2005). The bio-climatic layers for the present-day were based on spatially interpolated values of temperature and precipitation gathered from weather stations around the world from 1950 to 2000 (Pan 1995), whereas the variables for both the period mid-Holocene and LGM were generated from the climate reconstructions based on CCSM4 (http://www.ccsm.ucar.edu/) (Collins et al. 2006) and MIROC-ESM (Otto-Bliesner et al. 2006), and the variables for LIG were downscaled from simulations with Global Climate Models (GCMs) (Otto-Bliesner et al. 2006).
SDMs were run at each grid size in R-based BIOMOD for the golden snub-nosed monkey, and each probability distribution was predicted across the study area. We divided the occurrence data into two subsets: the first, a random sample from 70% of the total database was used to calibrate (train) the models, whereas the second, comprising the remaining data, was used to evaluate (test) model predictions (Fielding and Bell 1997). The eight methods included in the testing framework were: artificial neural networks (ANN) (Venables and Ripley 2013); classification tree analysis (CTA) (Breiman et al. 1984); random forest (RF) (Breiman 2011); generalized linear models (GLM) (McCullagh and Nelder 1989); generalized boosting models (GBM) (Ridgeway 1999); generalized additive models (GAM) (Hastie and Tibshirani 1990), mixture discriminate analysis (MDA) (Hastie et al., 1994), and Maximum Entropy (MaxEnt) (Phillips et al. 2006). To assess the quality of predictions, we randomly split the dataset using 70% of the data to calibrate the models and the remaining 30% for evaluation (Barbet-Massin et al. 2012). Since only occurrence records were available for the species, we used 1000 randomly generated pseudo-absence points in constructing SDMs (Elith et al. 2006). Model performance at each grid size was assessed using Cohen’s kappa statistic (Cohen 1990), the area under the curve (AUC) of receiver operating characteristics (ROC) (Fielding and Bell 1997), and true skills statistics (TSS) (Allouche et al. 2006). From the output of all eight species distribution models, we generated ensemble projections based on the weighted mean of predicted probabilities of presence (Thuiller 2003).
Linkage-Disequilibrium Analyses
To assess linkage disequilibrium (LD) pattern in snub-nosed monkey species, the coefficient of determination between any two loci in each population was calculated using Haploview (Barrett et al. 2005) with parameters “-maxdistance 500 -dprime -minGeno 0.75 -minMAF 0.05 -hwcutoff 0.001”. For plotting LD decay curves, variants with a highly similarly physical distance (500 kb) were merged into groups and calculation of average r2 for each group. Considering the samples were not equal in three snub-nosed monkeys, we randomly chose 9 and 4 golden snub-nosed monkeys, respectively, and repeated the LD analyses 10 times.
Genetic Load and Purging of Deleterious Mutations
When we estimated LA,B (C), at each site i, the observed derived allele frequency in population A was defined as fAi = dAi/nAi, where nAi is the total number of alleles and dAi is the number of derived alleles identified in population A. The fBi was similarly defined in population B. In the above formula, C and I indicate category of protein-coding sites and a set of intergenic sites, respectively. Totally, 3.66, 3.53, and 4.88 Mb intergenic sites were selected in black, gray, and golden snub-nosed monkeys, respectively.
To investigate the ratio of homozygous LoF genotypes in each subspecies of sub-nosed monkeys, we also counted the number of LoF segregating sites (nhom) where at least one individual is homozygous for the derived allele in each subspecies. In total, we found 296 such sites in R. bieti, 181 in eastern R. brelichi and 271 in R. roxellana. In order to normalize the numbers of samples in each species, we also counted nhom in each of 10,000 random samples of segregating synonymous sites. The LoF mutations occurring as homozygous tracts within individuals were normalized by the rate of synonymous variant sites in the same regions.
Selective Signals in Black and Golden snub-Nosed Monkeys
The polymorphism levels in each group were quantified by pairwise nucleotide diversity (θπ) (Tajima 1983, equation A3) and the genetic differentiation in two populations was quantified by pairwise FST ( = [HT − HS]/HT, Weir and Cockerham 1984). Both θπ and FST were calculated by a sliding window method (100 kb windows sliding in 10 kb steps). Variants were filtered when the minor allele frequency was less than 5% and the missing genotypes frequency was more than 50%. For comparing groups (groups 1 and 2), the regions with maximum FST values (top 5%) and minimum θπ1/θπ2 (top 5%) were identified as selected regions for group1, and vice versa. We used DAVID (Huang et al. 2009) to preform GO term enrichment analysis on the candidate selective gene located in selected regions (DAVID analysis was run June 25, 2016).
Acknowledgments
We greatly thank the Shennongjia National Nature Reserve, Baimaxueshan National Nature Reserve, Gaoligongshan National Nature Reserve (Nujiang), Beijing Zoo, Beijing Wildlife Park and Shanghai Wildlife Park for permission to sample. Thanks Dr Wen Xiao in Dali University for providing the samples of Myanmar snub-nosed monkey, and Dr Nguyen Van Truong in FFI Vietnam for providing the photo of Tonkin snub-nosed monkey. We wish to acknowledge the contributions of Chrissie McKenney, Sara Garber, and Jennifer Garber. This project was supported by National Key Program (2016YFC0503200 and 2013BAD03B02) from Ministry of Science and Technology of China, the Natural Science Foundation of China (No. 31270420, 41371071, and 31130061), Hubei Province Key Laboratory of Conservation Biology of Shennongjia Golden Monkey, and State Forestry Administration of China to Ming Li.
References
Author notes
†These authors contributed equally to this work.
Associate editor: Anne Stone
