


Abstract
Endogenous retroviruses are genomic elements formed by germline infiltration by originally exogenous viruses. These molecular fossils provide valuable information about the evolution of the retroviral family. Lentiviruses are an extensively studied genus of retroviruses infecting a broad range of mammals. Despite a wealth of information on their modern evolution, little is known about their origins. This is partially due to the scarcity of their endogenous forms. Recently, an endogenous lentivirus, ELVgv, was discovered in the genome of the Malayan colugo (order Dermoptera). This represents the oldest lentiviral evidence available and promises to lead to further insights into the history of this genus. In this study, we analyzed ELVgv integrations at several genomic locations in four distinct colugo specimens covering all the extant dermopteran species. We confirmed ELVgv integrations in all the specimens examined, which implies that the virus originated before the dermopteran diversification. Using a locus-specific dermopteran substitution rate, we estimated that the proviral integrations occurred 21–40 Ma. Using phylogenetic analysis, we estimated that ELVgv invaded an ancestor of today’s Dermoptera in an even more distant past. We also provide evidence of selective pressure on the TRIM5 antiviral restriction factor, something usually taken as indirect evidence of past retroviral infections. Interestingly, we show that TRIM5 was under strong positive selection pressure only in the common dermopteran ancestor, where the ELVgv endogenization occurred. Further experiments are required to determine whether ELVgv participated in the TRIM5 selection.
Introduction
Endogenous retroviruses (ERVs) are genomic elements present in all the vertebrate genomes hitherto analyzed. They are formed when an originally exogenous retrovirus integrates into the host germline genome and becomes transmitted from generation to generation. The vast majority of these “viral fossils” are of ancient origin and thus provide valuable insight into the evolutionary history of retroviruses and their interactions with hosts. The phylogenetic structure of ERVs matches that of the main genera of the exogenous retroviruses hitherto described. However, the diversity of ERVs is much greater, as they represent the footprints of viral infections that occurred throughout the entire retroviral evolution (Hayward et al. 2015; Johnson 2015). The basic approach to uncovering the origin and phylogenetic relationships between particular retroviral genera is through the genetic analysis of ERV lineages.
There are several methods to estimate the time interval when a specific ERV infiltrated the germline of its host species. The most straightforward way is to determine the presence or absence of ERV in the genomes of phylogenetically related species (Johnson 2015). In general, any ERV infiltration should have occurred in the most recent common ancestor of all the ERV-positive species. This method is very robust, but it only yields a broad interval for the ERV age. A second approach, which yields age estimates for specific ERV integrations, involves the sequence analysis of viral long terminal repeats (LTRs). The 5′ and 3′ LTRs are formed during retroviral reverse transcription and should be identical at the time of integration. Integration can therefore be dated using the LTRs’ sequence divergence generated post-integration at the genome substitution rate (Johnson and Coffin 1999). A third method uses the fact that ERV integration can be dated if the genomic locus with the ERV integration is duplicated. If the virus is present in both regions, then the duplication event must have occurred after virus integration. Therefore, the age of the duplication provides a lower estimate for the ERV integration (Katzourakis et al. 2007; Hron et al. 2014). The fourth—and the most sophisticated—approach involves the time-calibrated phylogenetic analysis of orthologous proviral sequences from multiple species (Tonjes and Niebert 2003; Jha et al. 2009, 2011; Kamath et al. 2014). In addition to describing individual integrations, this method is able to reveal the evolutionary history of the entire ERV lineage.
Apart from the study of ERV sequences, additional indirect evidence for ancient retroviral infections can be obtained by identifying positively selected host antiretroviral factors (Aswad and Katzourakis 2012). This is based on the assumption that antiviral factors are forced to continually adapt to the infecting virus. A great example of such virus-host coevolution is provided by the TRIM5 restriction factor, which blocks retroviral infection by binding the capsid (CA) component of the viral core (Stremlau et al. 2004; Perez-Caballero et al. 2005). The antiretroviral activity of this protein is determined mainly by the B30.2 domain, which has been clearly shown to have been subjected to positive selection pressure (Sawyer et al. 2005). In fact, TRIM5 evolution also reflects ancient lentiviral infections. In lagomorphs (rabbits and hares) and primates, the pattern of positive selection and/or antiretroviral activity of TRIM5 have been linked to the presence of endogenous lentiviruses (Fletcher et al. 2010; de Matos et al. 2011; Rahm et al. 2011; Yap and Stoye 2013; McCarthy et al. 2015).
Lentiviruses represent one of the most extensively studied retroviral genera, mainly because of their ability to cause various chronic diseases in a broad range of mammals. They also constitute a major public health concern due to the HIV/AIDS pandemic. Until recently, lentiviruses were regarded as a young retroviral genus and no endogenous counterparts were known. This changed in 2007, when the first endogenous lentivirus was discovered in the rabbit genome (Katzourakis et al. 2007). There followed the discoveries of other endogenous lentiviral lineages in lemurs, ferrets and colugos (Gifford et al. 2008; Cui and Holmes 2012; Hron et al. 2014). All these lineages are quite distant from the extant lentiviruses, forming deep, separate branches in the lentiviral phylogeny.
The lemur virus, pSIV, is the only documented case of endogenous lentivirus in primates. Its individual proviral sequences integrated ∼3–6 Ma (Gifford et al. 2008; Gilbert et al. 2009). Lentiviral endogenization in rabbits and ferrets seems to have occurred deeper in the past—∼12 Ma (Keckesova et al. 2009; van der Loo et al. 2009; Cui and Holmes 2012; Han and Worobey 2012). The oldest known lentiviral lineage is represented by the colugo endogenous lentivirus, ELVgv. The dates of the individual ELVgv integrations fall into the 5–30 Ma interval (Hron et al. 2014; Han and Worobey 2015). In all of the earlier-mentioned cases, no detailed phylogenetic analysis was performed that could be used to derive the evolutionary history of the ERV lineage.
The Malayan colugo (Galeopterus variegatus), the modern descendant of an ancient ELVgv host, is a mammal found in Southeast Asia. It belongs to the order Dermoptera, which contains only two extant genera, Galeopterus and Cynocephalus, which split ∼15 Ma (Janecka et al. 2008). The Dermoptera are considered the closest order to the order primates, from which they split ∼81 Ma (Hedges et al. 2006; Janecka et al. 2007).
In this work, we focus on the endogenous lentivirus ELVgv in the colugo genome. It is the oldest lentiviral lineage described to date and can therefore provide a valuable insight into the origins of lentiviruses. Using genomic DNA samples from multiple dermopteran species, we uncovered the evolutionary history of ELVgv and estimated the time when it invaded the host genome. To obtain indirect evidence of past retroviral infections in Dermoptera, we also sequenced the dermopteran TRIM5 restriction factor and described the signature of its positive selection.
Results and Discussion
Detection of ELVgv Integrations in Dermoptera
In our previous work, we showed the presence of ELVgv in the genomic draft assembly of Malayan colugo (Hron et al. 2014). This is the only dermopteran species whose genome assembly is publicly available (GenBank: GCA_000696425; the specimen that was sequenced is designated here as GVAgb). To narrow down the time interval of ELVgv endogenization, we decided to detect its sequence in the genomes of different colugo specimens. Three samples of genomic DNAs, covering both of the extant dermopteran genera, were kindly provided by W. Murphy (Texas A&M University). These included two G. variegatus subspecies (designated as GVA3, and GVA5) and Cynocephalus volans (CVO) (Janecka et al. 2008). Due to the very low amounts of DNA available, we performed most of the following experiments with whole genome amplified samples (see Materials and Methods section).
First, we checked for the presence of an ELVgv proviral sequence in the dermopteran samples. This was done by PCR amplification with two primer pairs targeting the ELVgv reverse transcriptase (RT), the most conserved retrovirus gene. Interestingly, we confirmed the presence of ELVgv sequences in all the genomic samples analyzed (fig. 1; RT1 and RT2). To describe the pattern of particular proviral integrations in Dermoptera, we then focused on three full-length ELVgv copies previously described in GVAgb genome assembly (designated here as A, B and C, corresponding to proviruses I, II and III, respectively, in the previous study) (Hron et al. 2014). Using primers that specifically amplify the junctions of viral 3′-LTR and dermopteran genomic DNA, we detected all three proviral integrations in each dermopteran specimen (fig. 1; 3′ junction). PCR analysis with primers detecting empty pre-integration sites did not yield any product, which implies that all three integrations are homozygous in the animals tested. To exclude cross-contamination and wrong identification of genomic DNA in our samples, we PCR-amplified and sequenced control genomic loci in dermopteran genes previously described (Janecka et al. 2008). Their comparison with previously published sequences for individual species was in good agreement (supplementary fig. S1, Supplementary Material online), confirming the identity of the genomic samples and the absence of contamination.
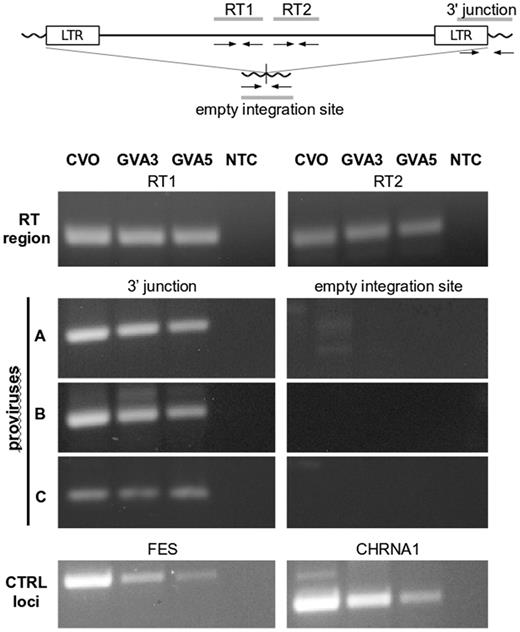
Detection of ELVgv integrations in the dermopteran genomic samples. Upper: schematics of ELVgv provirus with primer positions. Lower: PCR amplifications using primers targeting two regions of the ELVgv reverse transcriptase (RT), the three individual virus-host junctions and their corresponding pre-integration sites (proviruses A, B, and C), and two control loci (FES, CHRNA1) in dermopteran genome (Janecka et al. 2008). CVO, C. volans specimen; GVA3, GVA5, G. variegatus specimens; NTC, nontemplate PCR control.
These results imply that the A, B andC integrations all occurred in the common ancestor of Galeopterus and Cynocephalus and therefore must be older than the split of both species (∼15.3 Ma; Hedges et al. 2006). These are surprising findings, considering the fact that the provirus A integration was previously estimated to have taken place in the interval of 5.1–10.3 Ma (Hron et al. 2014).
Sequencing of ELVgv Proviruses in Dermopteran Specimens
To obtain more information for each of the ELVgv integrations (A, B and C), we decided to sequence proviral DNA from all three dermopteran individuals (GVA3, GVA5, CVO). Due to the limited amount and fragmentary nature of whole genome-amplified DNA, we decided to sequence only the 5′ parts of the proviruses (fig. 2). Using a set of primers anchored in the 5′ flank of the dermopteran genome and in the proviral regions, we amplified and sequenced four ELVgv fragments ∼3 kilobases (kb) in length and four shorter fragments 0.7–1 kb in length. In the GVA3 specimen, we were able to amplify only the very end of the provirusC sequence, probably either due to the low quality of whole genome-amplified template DNA or due to the mutations/deletions in the regions targeted by the primers. The short sequence amplified was excluded from further analyses. All together, we obtained a total of 11 partial ELVgv sequences from four animals, including three provirus sequences reconstructed in silico in GVAgb genome assembly (GenBank: KX022581-9).
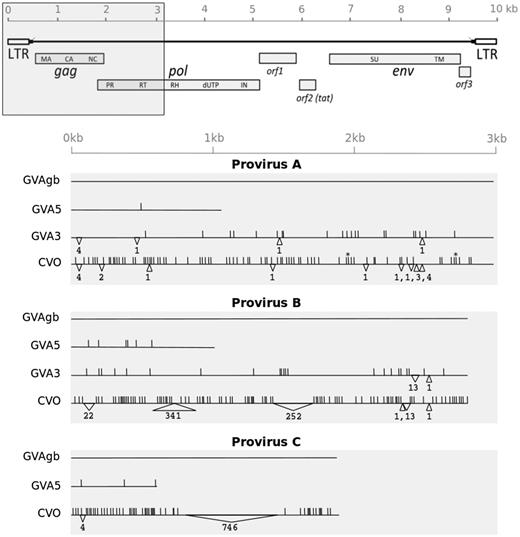
Sequence variability of three ELVgv proviruses integrated in the dermopteran genome. Upper: Schematic depiction of ELVgv genomic organization (Hron et al. 2014). Region analyzed by sequencing is highlighted by grey box. Lower: Graphical representation of individual partial proviral sequences, with scale indicated earlier. Each line represents one proviral sequence in particular specimen (CVO, GVA3, GVA5, GVAgb). Three blocks of lines correspond to the three proviral integrations (A, B, and C), where the sequence from GVAgb is taken in each case as a reference. Vertical lines indicate single nucleotide substitutions relative to the reference sequence. Insertions and deletions are depicted by upward and downward-pointing triangles, respectively, with the length indicated below. Heterozygous sites are indicated by asterisks.
The A, B and C proviruses, which represent independent integration events, are mutually different, as described before (Hron et al. 2014). All proviral sequences analyzed contain number of nonsense mutations and indels in their coding regions (supplementary fig. S2, Supplementary Material online). Moreover, each provirus differs in many sites between individual animals (fig. 2). These differences have accumulated in the provirus after the split of the dermopteran lineages analyzed. The differences detected include: substitutions, short indels and three long insertions (formed by integrations of SINE and LINE repetitive elements). For each provirus, the sequences in CVO always substantially differ from the sequences in Galeopterus (GVA3, GVA5, GVAgb), reflecting the separate evolution of the Cynocephalus and Galeopterus species. The pattern of sequence differences observed for each proviral integration enabled us to analyze the ELVgv evolutionary history in Dermoptera.
Improved Timing Estimates of ELVgv Integrations
As mentioned earlier, the fact that the A, B, and C proviruses can be detected in both the Cynocephalus and Galeopterus genomic DNA samples indicates that they all entered the dermopteran germline before the two genera diverged (∼15.3 Ma). Furthermore, ELVgv is limited exclusively to Dermoptera and is not found in other mammals (Hron et al. 2014). Since Dermoptera split from the other mammals ∼81.3 Ma (Hedges et al. 2006), the time interval when ELVgv endogenization must have occurred is 15.3–81.3 Ma.
Previously, the LTR-aging method has been used to date ELVgv integrations (Hron et al. 2014). The method used a range of average mammalian substitution rates (2.2–4.5×10 − 9 per site per year). However, this range represents only a rough estimate, as substitution rates greatly vary across species and genomic loci (Hodgkinson and Eyre-Walker 2011). We therefore decided to calculate relevant locus-specific substitution rates to obtain more accurate dates for ELVgv integrations (Martins and Villesen 2011). As mentioned earlier, we partially sequenced ELVgv proviruses in both Galeopterus and Cynocephalus, whose divergence time is known. This enabled us to estimate the substitution rate for each proviral locus (table 1; details available in Materials and Methods). These estimated substitution rates were 0.95, 1.25 and 1.57×10 − 9 per site per year for provirus A, B and C, respectively. For control purposes, we also calculated substitution rates for several dermopteran genes for which both Galeopterus and Cynocephalus sequences are publicly available, obtaining values in the range of 0.732–1.34×10 − 9 per site per year. All the estimates we obtained show only slight variation and are substantially lower than the average mammalian rates used in previous works. These new low values are consistent with a recent study that proposed an average dermopteran substitution rate of 0.69×10 − 9 per site per year (Perelman et al. 2011).
Dermopteran Substitution Rate Calculation and LTR Aging of ELVgv Proviruses.
| Provirus | Divergence between GVA and CVO [substitutions/nt] | Substitution Rate [substitutions/nt/year] | Integration Time Estimation Based on LTR Aging | ||||
|---|---|---|---|---|---|---|---|
| GVAgb/CVO | GVA5/CVO | GVA3/CVO | Average | LTR Divergence [substitution/nt] | Age Estimate [millions of years] | ||
| A | 0.0263 | 0.0328 | 0.0281 | 0.0291 | 0.95×10⁻⁹ | 0.0401 | 21.1 |
| B | 0.0382 | 0.0384 | 0.0379 | 0.0381 | 1.25×10⁻⁹ | 0.0937 | 37.6 |
| C | 0.0462 | 0.0500 | – | 0.0481 | 1.57×10⁻⁹ | 0.1259 | 40.0 |
We used the LTR-aging method with these new values and obtained more accurate estimates for the A, B and C integration ages: 21.1, 37.6 and 40.0 Ma, respectively (table 1). This almost doubles the ages suggested previously (Hron et al. 2014). This is consistent with the earlier-mentioned broad time interval for ELVgv endogenization (15.3–81.3 Ma). On the other hand, the LTR-aging method may yield too low an estimate in cases where gene conversion between 5′ and 3′ LTRs occurred (Kijima and Innan 2010). Moreover, the estimated ages of very old integrations may be imprecise, as the more recent substitution rates on which they are based might not apply.
More information about the age of ERV integration can be obtained in cases where the genomic locus containing ERV integration site is duplicated. This has previously been used to corroborate the age estimates for RELIK infiltration into the rabbit genome (Katzourakis et al. 2007) and for ELVgv infiltration into the colugo genome (Hron et al. 2014). The weak point of this method is that it is dependent on the correct genomic assembly of the duplicated regions, a task made extremely difficult due to their high degree of similarity.
In view of this, we proceeded to experimentally confirm the presence of the putative ELVgv-containing duplications in our genomic DNA dermopteran samples using quantitative digital droplet PCR (ddPCR) method. Out of the seven previously described ELVgv integrations in duplicated regions (Hron et al. 2014), only two were suitable for PCR primer design due to their extremely high genomic repeat content. One of these regions (region G2; supplementary fig. S3, Supplementary Material online) shows copy number values consistent with duplication or even multiplication. However, the other region (region G1; supplementary fig. S3, Supplementary Material online) has a copy number consistent with single copy genomic locus. For control purposes, we also tested two out of three putatively duplicated RELIK integrations in the rabbit genome (Katzourakis et al. 2007). Both of these regions yielded copy number values confirming their multiplication. These data indicate that duplications implied by genomic assemblies might be incorrect. Their confirmation by experiment is, therefore, required for this aging method to be reliable.
Evolutionary History of ELVgv
It is generally assumed that all proviruses forming a single ERV group are the descendants of a single original integration (Jern and Coffin 2008). To describe the mutual relationships of A, B and C proviruses, we constructed their maximum likelihood (ML) phylogeny (fig. 3B). The tree topology was strongly supported by high bootstrap values. As expected, the branches corresponding to each provirus cluster monophyletically, which is consistent with the finding that their integrations precede the split of the species analyzed. The tree also indicates that the most recent common ancestor (MRCA) of A and B originated from the MRCA of all three proviruses. Additionally, divergences between 5′ and 3′ LTRs (table 1), which reflect the accumulated evolutionary changes following proviral integration, were used to identify points corresponding to the provirus integrations. The distance was measured from the tips of the GVAgb branches, for which the LTR aging had been calculated (fig. 3B; arrows). As expected, the estimated integrations lie, in all three cases, on the branch corresponding exclusively to the provirus concerned and precede the MRCA of the species analyzed. The ML phylogeny was further corroborated using the Bayesian approach. The tree topology and branch lengths of the Bayesian tree were in good agreement with the ML tree (data not shown).
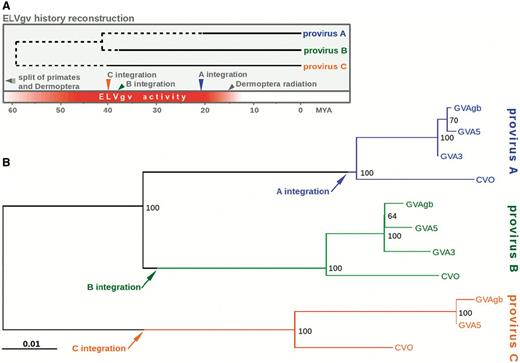
Evolutionary analysis of three ELVgv integrations. (A) Schematic depiction of ELVgv life history. The bottom axis depicts evolutionary time since present in millions of years. Ages of the most recent common ancestors of analyzed proviruses were estimated from ML phylogeny by assuming a known time of the Galeopterus/Cynocephalus split. Dashed line indicates the time preceding the integration of each provirus. Various evolutionary events are shown in the bottom part of the scheme. (B) ML tree of ELVgv proviral nucleotide sequences. Different colors correspond to the three proviral integrations (A, B, and C). Numbers next to nodes correspond to bootstrap values. Points corresponding to the estimated integration events of each provirus (details in main text) are depicted by arrows. Scale bar represents number of substitutions per nucleotide.
According to the molecular clock hypothesis, the nodes of a phylogenetic tree can be calibrated using known evolutionary events, such as species divergence times (Drummond et al. 2006). Our ML phylogeny, coupled with the use of the Galeopterus/Cynocephalus divergence time as a calibration constraint, allowed us to estimate the time when different ELVgv lineages originated (fig. 3A). The ages of the A/B and A/B/C MRCAs were estimated at ∼40 and 60 Ma, respectively. We corroborated the ML analysis by the Bayesian approach using BEAST2 (Bouckaert et al. 2014). This approach yielded the estimated ages of 37.1 Ma (95% highest posterior density interval 27.6–46.0) for the A/B MRCA and 53.1 Ma (38.1–65.9) for the A/B/C MRCA. These intervals are consistent with the ML estimates.
Taken together, this phylogenetic analysis allowed us to estimate the evolutionary ages of individual ELVgv integrations and the relationships between them. We show that ELVgv infiltration of the dermopteran germline occurred approximately between 60 and 20 Ma. However, these data should be regarded with caution. One reason is that the virus life history from the MRCA until the time of the provirus integration may have involved exogenous stages, i.e., the endogenous copy may have undergone several cycles of reinfection or retrotransposition. During such stages, the virus would have been subjected to exogenous retrovirus substitution rates, which are six orders of magnitude higher than neutral host substitution rates (Li et al. 1988). This would have reduced the estimated MRCA-to-integration interval. This uncertain part of ELVgv’s life history is denoted by the dashed line (fig. 3A).
The time we propose for ELVgv endogenization implies that this lentiviral lineage infected the ancestors of the extant Dermoptera after their split from the other mammalian orders. As ELVgv is the most ancient lentivirus identified to date, the genus Lentivirus originated >40 Ma, possibly even >60 Ma, i.e., before the beginning of the Cenozoic era. This age is still much lower than the presumed origin of the rest of the retroviral family, which is estimated to be >100 My old (Katzourakis et al. 2009; Johnson 2015). If more endogenous lentiviral sequences are found, it is possible that the origin of the lentiviral genus will be moved even further into the past.
Identification and Positive Selection Analysis of Dermopteran TRIM5
As the long-term occurrence of retroviral infections usually creates a selective pressure on host antiretroviral factors, we tried to investigate the pattern of positive selection acting on one of the most studied host restriction factors, TRIM5. We chose the longest TRIM5α protein isoform, which was reported to have the restriction activity (Stremlau et al. 2004). First, we assembled a TRIM5α coding sequence (GenBank: BK009414) from publicly available RNA-seq data from GVAgb (details in Materials and Methods). This sequence is predicted to encode a protein of 486 amino acids, with one noncoding and seven coding exons, similarly to human TRIM5α structure. Using this sequence information, we designed primers to amplify and sequence TRIM5α coding regions from the dermopteran genomic DNA samples (GVA3, GVA5, CVO). In addition to the TRIM5α sequence from GVAgb reconstructed in silico, we obtained >91% of the TRIM5α coding sequences from GVA3, GVA5 and CVO (GenBank: KX022578-80). To check that we sequenced real orthologs of TRIM5 and not some other member of the TRIM family, we constructed a ML tree for the dermopteran sequences along with TRIM5 and its closest paralogs (TRIM22 and TRIM33) from other mammals (supplementary fig. S4, Supplementary Material online). This constitutes the first experimental identification of an antiviral restriction factor from the order Dermoptera.
To analyze the selection pressures acting on the TRIM5 restriction factor, we used the dataset of dermopteran coding sequences together with sequences from selected primates, which represent the closest order to the order Dermoptera. The ML tree generated from these TRIM5α sequences showed the well-supported topology corresponding to the phylogenetic relationships expected between the species (fig. 4).
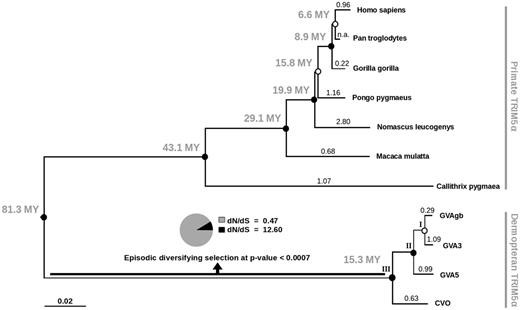
Analysis of selective pressures acting on TRIM5α sequence in dermopteran and primate species. ML tree of TRIM5α coding nucleotide sequences is shown. Bootstrap support values are depicted either as closed circles (bootstrap support > 95%) or open circles (bootstrap < 95%) for each node. Ages of most recent common ancestors, suggested in TimeTree (Hedges et al. 2006), are denoted next to the corresponding nodes in millions of years (MY). Values above terminal branches correspond to mean dN/dS estimates calculated in Datamonkey. This values do not differ by > 10% from the results obtained using PAML (data not shown). Result from the branch-site REL test for episodic positive selection performed in Datamonkey is shown for the branch leading to the dermopteran clade (node III). Specifically, dN/dS estimates of the two classes of codons with the percent of codons falling into each class are depicted. Scale bar represents number of substitutions per nucleotide.
The general measure of natural selection is the dN/dS, i.e., the ratio of the nonsynonymous substitution rate (dN) and the synonymous substitution rate (dS) pertaining to the coding sequence analyzed. To estimate dN/dS values for our dataset, we used the PAML 4.7 software (Yang 2007) and the Datamonkey web server (Pond and Frost 2005a; Delport et al. 2010). In agreement with previous studies (Sawyer et al. 2007), the overall dN/dS calculated for each branch (fig. 4) showed alternating patterns of positive selection among primate species. In the dermopteran branch, the values do not point to strong positive selection.
In general, the majority of sites in a protein are subjected to purifying selection pressure conserving the protein function and only a few sites are free to diversify (Yang et al. 2000). Therefore, we also employed more sensitive branch-site model analysis assuming the variation of dN/dS in each sequence (Yang and Nielsen 2002; Zhang et al. 2005) and calculated the significance of positive selection for each branch using likelihood-ratio test. Specifically, we used the branch-site model of positive selection (Zhang et al. 2005) in the PAML software and the branch-site Random Effect Likelihood (REL) test for episodic positive selection (Pond et al. 2011) in Datamonkey. The results are summarized in table 2. As expected, highly significant positive selection (dN/dS = 4.0 in 16.3% of the amino acid residues, P value < 0.0001) was detected for the entire primate clade. In contrast, no evidence of positive selection was detected for individual dermopteran species nor for the internal branches of the dermopteran clade (fig. 4; nodes I and II). Importantly, Datamonkey detected strong positive selection (dN/dS = 12.6 in 10.4% of the amino acid residues, P value = 0.0007) in the MRCA of the dermopteran clade (fig. 4; node III). PAML analysis yielded similar results with similar significance levels.
Significance of Positive Selection Pressure Acting on TRIM5α in Particular Primate and Dermopteran Lineages.
| Clade | Test of Positive Selection (PAML)a | Test of Episodic Positive Selection (Datamonkey)b | ||||
|---|---|---|---|---|---|---|
| dN/dS (%)c | LRT | P valued | dN/dS (%)c | LRT | P valued | |
| GVAgb | n.a. | 0.000 | 1.0000 | 737.2 (0.3%) | 7.988 | 0.0400* |
| GVA3 | n.a. | 0.000 | 1.0000 | 1.8 (43.0%) | 0.068 | 1.0000 |
| GVA5 | n.a. | 0.000 | 1.0000 | 1.1 (80.1%) | 0.014 | 1.0000 |
| CVO | n.a. | 0.000 | 1.0000 | 275.2 (0.4%) | 1.868 | 0.8587 |
| Node I | 8.0 (11.1%) | 0.630 | 0.4275 | 3.0 (66.8%) | 0.677 | 1.0000 |
| Node II | n.a. | 0.000 | 1.0000 | 25.8 (0.9%) | 1.979 | 0.9567 |
| Node III | 19.6 (5.1%) | 10.352 | 0.0013** | 12.6 (10.4%) | 15.686 | 0.0007*** |
| Dermoptera | 5.8 (2.6%) | 2.233 | 0.1351 | – | – | – |
| Primates | 4.0 (16.3%) | 23.402 | <0.0001**** | – | – | – |
aBranch-site test of positive selection in codeml program of PAML package.
bBranch-site REL test for episodic positive selection in Datamonkey web server.
cdN/dS ratio estimate of the class of codons under positive selection with the percentage of codons falling into this class designated in parentheses.
dP values calculated from likelihood ratio test (LRT) statistics, level of significance is expressed by asterisk.
Next, we tried to locate the individual sites under positive selection in the dermopteran TRIM5α. We calculated the dN/dS values for each position across the entire TRIM5α alignment (supplementary fig. S4, Supplementary Material online). Clusters of residues with high dN/dS values clearly overlap with the V1–V4 variable regions in the B30.2 domain. These variable regions are known to determine the virus specificity of the TRIM5α restriction activity (Yap et al. 2005; James et al. 2007). Further, individual TRIM5α residues subjected to statistically significant positive selection were detected using the REL (Pond and Frost 2005b) and Mixed Effects Model Evolution (MEME) analyses (Murrell et al. 2012) implemented in Datamonkey (supplementary fig. S4, Supplementary Material online). These analyses identified 16 positively selected TRIM5α residues with P value <0.05 (for MEME) or Bayesian factor > 50 (REL). More than 80% of these sites were also confirmed (with posterior probability > 90%) by BEB analysis in PAML (Yang et al. 2005). Six out of eight of the positively selected residues detected in the B30.2 domain reside in the variable regions, as depicted in the protein alignment (supplementary fig. S4, Supplementary Material online). Interestingly, at five positively selected positions in the B30.2 domain, the specific amino acid residue was conserved in all dermopteran sequences. This suggests that the positive selection did not act on these residues after the divergence of the extant dermopteran species, but may have acted on their ancestor.
In summary, we obtained strong evidence that TRIM5 was under positive selection pressure exclusively in the common ancestor of the extant Dermoptera and not in the individual dermopteran species. This implies that the selection of the dermopteran TRIM5 is episodic in nature and could have occurred anytime since the origin of the dermopteran lineage up until the diversification of its extant species. We were not able to specify the timing of this episode more precisely, because no other extant dermopteran species are known. Interestingly, this interval includes the period of ELVgv endogenization. Therefore, ELVgv could have contributed to the observed selection pressure on TRIM5. As TRIM5α restricts a broad range of retroviruses (Wolf and Goff 2008), any such retrovirus species that infected the dermopteran ancestor could have also participated in the selection. Indeed, the Galeopterus genome assembly contains multiple ERV lineages in addition to ELVgv (data not shown). Further experimental work, including functional assays, would be needed to support the existence of an arms race between the dermopteran TRIM5 and ELVgv. Such a scenario has been proposed for the RELIK endogenous lentivirus, where virus presence correlates with the positive selection of lagomorph TRIM5 (Fletcher et al. 2010; de Matos et al. 2011; Yap and Stoye 2013). A previous study of various lemur species showed that the variation of TRIM5α restriction specificity depends on the presence of insertion in the V2 region of the B30.2 domain (Rahm et al. 2011). Interestingly, the V1, V2 and V3 regions of the dermopteran TRIM5α contain several short indels, when compared with primate sequences (supplementary fig. S4, Supplementary Material online). Further analysis of the impact of these mutations on TRIM5α antiretroviral activity could provide valuable insight into the evolution of this restriction factor in the dermopteran lineage.
Conclusion
The analysis of orthologous proviral sequences from several dermopteran species allowed us to study the evolutionary history of the ELVgv endogenous lentivirus residing in the colugo genome. Our findings strongly suggest that this virus represents the oldest evidence of lentiviral existence to date and move the estimated origin of the lentivirus genus substantially deeper into the past. ELVgv was probably active during a broad time interval prior to the divergence of the extant dermopteran species, ∼20–60 Ma. We also provide evidence for episodic positive selection acting on the TRIM5 antiviral restriction factor in the common ancestor of the extant Dermoptera. Furthermore, we describe several positively selected residues of the TRIM5α protein which may be involved in its antiviral activity.
Materials and Methods
Whole-Genome Amplification and Validation of Dermopteran Samples
Genomic DNA samples of two G. variegatus subspecies (G. v. peninsulae, designated as GVA3 and G. v. variegatus, designated as GVA5) and of C. volans (CVO) were provided by W. Murphy (Texas A&M University). The sample identity was confirmed by PCR amplification of FES and CHRNA1 loci, which were described for these specimens before (Janecka et al. 2008), using Colugo1F/1R and Colugo2F/2R primer pairs, respectively (supplementary table S1, Supplementary Material online). The CHRNA1 locus was verified by sequencing of the PCR products in all specimens and comparison with previously described sequences. Due to the very low amounts of DNA, the whole genome amplification of samples was performed using the Illustra GenomiPhi V2 DNA Amplification Kit (GE Healthcare), as described by the manufacturer.
PCR Amplification and Sequencing of ELVgv Proviruses and TRIM5 Orthologs
The ELVgv RT region was amplified using two primer pairs, ELVgvF1/R1 and ELVgvF2/R2 (supplementary table S1, Supplementary Material online), yielding PCR products of ∼245 and 215 bp, respectively. The short junctions between ELVgv 3′ end and the dermopteran genomic DNA were amplified with one primer anchored in ELVgv 3′-LTR (primer ColugoLTR) and the second primer anchored in the 3′ flanking region of proviruses A, B and C (primers ColugoA1/B1/C1). The PCR products from proviruses A, B and C were 359, 337 and 268 bp long, respectively, and their identity was verified by sequencing. The empty pre-integration sites were detected using primer pairs ColugoA1/A2, ColugoB1/B2 and ColugoC1/C2. To amplify the 3-kb regions from 5′ parts the ELVgv proviruses, a semi-nested PCR approach was used: first amplification was performed with internal viral primer ELVgvR1 and a second primer anchored in the 5′ flanking region of proviruses A, B and C (primers ColugoA2/B2/C2). Second PCR was then performed with viral primer ELVgvR2 and the same flanking primer as in the first PCR. In cases when this approach was not successful, variant viral primers ELVseq8 or ELVseq10, closer to the 5′ flank, were used. The PCR products obtained were sequenced; in cases when heterozygosity was detected, the products were subcloned and multiple clones were resequenced.
TRIM5α sequence of G. variegatus was reconstructed using the colugo genome draft assembly and high-throughput genomic and RNA-seq data (accession numbers: SRR585693, SRR593622, SRR1261671, and SRR1261617) available at the National Center for Biotechnology Information (NCBI) sequence read archive (SRA). Based on this sequence, the following PCR primers were designed to amplify and sequence TRIM5α gene fragments from dermopteran genomic DNA: Trim_f1/Trim_r1 for amplification of exons 2 and 3; Trim_f2/Trim_r2 for exon 4 amplification; Trim_f3/Trim_r3 for amplification of exons 6, 7, and 8.
Datasets
A total of 11 proviral nucleotide sequences were used in evolutionary analysis of ELVgv. These sequences correspond to three sets of orthologous viral integrations in four dermopteran specimens.
To detect the signature of positive selection acting on the dermopteran and primate TRIM5 orthologs, protein-coding nucleotide sequences with following GenBank accession numbers were used: Homo sapiens (NM_033034), Pan troglodytes (NM_001012650), Gorilla gorilla (AY843510), Pongo pygmaeus (AY843513), Callithrix pygmaea (AY843512), Nomascus leucogenys (DQ229283), Macaca mulatta (AY523632), and four dermopteran sequences.
In the phylogenetic analysis of dermopteran and primate TRIM paralogs, following protein-coding nucleotide sequences were used in addition to the TRIM5 dataset mentioned earlier: M. mulatta TRIM22 (NM_001113359), Pongo abelii TRIM22 (NM_001159808), H. sapiens TRIM22 (NM_006074), P. troglodytes TRIM22 (NM_001113396), G. gorilla TRIM22 (XM_004050562), P. abelii TRIM5 (NM_001131070), Callithrix jacchus TRIM5 (XM_009007572), C. jacchus TRIM22 (XM_009007574), N. leucogenys TRIM22 (NM_001280099), H. sapiens TRIM34 (NM_001003827), P. troglodytes TRIM34 (NM_001205177), C. jacchus TRIM34 (XM_009007571), N. leucogenys TRIM34 (XM_003254844).
Copy-Number Analysis of Putative Genomic Duplications
For accurate absolute quantification of putatively duplicated genomic loci, ddPCR system QX200 (Bio-Rad, Hercules, CA) was used. Each reaction mixture had a total volume of 20 μl, containing 1× QX200 ddPCR Evagreen Supermix (Bio-Rad), 1 ng of genomic DNA (without whole genome amplification), and 250 nM (each) the forward and reverse primers. The reactions were treated for droplet generation according to the manufacturer’s manual and then amplified with the following conditions: 1 cycle of 5 min at 95 °C and then 40 cycles consisting of 15 s at 95 °C and 40 s at 59 °C followed by 1 cycle of 5 min at 72 °C, 5 min at 4 °C and 5 min at 90 °C. Samples were analyzed by droplet reader and QuantaSoft software (Bio-Rad) with thresholds set manually. Primers used for ddPCR (supplementary table S1, Supplementary Material online) were: RbXf and RbXr (control genomic locus in rabbit X chromosome; oryCun2 rabbit genomic assembly, chrX:15,687,175-259); RbYf and RbYr (control genomic locus in rabbit Y chromosome; GenBank: AY785433); R1f and R1r (R1 putative duplication in rabbit genome; GenBank: AAGW02078017); R2f and R2r (R2 putative duplication in rabbit genome; GenBank: AAGW02075161); Chrna1f and Chrna1r (CHRNA1 control locus in dermopteran genome). Two putative duplications of ELVgv integration sites (Hron et al. 2014) were analyzed; region G1 (GenBank: JMZW01362493) and region G2 (GenBank: JMZW01477984). For each region, two ddPCR primer pairs were used: one primer pair overlapped the LTR-host DNA junctions (G1f1 and G1r1 for region G1, G2f1 and G2r1 for region G2), the second primer pair was located outside the virus sequences in the flanking regions (G1f2 and G1r2 for region G1, G2f1 and G2r2 for region G2).
Phylogenetic Analysis
Nucleotide sequences were aligned using the MUSCLE algorithm implemented in MEGA 6 software (Tamura et al. 2013) and checked manually. ML phylogeny was generated using MEGA 6. All positions containing gaps and missing data were excluded. This resulted in dataset with a total of 571 positions for alignment of 11 ELVgv proviral sequences, 1278 positions for alignment of 24 TRIM5/22/34 sequences, and 1305 positions for alignment of 11 TRIM5α sequences. Kimura 2-parameter (K2P) model with uniform rates among sites was used for all datasets. Bootstrap support for each node was evaluated with 1000 replicates.
Bayesian-based phylogenetic tree was reconstructed using BEAST2 software (Bouckaert et al. 2014). K2P model with gamma distribution (4 categories) of rates among sites was used as a substitution model, and Yule speciation model was used as a tree prior. Markov chain Monte Carlo (MCMC) run with 10 millions of generations was done. Trees were sampled every 1000 generations. Effective Sample Size (ESS) values of all parameters were >200. Consensus tree was constructed using TreeAnnotator software included in BEAST2 package.
Substitution Rate Estimation and LTR Aging
Substitution rates for specific loci in the dermopteran genome were estimated using calibration constraints assuming the Galeopterus and Cynocephalus split time as 15.3 Ma (Hedges et al. 2006). Specifically, the genetic distance between orthologous sequences in Cynocephalus and Galeopterus species were calculated using the K2P model with uniform rates among sites. Substitution rates were determined by dividing the average Galeopterus/Cynocephalus genetic distance for each locus by 2 times multiplied Galeopterus and Cynocephalus split time. These substitution rates were used for the proviral integration dating by the LTR-aging method (Johnson and Coffin 1999).
Time-Calibrated Phylogeny of ELVgv Proviruses
Molecular dating analysis of proviral sequences was performed either by using the ML-based RelTime method implemented in MEGA 6 (Tamura et al. 2013) or by Bayesian method with BEAST2 software (Bouckaert et al. 2014). Relative times were optimized and converted to absolute divergence times based on the calibration constraints assuming Galeopterus/Cynocephalus split time to 15.3 Ma (Hedges et al. 2006). In the ML approach, the same parameters as in phylogeny reconstruction were used. The suitability of molecular clock assumption was not rejected at a 5% significance level by comparing the ML value for the given topology with and without the molecular clock constraints.
In the BEAST analysis, the sequence evolution was assumed to follow relaxed molecular clock with lognormal distribution, which was shown as an appropriate model for this type of analysis (Drummond et al. 2006). K2P with gamma distribution (4 categories) of rates among sites were used as a substitution model. Yule speciation process was used as a tree prior. Markov chain Monte Carlo (MCMC) run with 10 millions of generations was performed with sampling every 1000 generations. ESS values of all parameters were >200.
Lineage-Specific Analysis of Positive Selection
Overall dN/dS for each branch, so-called branch model (Yang 1998; Yang and Nielsen 1998), of TRIM5α phylogeny was determined using codeml program of the PAML 4.7 package (Yang 2007) and REL method in the Datamonkey web server (Pond and Frost 2005a; Delport et al. 2010). For codeml program, several simulations of a free-ratio model were performed with F3X4 codon frequency model and multiple seed dN/dS values to ensure convergence of parameter optimization. In datamonkey analysis, Codon Model Selection (CMS) module was used to select the best fitting substitution model. The dN/dS variation across branches was also confirmed by comparing the one-ratio model with the free-ratio model in PAML (data not shown).
In the further analysis, the model assuming several groups of residues specified by different dN/dS for each branch was employed (branch-site model). Presence of positive selection acting on particular branches was tested with branch-site model of positive selection in codeml program (Zhang et al. 2005). Specifically, modified branch-site model A (model = 2 NSsites = 2) was compared with the null model (dN/dS value is fixed to 1) using Likelihood Ratio Test (LRT). P values corresponding to positive selection significance were calculated based on LRT statistics. Alternatively, branch-site REL test for episodic positive selection (Pond et al. 2011) in Datamonkey web server was employed. Similarly to PAML analysis, LRT statistics was used to evaluate significance of positive selection acting on particular branches of TRIM5alpha phylogeny. The P values were corrected for multiple testing using the Holm–Bonferroni method.
Site-Specific Analysis of Positive Selection
The REL method (Pond and Frost 2005b) and MEME method (Murrell et al. 2012) implemented in the Datamonkey web server were used to detect positively selected residues in the TRIM5α protein sequence. REL is an extension of a well-known codon-based selection analysis. MEME is a more specialized codon-based method to detect episodic selection pressure (Murrell et al. 2012). P values representing significance of positive selection for each site were calculated using LRT statistics. BEB positive selection analysis (Yang et al. 2005) implemented in PAML 4.7 was performed under M2a site model and used as a validation of the REL method.
Acknowledgments
The authors thank William Murphy for providing the dermopteran genomic DNA samples. This work was supported by the Czech Ministry of Education, Youth and Sports under the program NÁVRAT (LK11215). The work was also institutionally supported by RVO:68378050.
References
Author notes
Associate editor: Harmit Malik
