


Abstract
The Piwi-interacting RNA (piRNA) pathway defends animal genomes against the harmful consequences of transposable element (TE) infection by imposing small-RNA-mediated silencing. Because silencing is targeted by TE-derived piRNAs, piRNA production is posited to be central to the evolution of genome defense. We harnessed genomic data sets from Drosophila melanogaster, including genome-wide measures of piRNA, mRNA, and genomic abundance, along with estimates of age structure and risk of ectopic recombination, to address fundamental questions about the functional and evolutionary relationships between TE families and their regulatory piRNAs. We demonstrate that mRNA transcript abundance, robustness of “ping-pong” amplification, and representation in piRNA clusters together explain the majority of variation in piRNA abundance between TE families, providing the first robust statistical support for the prevailing model of piRNA biogenesis. Intriguingly, we also discover that the most transpositionally active TE families, with the greatest capacity to induce harmful mutations or disrupt gametogenesis, are not necessarily the most abundant among piRNAs. Rather, the level of piRNA targeting is largely independent of recent transposition rate for active TE families, but is rapidly lost for inactive TEs. These observations are consistent with population genetic theory that suggests a limited selective advantage for host repression of transposition. Additionally, we find no evidence that piRNA targeting responds to selection against a second major cost of TE infection: ectopic recombination between TE insertions. Our observations confirm the pivotal role of piRNA-mediated silencing in defending the genome against selfish transposition, yet also suggest limits to the optimization of host genome defense.
Introduction
Transposable elements (TEs) are the exemplar of selfish DNA: abundant and ubiquitous components of eukaryotic genomes that impose a manifold burden on their hosts. TEs drain resources by hijacking cellular machinery to produce mRNAs and proteins that are essential for TE self-replication, yet rarely benefit host cells directly. The act of transposition, furthermore, is mutagenic. Random TE insertions can disrupt functional DNA (Zachar and Bingham 1982; Chen et al. 1987), and double-stranded breaks associated with transposition can have dramatic consequences for genome integrity (Orsi et al. 2010). Finally, even a transcriptionally silent and transpositionally inactive TE can be deleterious to the host by serving as a substrate for ectopic recombination with other related TE insertions scattered throughout the genome (Charlesworth et al. 1986; Langley et al. 1988; reviewed in Hedges and Deininger 2007).
In the ongoing conflict between TEs and their host genomes, no battleground is more critical than the germline, where even the most deleterious TE insertions are heritable. Unrestricted germline TE propagation can also disrupt gametogenesis, sometimes causing complete sterility (Kidwell and Novy 1979; Schaefer et al. 1979). In metazoans, the Piwi-interacting RNA (piRNA) pathway is a critical regulator of germline TE activity (reviewed in Klattenhoff and Theurkauf 2008). This small RNA-mediated silencing pathway acts as a genomic immune system by identifying active TEs and restricting their selfish propagation.
The piRNA pathway is perhaps best understood in the Drosophila melanogaster ovary, where short, antisense TE-derived piRNAs (23–29 nt) complexed with Piwi-clade Argonaute proteins act as global regulators of TE activity, targeting all homologous TEs for transcriptional and post-transcriptional silencing (reviewed in Senti and Brennecke 2010). Antisense piRNAs are thought to derive exclusively from piRNA clusters, genomic regions (up to 240 kb) that harbor predominantly inactive insertions from multiple TE families (Brennecke et al. 2007). piRNA clusters are transcribed as long precursor transcripts spanning multiple independent TE insertions, and are subsequently processed into mature piRNAs. The piRNA pathway also produces sense piRNAs; however, these molecules are less abundant than their antisense counterparts and are not thought to play a direct role in TE-silencing. Rather, they amplify the production of antisense piRNAs through a feed-forward loop called the ping-pong cycle.
The ping-pong cycle is a keystone of the piRNA pathway because it both silences TEs posttranscriptionally and enhances the transcriptional and posttranscriptional silencing capacity of the pathway by producing more piRNAs (reviewed in Klattenhoff and Theurkauf 2008; Senti and Brennecke 2010). Ping-pong amplification occurs exclusively in the germline (Lau et al. 2009; Li et al. 2009; Malone et al. 2009; Haase et al. 2010). The cycle is initiated by an antisense piRNA that identifies a piRNA precursor or full-length TE transcript by base complementarity and targets it for cleavage by a Piwi-clade Argonaute protein (Brennecke et al. 2007; Gunawardane et al. 2007). Cleavage of sense transcripts leads to the production of sense piRNAs, which can initiate production of more antisense piRNAs through the same targeting and cleavage mechanism (Brennecke et al. 2007; Gunawardane et al. 2007). A ping-pong independent mechanism of piRNA production also occurs in both the germline and somatic cells of the Drosophila ovary, in which an unknown nuclease(s) produces predominantly antisense piRNAs from piRNA precursors (Lau et al. 2009; Li et al. 2009; Malone et al. 2009; Haase et al. 2010).
Many important questions about the relationship between the piRNA pool and the TE families that it regulates remain unanswered. For example, although TE transcription and ping-pong amplification are thought to feed forward piRNA production, the degree to which these or other processes determine piRNA abundance remains unknown. It is also not known whether the piRNA pool is most strongly influenced by the absolute number of TEs within a genome, or by other factors such as their location in the genome or their level of transcriptional activity.
From an evolutionary perspective, it is also unclear how selection to defend the genome shapes the piRNA pool. TE activity is highly dynamic over evolutionary time, with host genomes facing a continuous onslaught of reactivated or horizontally transferred TE families. A simple prediction is that selection will act to increase piRNA abundance for those TE families with the greatest capacity to harm their host. However, population genetic theory suggests that host repressor alleles are only likely to fix when they target exceptionally deleterious TE families with high transposition rates (Charlesworth and Langley 1986; Nuzhdin 1999). Therefore, it has been suggested that host repression is most likely to evolve shortly after invasion when transposition rates are high, and that after partial repression is acquired selection for more robust silencing may be weak (Blumenstiel 2011).
Here, we investigate piRNA biology in the D. melanogaster ovary to draw connections between endogenous TE families and piRNA production in a mechanistic and evolutionary framework. We first integrate genomic, mRNA, and small RNA sequence data to identify differences in the abundance, distribution, transcription, and piRNA processing of individual TE families that influence their frequency in the ovarian piRNA pool. We demonstrate that ping-pong amplification, TE transcription and piRNA cluster representation are the most important predictors of TE-derived piRNA abundance, strongly supporting the prevailing model of piRNA biogenesis. To our knowledge, this is the first robust statistical examination of this model. We then explore how selection to avoid two deleterious consequences of TE infection, rampant transposition and ectopic recombination, could shape the composition of the piRNA pool. Although we observe that inactivated TE families are gradually lost from the piRNA pool, as predicted if they are no longer selectively retained, the most abundant TE families in the piRNA pool are not necessarily those with the strongest signatures of recent transposition. We further find no evidence that the piRNA pool is shaped by selection to restrict ectopic recombination between insertions of abundant TE families. Taken together, our data suggest that the relationship between the deleterious capacity of a TE family and the abundance of that TE family among piRNAs is more nuanced than is presented in simple models of genome defense.
Results
What Determines the Differential Abundance of TE Families in the piRNA Pool?
We first sought to identify predictors of variation in piRNA abundance between TE families in the D. melanogaster genome using bivariate linear regression. Sense and antisense piRNAs were examined separately because their mechanisms of biosynthesis and function in TE silencing are distinct: antisense piRNAs are thought to originate exclusively from piRNA precursor transcripts and have a direct role in silencing TEs, whereas sense piRNAs originate from piRNA precursors transcripts or full-length TE transcripts and are not posited to directly silence TEs (reviewed in Klattenhoff and Theurkauf 2008; Senti and Brennecke 2010). For two wild-type strains, wK and w1118, we regressed measurements of the abundance of TE families among sense- and antisense-derived piRNAs onto estimators of the abundance of those TE families across the genome and within piRNA clusters, the abundance of their transcripts, and the mode of processing of those transcripts into piRNAs. Although the genotype, wK or w1118, was not associated with differences in sense or antisense TE-derived piRNA abundance (antisense F1,205 = 0.031, P = 0.86; sense F1,205 = 0.253, P = 0.62), it was included as a factor in every model to account for potential differences between genetic backgrounds. The explanatory power of each model was assessed by F-statistics (supplementary table S1, Supplementary Material online). The data used in these analyses are supplied in supplementary table S2, Supplementary Material online.
piRNA Abundance Correlates with TE Family Abundance Both Genome-Wide and within piRNA Clusters
The genome-wide abundance of TE families is expected to be an important predictor of piRNA abundance, because a higher number of TEs represents a comparatively greater source of TE-derived piRNAs. Consistent with this prediction, we observe that models including the average length of an insertion (average insertion length), the summed total length of all insertions (total insertion length), and the total number of insertions (number of insertions) explain a significant amount of variation in sense and antisense piRNA abundance among TE families (fig. 1A; supplementary table S1, Supplementary Material online).
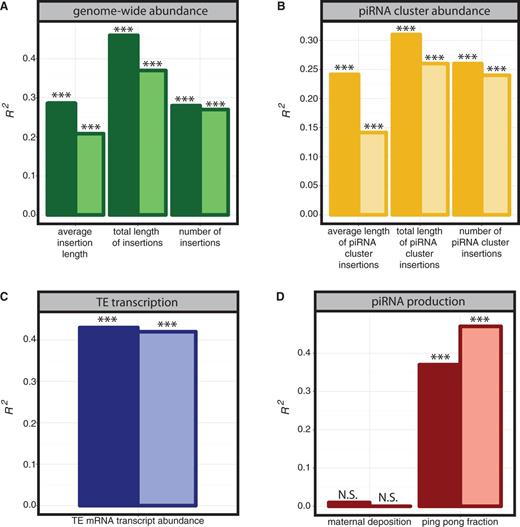
Predictors of TE-derived piRNA abundance. The coefficient of determination (R2) is reported for individual predictors of variation in sense (dark bars) and antisense (light bars) piRNA abundance between TE families. R2 values are from a bivariate regression model including the indicated predictor variable and a factor for genotype (wK or w1118). Variables are grouped into four categories: (A) genome-wide abundance, (B) piRNA cluster abundance, (C) TE transcript level, and (D) piRNA production. piRNA clusters are the 15 major sources of uniquely mapping piRNAs defined in Brennecke et al. (2007) including the following: cluster1/42AB–2R:2144349 … 2386719; cluster2/20A–X:21392175 … 21431907; cluster3/102E–4:1258473 … 1348320; cluster4/XTAS–GenBank L03284.1; cluster5/38C–2L:20148259 … 20227581; cluster6/80E–F 3L:23273964 … 23314199; cluster7–U:4015849 … 4029971; cluster8/flamenco–X:21505666 … 21684449; cluster9/20B–X:21759393 … 21844063; cluster10–U:5766708 … 5772171; cluster11/100F–3R:27895169 … 27905030; cluster12–3LHet:1402377 … 1557939; cluster13–3LHet:2011004 … 2180268; cluster14–U:7542733 … 7545114; and cluster15–3LHet:238123 … 332969. *P < 0.05; **P < 0.01; ***P < 0.001; N.S., P > 0.1.
By assigning piRNAs to unique genomic locations, Brennecke et al. (2007) identified 15 major piRNA clusters that are the source of up to 70% of the wild-type ovarian piRNA pool. These largely heterochromatic piRNA clusters are rich in predominantly inactive TE insertions and are transcribed as long precursor transcripts that are subsequently processed into mature piRNAs (Brennecke et al. 2007; Klattenhoff et al. 2009). Consistent with the role of piRNA clusters in generating precursor piRNAs, models including estimators of abundance in these 15 major piRNA clusters explain a significant amount of variation in sense and antisense piRNA abundance (fig. 1B; supplementary table S1, Supplementary Material online). However, the R2 values of these models are considerably lower than those that consider genome-wide abundance (fig. 1A). This indicates that the genome-wide abundance of TE families explains more variation in piRNA production than the abundance of those families in piRNA clusters. Genome-wide abundance likely explains more variation in piRNA abundance because abundant TE families produce more transcripts that are later processed into mature piRNAs. However, we cannot exclude the possibility that cluster utilization or content is polymorphic between the genotypes used for small RNA sequencing (wK and w1118) and the sequenced genotype used to estimate representation in piRNA clusters (y1; cn1 bw1 sp1), and that this polymorphism reduces the robustness of the relationship between cluster abundance and TE-derived piRNA abundance.
TE Transcript Level and Ping-Pong Amplification Predict piRNA Abundance
The germline-specific ping-pong amplification cycle is posited to produce antisense piRNAs from piRNA precursor transcripts and sense piRNAs from both precursor and full-length TE transcripts (reviewed in Senti and Brennecke 2010). piRNA precursors are also processed into mature piRNAs through a ping-pong independent mechanism in both germline and somatic tissues. Therefore, transcriptionally abundant TE families, and TE families that frequently participate in the ping-pong cycle, are expected to be the most highly represented among TE-derived piRNAs. We observe that across TE families, bivariate models that include either TE mRNA transcript abundance or the fraction of TE-derived piRNAs that are produced by the ping-pong cycle (ping pong fraction) explain a significant amount of variation in TE-derived piRNA abundance (fig. 1C and D).
Germline piRNAs are maternally deposited into oocytes, a process that is postulated to feed forward ping-pong-mediated piRNA production in the offspring germline (Blumenstiel and Hartl 2005; Brennecke et al. 2008; Chambeyron et al. 2008; Malone et al. 2009; Rozhkov et al. 2010; Khurana et al. 2011). Interestingly, we find no evidence for a relationship between the degree of maternal deposition and the abundance of sense or antisense piRNAs (fig. 1D). Therefore, although maternal deposition may be critical for robust ping-pong-mediated piRNA production for some TE families, there is no direct relationship between the extent of maternal deposition and piRNA abundance.
Multiple Regression of TE-Derived piRNA Abundance
Our bivariate regression analysis revealed that when considered separately, all examined variables are predictors of sense and antisense piRNA abundance, except for the degree of maternal deposition. To determine the combination of variables that most accurately describes differences in antisense and sense piRNA abundance between TE families, we combined bidirectional stepwise regression with the Akaike Information Criterion (AIC) to select the best-fit multiple regression model. Our best-fit models are highly robust, explaining 75% and 76% of variation between TE families in sense and antisense piRNA abundance, respectively (supplementary table S3, Supplementary Material online). Our model of sense piRNA abundance included the following six independent variables: 1) ping-pong fraction, 2) TE mRNA transcript abundance, 3) cluster insert count, 4) total average insertion length, 5) maternal deposition, and 6) genotype. Our model of antisense piRNA abundance included each of these six variables, as well as an interaction between ping-pong fraction and maternal deposition.
To examine the contribution of each independent variable to the explanatory power of our multiple regression models, we performed Extra sum-of-squares (SS) F tests (fig. 2A). These tests measure the amount of variance in piRNA abundance explained by each independent variable, scaled to the total unexplained variance in piRNA abundance. Within a regression model, larger values of the Extra SS F-statistic indicate independent variables with more explanatory power. By contrast, the effect estimate of each independent variable indicates the slope of the regression line, or the average change in normalized natural logarithm transformed piRNA abundance that occurs with each unit increase in the explanatory variable (fig. 2B). Interestingly, we observe remarkable congruence between the two models in terms of the selected variables and their relative explanatory power, suggesting that the same variables influence both sense and antisense piRNA production.
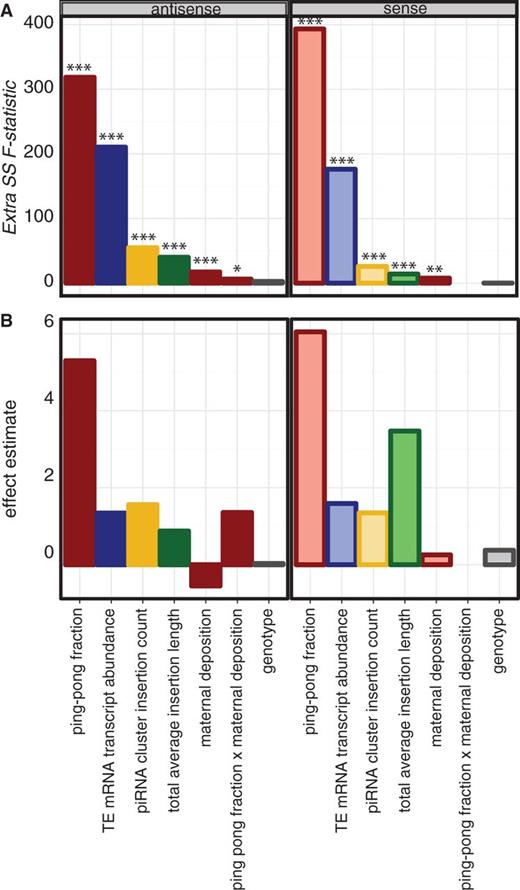
Multiple regression of TE-derived piRNA abundance. (A) Extra SS F-statistics and (B) effect estimates are reported for each variable in the best-fit multiple regression model of antisense (solid bars) and sense (light bars) piRNA abundace. Ping-pong fraction × maternal deposition denotes an interaction between these terms. Bar coloring is as in figure 1. *P < 0.05; **P < 0.01; ***P < 0.001.
For both sense and antisense piRNAs the ping-pong fraction exhibited the largest Extra SS F-statistic, indicating that it explained the most variance in piRNA abundance (fig. 2A). Thus, TE families whose piRNAs are most frequently produced by ping-pong amplification, rather than the ping-pong independent mechanism, are the most abundant among ovarian piRNAs. The second most important variable in both models was the TE mRNA transcript abundance, consistent with the fact that TE transcripts are the source of both sense and antisense piRNAs. Together these two variables provide most of the power in the multiple regression model, accounting for 81% and 92% of explained variation in sense and antisense piRNA abundance, respectively. A model including an interaction between ping-pong fraction and TE mRNA transcript abundance does not provide a significantly better fit to the data than models where each variable is considered separately (antisense Extra SS F1,206 = 3.33, P = 0.15; sense Extra SS F1,207 = 1.84, P = 0.18). Therefore, higher TE transcript abundance predicts more piRNA production, independent of the ping-pong cycle. This finding is consistent with a model where piRNAs are produced from TE transcripts through both ping-pong dependent and independent mechanisms (Brennecke et al. 2008; Li et al. 2009; Haase et al. 2010).
Although genomic abundance estimators were more powerful than piRNA cluster abundance estimators for predicting TE-derived piRNA abundance in bivariate regression models (fig. 1A and B), the number of insertions in piRNA clusters, rather than the total number of genomic insertions, was incorporated in both best-fit multiple-regression models (fig. 2). This observation confirms the unique significance of insertions in piRNA clusters in shaping the piRNA pool. It furthermore implies that the additional variance explained by estimators of genomic abundance in bivariate models is better explained by other factors in the multiple regression model, such as TE mRNA transcript abundance.
Both models incorporated the average genome-wide insertion length of a TE family as an independent variable (fig. 2). This is somewhat unexpected, as element size does not directly reflect the abundance of individual TE families in the D. melanogaster genome. However, our observation is consistent with a recent study that demonstrated that longer TE insertions are proportionally more heavily targeted for piRNA-mediated silencing (after accounting for the differences in insertion length; Lu and Clark 2010). The authors suggest that this finding reflects the higher proportion of active TEs among longer insertions.
Although maternal deposition is not a significant predictor of TE-derived piRNA abundance in bivariate regression models (fig. 1D), it has a weak effect on piRNA production in both sense and antisense best-fit multiple-regression models, explaining ∼1% and ∼2% of variation between TE families, respectively (fig. 2). Interestingly, maternal deposition exhibits an opposite relationship with sense and antisense piRNA abundance: a higher degree of maternal deposition is associated with higher sense piRNA abundance but lower antisense piRNA abundance (fig. 2B). Additionally, a positive interaction exists between ping-pong fraction and maternal deposition for antisense piRNAs only (fig. 2B), indicating that across TE families the relationship between maternal deposition and antisense piRNA abundance depends on the robustness of ping-pong amplification.
To better understand these results we removed maternal deposition and the interaction between maternal deposition and ping-pong fraction from the antisense multiple-regression model. By plotting the residuals of the reduced model against maternal deposition separately for TE families with high ping-pong fractions (≥0.1) and low ping-pong fractions (<0.1; supplementary fig. S1, Supplementary Material online), we discovered that the negative relationship between maternal deposition and antisense piRNA abundance is driven entirely by TE families with low ping-pong fractions (Pearson’s r = −0.51, P = 5.67e−5). In contrast, TE families with high ping-pong fractions show a marginally significant positive relationship between maternal deposition and antisense piRNA abundance, equivalent to the pattern we observe for sense piRNAs (Pearson’s r = 0.15, P = 0.06). These observations are consistent with the posited difference between sense and antisense piRNA production in their relationship to ping-pong cycle. For TE families with high ping-pong fractions (>0.1), maternal deposition moderately enhances both sense and antisense piRNA production by feeding-forward ping-pong amplification. However, piRNAs from TE families with very low ping-pong fractions are overwhelmingly antisense and are produced primarily in ovarian somatic cells (Lau et al. 2009; Li et al. 2009; Malone et al. 2009). These piRNAs are therefore rarely maternally deposited, and thus maternal deposition cannot enhance piRNA production.
Is piRNA Silencing Shaped by Selection against Excessive Transposition?
We demonstrated in the preceding section that variation in TE-derived piRNA abundance between TE families is predominantly explained by differences in TE mRNA transcript abundance and ping-pong-mediated processing of TE families (fig. 2). It has been proposed that ping-pong-mediated amplification of piRNAs from the most abundant TE transcripts represents an adaptive mechanism through which the piRNA pool is targeted toward transpositionally active TE families with the greatest capacity to disrupt gametogenesis and genome integrity (Brennecke et al. 2007). To further explore this idea, we sought to address whether variation in antisense piRNA abundance among TE families is related to differences in the transpositional activity of those TE families. We focus specifically on antisense TE-derived piRNAs for this analysis because these molecules act to directly silence TEs.
Although it is challenging to directly measure the transpositional capacity of a TE family, two approaches are frequently used to infer recent transpositional activity. First, within an individual genome the degree of sequence similarity between insertions of the same TE family is indicative of its age structure. High sequence similarity between insertions suggests that they have occurred in the recent past, whereas low sequence similarity indicates that most insertions are old (Pascale et al. 1993). An alternate approach examines the frequency of individual insertions from the same TE family in population genomic data sets (González et al. 2008; Petrov et al. 2011; Kofler et al. 2012). Because recent insertions are rare, the mean frequency of insertions from active TE families is expected to be low. Conversely, TE insertions from inactivated families will have been segregating in the population for comparatively longer, and may be at higher frequency or fixed. These differences in insertion frequency may be further enhanced by natural selection against active or abundant TE families, which lowers their mean frequencies in natural populations (Lu and Clark 2010; Petrov et al. 2011; Kofler et al. 2012).
We estimated the mean frequency of individual insertions in Portuguese populations of D. melanogaster for 117 TE families characterized by Kofler et al. (2012) (supplementary table S4, Supplementary Material online). For 79 of these TE families, we were also able to estimate the mean pairwise identity between insertions in the sequenced D. melanogaster genome (supplementary table S4, Supplementary Material online). Although these are dramatically different estimators of the age structure of TE families in the D. melanogaster genome, we observe as expected a strong negative correlation between mean frequency and mean pairwise identity (fig. 3A; Spearman’s ρ = −0.63, P = 6.97e−10), confirming that the high sequence similarity that arises from many recent insertions is correlated with a high frequency of insertions that are rare in natural populations.
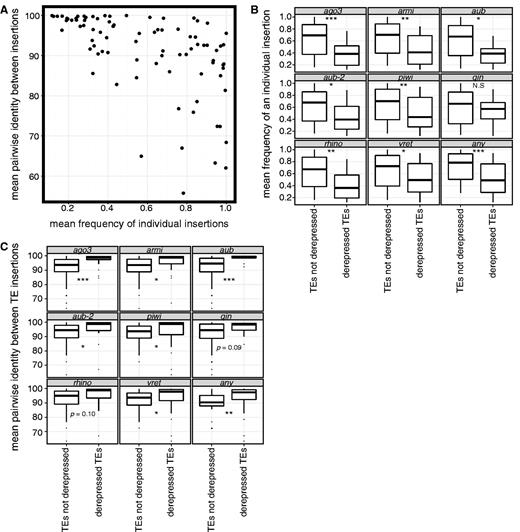
Recently active TE families in the Drosophila melanogaster genome are more sensitive to disrupted piRNA silencing. (A) The mean frequency of individual insertions of TE families in Portuguese populations of D. melanogaster (Kofler et al. 2012) is compared with the mean pairwise identity between insertions of those TE families in the sequenced D. melanogaster genome (Celniker et al. 2002; Hoskins et al. 2007). B and C) TE families that are derepressed in piRNA pathway mutants (Klattenhoff et al. 2009; Li et al. 2009; Zamparini et al. 2011; Zhang et al. 2011) exhibit a lower mean frequency of individual insertions (B) and a higher mean pairwise identity between insertions (C). aub and aub-2 denote independent measurements of TE derepression in aubergine mutants. For the box-plots in (B) and (C), the center line denotes the median, the box denotes the interquartile range (IQR, the 25th–75th percentile of the data), the whiskers denote the most extreme data values within 1.5*IQR of the upper and lower bounds of the IQR, and dots denote outliers above and below 1.5*IQR of the upper and lower bounds of the IQR. *P < 0.05; **P < 0.01; ***P < 0.001. Marginally significant P values, P ≤ 0.1 are given. N.S. denotes P > 0.1.
Recently Active TE Families Are More Sensitive to Genetic Disruption in piRNA Silencing
piRNA pathway mutants in D. melanogaster are characterized by dramatic derepression of multiple TE families (Klattenhoff et al. 2009; Li et al. 2009; Zamparini et al. 2011; Zhang et al. 2011). The adaptive model of piRNA-mediated TE defense predicts that more transpositionally active TEs will be more strongly silenced by the piRNA system. We therefore compared the mean population frequency and mean pairwise identity of TE families derepressed and not derepressed in seven piRNA-pathway mutants: ago3, aub, armi, piwi, kumo/qin, rhino, and vret (Klattenhoff et al. 2009; Li et al. 2009; Zamparini et al. 2011; Zhang et al. 2011). All seven mutant backgrounds are characterized by disrupted piRNA-mediated silencing in the female germline, and the piwi and vret backgrounds further suffer disrupted silencing in the surrounding somatic cells (Malone et al. 2009; Zamparini et al. 2011).
For all mutant backgrounds, the mean population frequency of derepressed TE families is lower than for those that are not derepressed, and with the exception of qin, these differences are significant (fig. 3B). This observation extends our recent finding that TE families that are depressed in four piRNA pathway mutants exhibit a higher proportion of insertions that are very rare in North American populations of D. melanogaster (Kelleher et al. 2012). Similarly, for all mutant backgrounds, the average pairwise identity is higher for TE families that are derepressed than for those that are not, and all differences are significant except for rhino and qin (fig. 3C). Collectively, these analyses strongly suggest that piRNA-mediated silencing is particularly robust for active and recently active TE families.
TE Families with Strong Signatures of Recent Transposition Are Not Exceptionally Abundant among Ovarian piRNAs
It is often suggested that the piRNA pathway responds to selection against transposition by modulating the composition of the piRNA pool. If so, a clear prediction is that the abundance of TE-derived piRNAs for individual families should correlate with the recent transposition rate. Specifically, antisense TE-derived piRNA abundance should correlate negatively with the mean frequency of individual insertions, and positively with the mean pairwise identity between insertions. We confirm both of these predictions. For ovarian piRNAs from both wK and w1118, higher TE-derived piRNA abundance is associated with a lower mean frequency of individual insertions (fig. 4A; wK: Spearman’s ρ = −0.49, P = 3.08e−07; w1118: Spearman’s ρ = −0.59, P = 5.98e−11). Similarly, TE-derived piRNA abundance is positively correlated with mean pairwise identity for both genotypes (fig. 4B; wK: Spearman’s ρ = 0.23, P = 0.04; w1118: Spearman’s ρ = 0.23, P = 0.04). Collectively, these observations suggest that TE families that have been more recently active are more abundant among D. melanogaster piRNAs.
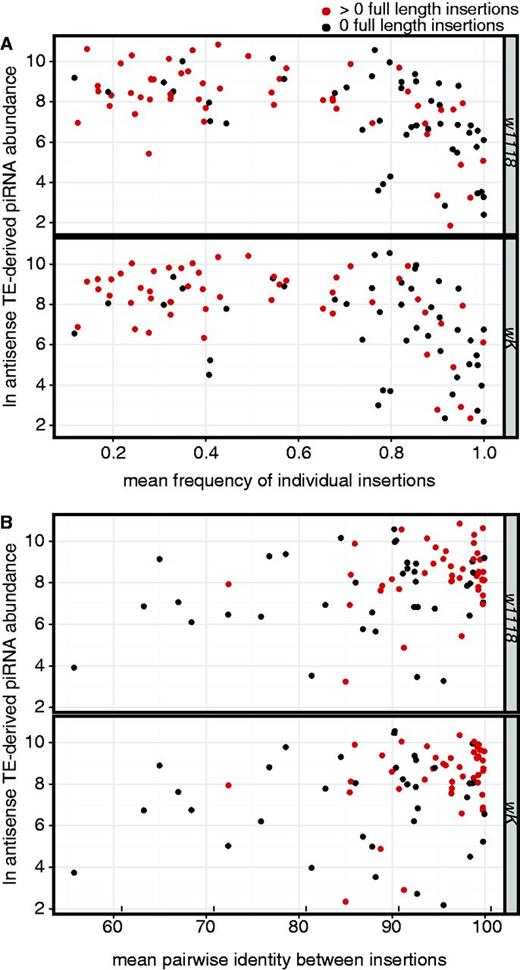
piRNA production is positively correlated with indicators of recent transposition rate. The natural logarithm transformed, normalized antisense TE-derived piRNA abundance for individual TE families is plotted as a function of (A) the mean frequency of insertions from those families in Portuguese populations of D. melanogaster (Kofler et al. 2012), and (B) the mean pairwise identity between insertions from those families in the sequenced D. melanogaster genome (Celniker et al. 2002; Hoskins et al. 2007). Red indicates TE families represented by at least 1 full-length insertion in the sequenced D. melanogaster genome, based on the Repbase consensus sequence (Jurka et al. 2005).
Visual inspection of the relationship between mean frequency and TE-derived piRNA abundance, however, reveals that these correlations only hold for less recently active TE families whose mean frequencies are greater than 0.7 (wK: Spearman’s ρ = −0.55, P = 1.22e−5; w1118: Spearman’s ρ = −0.50, P = 1.06e−4). For more recently active TE families whose mean frequencies are less than 0.7, there is no relationship between mean frequency and TE-derived piRNA abundance (wK: Spearman’s ρ = 0.06, P = 0.68; w1118: Spearman’s ρ = −0.10, P = 0.49). These results suggest that the negative relationship between mean frequency of TE insertions and TE-derived piRNA abundance is driven predominantly by the loss of inactivated TE families from the ovarian piRNA pool, rather than the exceptional piRNA abundance of those TE families that are most transpositionally active.
A simple indicator for the transpositional capacity of a TE family is the presence of a full-length copy in the genome (Sánchez-Gracia et al. 2005; Bartolomé et al. 2009). Based on the length of the repbase consensus sequence (Jurka et al. 2005), we partitioned TE families in the D. melanogaster genome into putatively active TE families that are represented by at least one full-length copy, and putatively inactive TE families that are represented by only partial copies (fig. 4A). We observe that TE families with a mean frequency more than 0.7 are significantly more likely to be putatively inactive than TE families with a mean frequency less than 0.7 (χ2 = 45.415, P = 0), indicating an enrichment of inactive TE families among those that drive the negative correlation between mean frequency and piRNA abundance. Furthermore, putatively inactive TE families are characterized by a dramatically more robust negative correlation between mean frequency and piRNA abundance (w1118: Spearman’s ρ = −0.60, P = 8.67e−6; wK: Spearman’s ρ = −0.42, P = 0.0038) than putatively active TE families (w1118: Spearman’s ρ = −0.44, P = 0.0011; wK: Spearman’s ρ = −0.33, P = 0.019). Collectively, these observations support the interpretation that the relationship between recent transpositional activity and piRNA production is predominantly driven by the loss of inactivated TE families from the piRNA pool.
The positive relationship between mean pairwise identity and antisense piRNA abundance similarly appears to be driven by predominantly older TE families that are not represented by a full-length insertion in the sequenced D. melanogaster genome (fig. 4B). Notably, the mean pairwise identify of a TE family appears to be a much weaker predictor of antisense piRNA abundance than the mean frequency. This likely reflects the exclusion of many older, inactivated TE families from the analysis because a mean pairwise identity could not be calculated (see Materials and Methods).
Loss of Inactivated TE Families from the piRNA Pool Is Not Explained by Reduced Transcription and Ping-Pong Ampilfication
Inactive TE families are predicted to be lost gradually from the ovarian mRNA pool as deletion, selection, and drift reduce their representation in the host genome (Petrov 2002; González and Petrov 2012), and as remaining insertions accumulate mutations that impact their expression. Because TE-derived mRNA transcripts are thought to feed forward piRNA production through the ping-pong cycle (reviewed in Senti and Brennecke 2010), and mRNA and piRNA transcript abundances are positively correlated across TE families (figs. 1C and 2B), reduced transcription of inactive TE families could explain their loss from the ovarian piRNA pool. Indeed, the mean frequency of a TE family is negatively correlated with its mRNA transcript abundance (w1118: Spearman’s ρ = −0.49, P = 3.49e−7; wK: Spearman’s ρ = −0.39, P = 5.55e−5), suggesting that more recently active TE families are more transcriptionally active. However, multiple regression reveals that even after accounting for differences in mRNA transcript abundance between TE families, the mean frequency of a TE family remains a strong predictor of antisense piRNA abundance (Extra SS F1,196 = 207.57, P < 2.2e−16; Model 1; supplementary table S5, Supplementary Material online). Therefore, differences in transcription alone cannot explain the relationship between the recent transpositional activity of TE families and their piRNA abundance.
A second aspect of piRNA production that could explain the loss of inactivated TE families from the piRNA pool is the ping-pong amplification cycle. Mismatch between a small RNA and its target transcript is known to impact the robustness of gene silencing through the miRNA and siRNA pathways (Jacque et al. 2002; Wilson and Richardson 2005; Huang et al. 2009). If this phenomenon extends to the piRNA pathway, it is predicted that the greater sequence divergence among insertions of inactive TE families (Pascale et al. 1993; fig. 3A) will lead to less efficient ping-pong amplification, and ultimately less piRNA production. Interestingly however, the robustness of ping-pong amplification, as indicated by the ping-pong fraction, is independent of the sequence identity between individual insertions of the same TE family (w1118: Spearman’s ρ = 0.087, P = 0.44; wK: Spearman’s ρ = 0.21, P = 0.06). Additionally, multiple regression analysis indicates that the mean frequency of a TE family remains a negative predictor of piRNA abundance even after accounting for differences in mRNA transcript abundance and ping-pong amplification between TE families (Extra SS F1,196 = 143.44, P < 2.2e−16; Model 2; supplementary table S5, Supplementary Material online).
Collectively, our analyses suggest that the loss of inactivated TE families from the piRNA pool cannot be predominantly attributed to reduced efficiency in piRNA biogenesis. Rather, the absence of purifying selection on piRNA-mediated silencing of transpositionally inactive TE families likely has allowed for the accumulation of mutations that reduce piRNA targeting of these TE families.
Lack of Evidence that TE-Derived piRNA Abundance is Shaped by Selection against Ectopic Recombination
Recent studies have suggested that selection to avoid ectopic recombination is the major force shaping the frequency of individual TE insertions in the D. melanogaster genome (Petrov et al. 2011; Kofler et al. 2012). piRNA pathway function is associated with the deposition of repressive histone modifications and heterochromatin formation at TE loci (Haynes et al. 2006; Klenov et al. 2007, 2011; Wang and Elgin 2011). Because heterochromatin formation is associated with a reduced recombination rate (Ellermeier et al. 2010), enhanced transcriptional silencing of TEs could reduce the risk of ectopic recombination. Indeed, while the impact of piRNA pathway function on the meiotic recombination rate in Drosophila remains unclear (Cross and Simmons 2008), in somatic cells, loss of function mutations in genes required for heterochromatin formation and RNA silencing machinery cause the formation of extrachromosomal circular DNA that likely results from ectopic recombination (Peng and Karpen 2007).
TE families that are represented by many full-length copies in regions of high recombination are thought to experience the strongest selection against ectopic exchange (Petrov et al. 2003, 2011). Therefore, if piRNA-mediated silencing acts to reduce the risk of ectopic recombination between insertions of the same TE family, a simple prediction is that piRNA abundance will be closely correlated with the abundance of TE families in regions of high recombination. There are no genome-wide estimates of ectopic recombination rate; however, it is generally assumed that ectopic and meiotic homologous recombination are similar biological processes that are highly correlated (Petrov et al. 2011; Kofler et al. 2012). Additionally, it has been demonstrated in yeast that a hotspot for meiotic homologous recombination is also a hotspot for ectopic recombination (Virgin and Bailey 1998). We therefore used estimates of the meiotic homologous recombination rate at TE loci (Singh et al. 2005; Fiston-Lavier et al. 2010) as a proxy for the ectopic recombination rate. Opposite to our prediction under a model of selection against ectopic recombination, the abundance of TE families in regions of low recombination (<1 cM/Mbp) explained more variation in antisense TE-derived piRNA abundance than the abundance of TE families in regions of high recombination (>1 cM/Mbp; fig. 5).
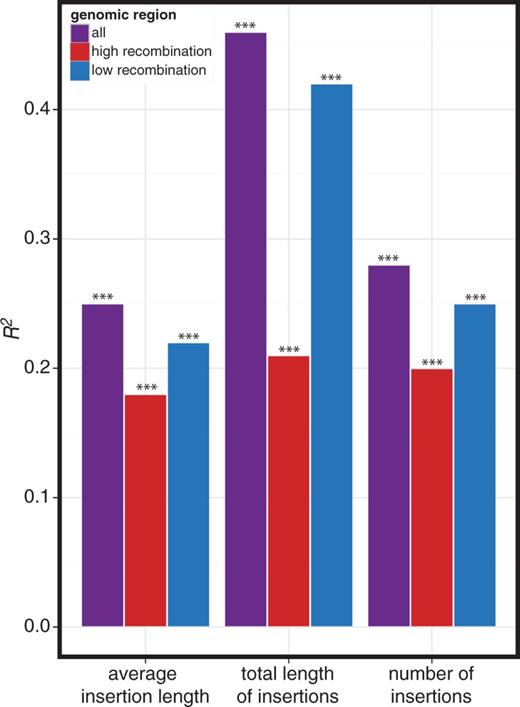
TE family abundance genome-wide is the strongest predictor of TE-derived piRNA abundance. R2 values for bivariate linear models of antisense TE-derived piRNA abundance are reported. Each model includes genotype (wK or w1118), as well as one of three estimates of the genomic abundance of a TE family: the average insertion length, the total length of all insertions, or the total number of insertions. Genomic abundance was considered separately in regions of high recombination (≥1 cM/Mbp, blue), low recombination (<1 cM/Mbp, red) and all genomic regions (purple). *P < 0.05; **P < 0.01; ***P < 0.001.
Because piRNA clusters are predominantly found in regions of low recombination (Brennecke et al. 2007; Yin and Lin 2007), one potential explanation for the stronger relationship between TE-derived piRNA abundance and TE family abundance in regions of low recombination is the unique impact of piRNA clusters on the composition of the piRNA pool (fig. 2). However, the genome-wide abundance of a TE family is consistently a stronger predictor of antisense piRNA abundance than the abundance of that family in regions of either high or low recombination alone (fig. 5). Therefore, the representation of TEs in regions of low recombination is not exceptionally predictive of antisense piRNA abundance. Indeed, the relatively stronger relationship between antisense piRNA abundance and TE family abundance in regions of low recombination likely reflects the fact that TE family abundance in regions of low recombination is more representative of genome-wide abundance patterns (supplementary fig. S2, Supplementary Material online). Furthermore, when we repeated our stepwise regression of antisense piRNA abundance and included abundance estimators in regions of high and low recombination, we arrived at the same best-fit model that does not incorporate information about the recombination rate (fig. 2). Collectively, these findings suggest that the abundance of TE families within the piRNA pool is not shaped by selection against ectopic recombination.
Discussion
Our study provides robust support for the major predictions of the current model of piRNA biogenesis, and further reveals exceptional similarity between factors that contribute to sense and antisense piRNA production. We found that the abundance of TE transcripts and the robustness their processing through the ping-pong amplification cycle explain the majority of observed variation in ovarian piRNA abundance among TE families. We furthermore demonstrate that the representation of TE families in piRNA clusters is positively associated with piRNA abundance, consistent with the hypothesis that piRNA clusters contribute disproportionately to piRNA production. Finally, we reveal that the maternal deposition of piRNAs has a modest positive effect on piRNA production only for those TE families with high ping-pong fractions, consistent with the hypothesis that maternal deposition feeds forward ping-pong amplification.
It frequently is proposed that selection to repress germline transposition is the major evolutionary force shaping the composition of the TE-derived piRNA pool (Brennecke et al. 2007; Malone and Hannon 2009; Castañeda et al. 2011). This hypothesis predicts that piRNA abundance should correlate with the transpositional activity of a TE family, with the most active or recently active TE families being the most abundant among TE-derived piRNAs. Consistent with this model, it was recently demonstrated that the most transpositionally active TE families in the human genome are the most heavily targeted for piRNA-mediated silencing (Lukic and Chen 2011).
However, we did not find this relationship in Drosophila. Although there is a positive correlation between estimators of recent transposition and antisense TE-derived piRNA abundance, the pattern is predominantly driven by the loss of old, putatively inactive TE families from the piRNA pool (fig. 4). The disparity between this pattern and that observed in humans may reflect dramatic differences in abundance of active TE families in each genome. Although TEs comprise a much larger faction of the human genome than the Drosophila genome (45% vs. 5%), human TEs belong to a smaller number of families, most of which are inactive (reviewed in González and Petrov 2012). Therefore, the positive relationship between recent transposition and piRNA abundance may be driven by the loss of inactivated TE families from the piRNA pool in both humans and D. melanogaster, but the larger fraction of active TE families in the D. melanogaster genome reveals a distinct dynamic for more recently active TEs.
The lack of a relationship between piRNA abundance and transpositional activity for recently active TE families suggests that many TEs in the D. melanogaster genome may not be optimally silenced (fig. 4). This interpretation is consistent with a recent demonstration that individual TE insertions in the D. melanogaster euchromatic genome with fewer corresponding regulatory piRNAs are subject to stronger negative selection in natural populations, implying that optimal targeting of these elements has not yet been achieved (Lu and Clark 2010). A lack of optimal silencing also is consistent with population genetic theory, which suggests a limited selective advantage to host repression of transposition of individual TE families (Charlesworth and Langley 1986). This is because the selective advantage of a host repressor allele decreases with decreasing transposition rate (Charlesworth and Langley 1986). piRNA-mediated silencing is therefore most likely to evolve against unregulated TE families that are exceptionally transpositionally active (Blumenstiel 2011). After the onset of piRNA-mediated silencing, transposition rates are expected to decrease dramatically, thereby decreasing the strength of selection on host silencing and making unlikely the fixation of alleles that refine host repression. Indeed, estimated transposition rates for active TE families that are targeted for silencing by the piRNA pathway suggest that the selective advantage of additional silencing is vanishingly small (s ≅ 10−6–10−7; Nuzhdin 1999).
Intriguingly, these same models suggest that stronger selection could allow for the fixation of general repressor alleles that reduce the transposition rates of multiple TE families (s ≅ 10−5; Lee and Langley 2012). Although the sequence specificity of piRNAs makes them unlikely to act as general repressors, the effector proteins that mediate piRNA biogenesis and TE silencing could adapt to enhance silencing across multiple TE families. Consistent with this hypothesis, many protein components of the piRNA pathway show signatures of adaptive evolution (Begun et al. 2007; Larracuente et al. 2008; Obbard et al. 2009; Kolaczkowski et al. 2011; Lee and Langley 2012; Mackay et al. 2012). Therefore, we propose that the limits we observe in the adaptation of the piRNA pool to active TE families may engender other types of host genome defense, including adaptive evolution in piRNA effector proteins.
A nonmutually exclusive hypothesis about the adaptive significance of the Drosophila piRNA pathway is that piRNA-mediated heterochromatin formation at TE loci could be subject to selection against ectopic recombination (Lu and Clark 2010; Blumenstiel 2011). In the D. melanogaster genome, there is strong evidence that the most deleterious TE insertions are those with the highest risk of ectopic recombination, namely, insertions from abundant TE families in euchromatic regions of high recombination (Petrov et al. 2011; Kofler et al. 2012). This suggests that there is strong selection to reduce the risk of deleterious ectopic recombination events at euchromatic TE loci. However, we found that piRNA abundance is not preferentially associated with the abundance of TE families in regions of high recombination (fig. 5).
One explanation for this result may be that piRNA-mediated transcriptional silencing is rare in euchromatic regions of high recombination, and therefore cannot act to suppress these events. Somatic small-RNA dependent transcriptional silencing of the DNA transposon 1360 occurs at only a subset of euchromatic insertions in the D. melanogaster genome (Sun et al. 2004; Haynes et al. 2006; Sentmanat and Elgin 2012), indicating that this silencing mechanism may not be a general phenomenon in euchromatin. Although the degree to which these results extend to germline silencing remains unknown, somatic silencing of 1360 is dependent on the piRNA pathway components piwi, aub, and spnE (Haynes et al. 2006). Additionally, there is no evidence that negative selection against euchromatic TE insertions is dependent on the proximity to genes (Petrov et al. 2011; Kofler et al. 2012), as one might expect if gene expression was disrupted by heterochromatin spreading from adjacent TE loci (Hollister and Gaut 2009).
Many fundamental questions about the relationship between piRNAs and the TEs they regulate remain unanswered. Although TE-derived piRNAs are clearly necessary for TE regulation (Blumenstiel and Hartl 2005; Brennecke et al. 2008; Chambeyron et al. 2008; Rozhkov et al. 2010; Khurana et al. 2011; Grentzinger et al. 2012), the quantitative relationship between piRNA production and the robustness of TE silencing remains unclear. Furthermore, the relationship between piRNA production and TE silencing likely depends on the mechanism of silencing, be it transcriptional, posttranscriptional, or both, which likely differs among TE families (Malone et al. 2009; Klenov et al. 2011).
Materials and Methods
TE Family Genomic Abundance
TE annotations for the sequenced euchromatic and heterochromatic D. melanogaster genome (Celniker et al. 2002; Hoskins et al. 2007) were downloaded from flybase (Release 5.45; Marygold et al. 2013). For each TE family, mapping coordinates were used to generate three different estimators of abundance, the total number of insertions, total length of all insertions, and the average length of an individual insertions. The Drosophila genome contains a number of “nested” TE insertions where one TE has transposed into a second TE insertion (Quesneville et al. 2005; Bergman et al. 2006). For these complex insertions, we inferred the ancestral insertion length of the outer TE by subtracting the annotated length of the inner insertion from the annotated length of the outer insertion.
Estimators of TE family abundance were calculated separately for the whole genome and for piRNA clusters only (Brennecke et al. 2007). We also estimated TE family abundance separately for regions of high or low recombination only. To identify regions of high and low recombination, we estimated the local recombination rate for all TE insertions in the sequenced D. melanogaster genome using the Drosophila recombination rate calculator (Singh et al. 2005; Fiston-Lavier et al. 2010). This tool employs the Marey map approach (Chakravarti 1991) to estimate recombination rate across the genome by comparing the genetic and physical maps. TE insertions in regions with a recombination rate ≥1 cM/Mbp were classified as high recombination insertions, whereas those in regions less than 1 cM/Mbp were considered low recombination insertions. All TEs in sequenced heterochromatin (Hoskins et al. 2007) were considered low recombination insertions.
TE mRNA and TE-Derived piRNA Transcript Abundance
Barcodes and cloning adaptors were removed from wK and w1118 ovarian mRNA sequencing libraries and ovarian and embryonic small RNA sequencing libraries from (Brennecke et al. 2008; Kelleher et al. 2012) using a custom Perl script. For small RNA libraries, reads 23 nt or longer (after cloning adaptor removal) were classified as putative piRNAs, as in Brennecke et al. (2008). Small RNA reads lacking identifiable 3′ adaptor sequences were discarded, as their read lengths could not be accurately inferred.
TE-derived transcripts were identified by mapping sequenced small RNAs and mRNAs to all annotated TE insertions in the D. melanogaster genome (Release 5.45) using Bowtie (Langmead et al. 2009). Only perfectly aligned reads were considered (0 mm). To avoid unnecessary ambiguous mapping to multiple TE families, only the innermost TE in a TE nest was included in this analysis. All reads mapping insertions to the same TE family were pooled, and reads mapping to more than one TE family were discarded. To account for differences in sequencing depth between libraries, TE-derived piRNA abundance was normalized by calculating the number of reads from each TE family per 1 million TE-derived piRNA reads in the sequencing library.
Ping-Pong Signature and Maternal Deposition
The ping-pong signature, or the probability that a randomly sampled piRNA from a given TE family will have an antisense binding partner sharing a 10 bp overlap, was calculated by a custom Perl script using the method described in Brennecke et al. (2008). Briefly, all piRNAs are first mapped to their repbase consensus (Jurka et al. 2005) using Bowtie, allowing for up to three mismatches. For each piRNA, the proportion of overlapping antisense binding partners whose 5′ end lies on the 10th nucleotide is then determined. This value is subsequently summed across all piRNAs sampled for a given TE class, while incorporating the difference in sampling frequency between individual piRNAs. Finally, this sum is divided by the total number of piRNAs mapping to the TE class of interest.
Drosophila ovarian piRNAs include a mixture of germline piRNAs that are maternally deposited into mature oocytes, and somatic piRNAs that are lost when follicle cells slough off during oviposition (Nezis et al. 2002). Maternal deposition of an individual TE family can therefore be estimated by comparing the abundance of that TE family between ovarian piRNAs and early embryonic piRNAs isolated before the onset of zygotic transcription (Blumenstiel and Hartl 2005; Brennecke et al. 2008; Malone et al. 2009). Ovarian and early embryonic Illumina small RNA libraries were generated for both the w1118 and wK genotypes by Brennecke et al. (2008). Our measurement of maternal deposition was the relative abundance of individual TE families among embryonic piRNAs, when compared with ovarian piRNAs, as calculated for each strain using DEseq (Anders and Huber 2010).
Mean Frequency and Mean Pairwise Identity
We used the frequencies of 10,208 individual TE insertions in Portuguese populations of D. melanogaster estimated in Kofler et al. (2012), to calculate a mean frequency for 117 different TE families. To calculate mean pairwise identity, we first aligned all annotated insertions from the same TE family (≥500 bp) in the sequenced D. melanogaster euchromatic and heterochromatic genome (Celniker et al. 2002; Hoskins et al. 2007) using muscle (Edgar 2004). The quality of all alignments was verified by visual inspection, and in some cases highly divergent sequences were removed. Alignments with many highly divergent sequences could not be confidently aligned and were not further analyzed. Mean pairwise identity between aligned TE insertions was calculated using the “percentage_identity” function of the bioperl Align::IO module. The mean frequency and mean pairwise identity for each TE family is reported in supplementary table S4, Supplementary Material online.
Data Transformation and Linear Modeling
A summary of all data sets analyzed in this study is presented in table 1. The full data set of sense and antisense piRNAs, as well as the examined predictors of piRNA abundance for each TE family, can be found in supplementary table S2, Supplementary Material online. To identify the appropriate transformation for predictors of piRNA abundance, we first visually inspected a scatterplot relating sense and antisense piRNA abundance to each variable. We then explored potential transformations for each variable by generating bivariate regression models in which sense or antisense piRNA abundance was expressed as a function of the transformed variable of interest, and the genotype (wK or w1118). We used the AIC to select the transformation that maximized the power of the bivariation regression model to predict differences between TE families in sense or antisense piRNA abundance (supplementary table S1, Supplementary Material online). After identifying the appropriate transformation for all variables, we combined bidirectional stepwise regression with the AIC to identify the multiple regression model that best explained variation in sense and antisense TE-derived piRNA abundance between TE families.
Data Sets Analyzed in This Study.
| Variable | Variable Type | Data Type | Genotype | Source |
|---|---|---|---|---|
| TE-derived piRNA abundance | Dependent variable | Small RNA-seq | wK and w1118 | Brennecke et al. (2008) |
| Ping-pong fraction | piRNA production | Small RNA-seq | wK and w1118 | Brennecke et al. (2008) |
| Maternal deposition | piRNA production | Small RNA-seq | wK and w1118 | Brennecke et al. (2008) |
| TE mRNA transcript abundance | TE transcription | mRNA-seq | wK and w1118 | Kelleher et al. (2012) |
| Average insertion length | Genome-wide abundance | TE annotation | y1; cn1 bw1 sp1 | flybase.org; Marygold et al. (2013) |
| Total length of insertions | Genome-wide abundance | TE annotation | y1; cn1 bw1 sp1 | flybase.org; Marygold et al. (2013) |
| Number of insertions | Genome-wide abundance | TE annotation | y1; cn1 bw1 sp1 | flybase.org; Marygold et al. (2013) |
| Average length of piRNA cluster insertions | piRNA cluster abundance | TE annotation | y1; cn1 bw1 sp1 | flybase.org; Marygold et al. (2013) |
| Total length of piRNA cluster insertions | piRNA cluster abundance | TE annotation | y1; cn1 bw1 sp1 | flybase.org; Marygold et al. (2013) |
| Number of piRNA cluster insertions | piRNA cluster abundance | TE annotation | y1; cn1 bw1 sp1 | flybase.org; Marygold et al. (2013) |
| Mean pairwise identity | TE age-structure | TE annotation | y1; cn1 bw1 sp1 | flybase.org; Marygold et al. (2013) |
| Mean frequency of individual TE insertions | TE age-structure | Pooled population genomic sequencing | Natural isolates | Kofler et al. (2012) |
| TE derepression in piRNA effector protein mutants | TE-derepression | Microarray | ago3, aub | Li et al. (2009) |
| armi, rhino | Klattenhoff et al. (2009) | |||
| aub-2, piwi, vret | Zamparini et al. (2011) | |||
| qin | Zhang et al. (2011) |
Note.—The names and types of variables analyzed, source data type, genotype of samples, and associated publications are indicated. flybase.org was last accessed on May 16, 2013.
Acknowledgments
The authors thank Richard Meisel, Justin Blumenstiel, the members of the Barbash Lab, and an anonymous reviewer and editor for helpful discussion and comments on this manuscript. They also thank Phillip Zamore and William Theurkauf for sharing analyses of published microarray data. This work was supported by the Cornell Center for Comparative and Population Genomics and NIH-NRSA F32 GM090567-02 to E.S.K. and National Institute of Health grant 2R01GM074737 to D.A.B.
References
Author notes
Associate editor: Naoko Takezaki
