


Abstract
Gene duplication is widely regarded as a major mechanism modeling genome evolution and function. However, the mechanisms that drive the evolution of the two, initially redundant, gene copies are still ill defined. Many gene duplicates experience evolutionary rate acceleration, but the relative contribution of positive selection and random drift to the retention and subsequent evolution of gene duplicates, and for how long the molecular clock may be distorted by these processes, remains unclear. Focusing on rodent genes that duplicated before and after the mouse and rat split, we find significantly increased sequence divergence after duplication in only one of the copies, which in nearly all cases corresponds to the novel daughter copy, independent of the mechanism of duplication. We observe that the evolutionary rate of the accelerated copy, measured as the ratio of nonsynonymous to synonymous substitutions, is on average 5-fold higher in the period spanning 4–12 My after the duplication than it was before the duplication. This increase can be explained, at least in part, by the action of positive selection according to the results of the maximum likelihood-based branch-site test. Subsequently, the rate decelerates until purifying selection completely returns to preduplication levels. Reversion to the original rates has already been accomplished 40.5 My after the duplication event, corresponding to a genetic distance of about 0.28 synonymous substitutions per site. Differences in tissue gene expression patterns parallel those of substitution rates, reinforcing the role of neofunctionalization in explaining the evolution of young gene duplicates.
Introduction
Gene duplication is one of the major mechanisms contributing to genome complexity, as well as to the generation of new gene functions (Ohno 1970; Zhang et al. 2003). For instance, in the human genome, between 15% and 38% of genes may have arisen through gene duplication (Lynch and Conery 2000; Zhang et al. 2003). Unequal crossing-over during meiosis is the main contributor for tandem or closely located gene duplicates, giving rise to a situation where the structure of the progenitor (parent) and novel duplicated (daughter) gene is expected to be initially equal, unless the gene was disrupted during the process of duplication itself. On the contrary, genes formed by retrotransposition (retrogenes) will have a different structure from their parent copy, because retrotransposition involves the random insertion of a retrotranscribed cDNA. The structure of the daughter retrogene is characterized by a single exon, the presence of a polyA tail, and a lack of regulatory regions (Hahn 2009). Segmental duplications and whole-genome duplications (WGDs) are other sources of gene duplicates, in which multiple genes and their flanking regulatory regions are duplicated simultaneously (Dehal and Boore 2005; Sharp et al. 2005).
Under the neutral theory of molecular evolution (Kimura 1983), when the appearance of a new duplicate is not directly advantageous (e.g., through increased gene-dosage advantage), the likelihood of the duplicate becoming fixed is low and can be estimated as 1/2N in diploid organisms, where N is the effective population size. Two genes with identical functions are unlikely to be maintained in the genome unless the generation of extra gene product is beneficial (Zhang et al. 2003). Thus, most duplicates are expected to be lost to pseudogenization rather than becoming fixed (Lynch and Conery 2000). Retrogenes are strong candidates to be pseudogenized, because they are expected to be distantly located from the promoter region of the parent copy. However, it has been observed that duplicates formed through this mechanism can be expressed (Marques et al. 2005; Zemojtel et al. 2010).
Several mechanisms have been proposed to explain the maintenance of gene duplicates in the genome (reviewed in Hahn [2009] and Innan and Kondrashov [2010]), which can be broadly summarized into three main models: neofunctionalization, subfunctionalization, and increased gene-dosage advantage. In the neofunctionalization model, one copy is maintained by purifying selection and retains the original function, whereas the redundant copy is free to evolve and potentially acquire new gene functions (Ohno 1970; Walsh 1995; Force et al. 1999). Following gene duplication, the evolutionary rate is expected to be accelerated in the copy freed from purifying selection, resulting in asymmetry between the two copies. If mutations lead to adaptive functional changes then the new copy is expected to evolve by positive selection. In the subfunctionalization model (complementation–degeneration model), both duplicates accumulate mutations through genetic drift, and consequently, their evolutionary rates increase symmetrically relative to the original copy, and the ancestral function(s) may be split between duplicates (Force et al. 1999; Lynch and Force 2000). Subsequently, purifying selection is expected to maintain the two functionally distinct copies. A related model is that of escape from adaptive conflict, in which a protein with multiple functions can optimize each function independently after gene duplication, following release from antagonistic pleiotropy (Hughes 1994; Des Marais and Rausher 2008). Under the increased gene-dosage advantage model, gene duplication is itself beneficial due to the increased amount of gene product, and thus, both duplicates are expected to become rapidly fixed (Konrad et al. 2011). In this case, the evolutionary rate should be symmetrical between duplicates but not significantly different to that of the ancestral copy.
Discrimination between these three models can theoretically be achieved by the comparison of the evolutionary pace of duplicates and the ancestral copy. Several studies have attempted to quantify the fraction of duplicated gene pairs that evolve asymmetrically. Conant and Wagner (2003) reported that this figure is about 21–30% of the duplicated gene pairs from Saccharomyces cerevisiae, Schizosaccharomyces pombe, D. melanogaster, and Caenorhabditis elegans. Similarly, an analysis of recently duplicated human genes has shown that about one-fifth of pairs evolve asymmetrically (Panchin et al. 2010). In addition, the percentage of mammalian young gene duplicates affected by positive selected has been estimated to be about 10% (Hahn 2009). Both Cusack and Wolfe (2007) and Jun et al. (2009) reported that tandem duplicates tend to evolve symmetrically, whereas distant duplicates, including retrogenes, tend to evolve asymmetrically. However, a study of the angiogenin gene family in mouse found evidence of neutral, purifying, and positive selection in different branches of this family of six tandemly duplicated genes (Codoñer et al. 2010). Although these studies support neofunctionalization for a fraction of the gene families, a global overview is still missing.
Another way to examine the evolution of duplicated gene pairs is through functional studies. So far, most studies have focused on the comparison of gene expression patterns. These studies support the idea that duplication leads to rapid acquisition of divergent tissue-expression patterns (Huminiecki and Wolfe 2004; Farré and Albà 2010; Huerta-Cepas et al. 2011). The main source of expression data to date has been microarray-based analyses, despite the fact that cross-hybridization takes place at a high rate in such experiments (Blanc and Wolfe 2004) and is likely to be particularly problematic in the case of duplicates. RNAseq technology appears to be more appropriate for studying expression in duplicates because it negates the cross-hybridization problem. However, there is currently a paucity of data for most species, and where data are available, it is only for a limited number of tissues and time points, which may lead to underdetection of differences in gene expression between duplicates.
The aim of this study is to investigate the evolutionary pace of recently duplicated genes, tracking their nonsynonymous to synonymous substitution rate ratio (dN/dS) during different time intervals, and to evaluate functional consequences through the analysis of patterns of positive selection and gene expression. Estimation of evolutionary rate in young duplicates can be a difficult task, due to the short period of time available for changes to accumulate. In addition, when few changes have accumulated, it may not be possible to detect significant differences in the speed of evolution between the two copies. Thus, we focus on rodent duplicates, as the molecular evolutionary rate in this order is two to three times higher than the rate in other mammalian orders such as primates (Waterston et al. 2002; Toll-Riera et al. 2011). We examine the behavior of evolutionary rate focusing on three different situations: comparing dN/dS before and after gene duplication, within different time intervals, and between duplicated gene pairs. By combining data from 404 duplicated gene copies generated at different times during rodent evolution, we conclude that evolutionary rate is not constant through time, with younger duplicates having higher rates. Asymmetry is a general trend following duplication, and the novel daughter copy generally evolves more rapidly both in terms of substitution rate and in the incorporation of short indel events. We observe that rate acceleration is limited to a relatively short period of time following the duplication event, and its effect is erased completely approximately 40.5 My later. Positive selection appears to be prevalent after the duplication event, acting mainly on the accelerated copy, and tissue-expression patterns are better conserved between the single-copy human ortholog gene and the slower evolving duplicate than with the faster evolving duplicate.
Results
Initial Characterization of the Duplicated Gene Set
We obtained a comprehensive set of protein families formed by genes undergoing a single duplication event in Mus musculus (mouse), Rattus norvegicus (rat), or their common ancestor, using paralogy annotations from Ensembl Compara (Vilella et al. 2009). The trees were further validated using maximum likelihood (ML)-based tree reconstruction (see Materials and Methods). The set was split into two groups, according to whether duplication occurred before or after the speciation event separating mouse and rat. These groups were termed the prespeciation duplication set (Pre-SD) and postspeciation duplication set (Post-SD), respectively (fig. 1). The Pre-SD set comprised 35 families including 140 duplicated gene sequences (fig. 1A), whereas the Post-SD set comprised 117 families including 264 duplicated gene sequences. Post-SD families had a single duplication event (fig. 1B and C) except for a few cases in which the gene had independently duplicated in mouse and rat (fig. 1D).
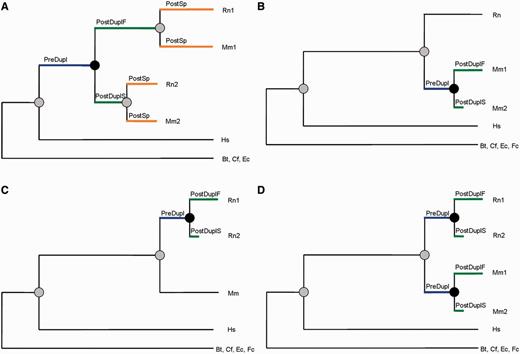
Schematic representation of the gene duplication data sets employed in this study. (A) Prespeciation duplication set (Pre-SD), 35 families. (B) Postspeciation duplication set (Post-SD) with one duplication in mouse, 73 families. (C) Postspeciation duplication set (Post-SD) with one duplication in rat, 29 families. (D) Postspeciation duplication set (Post-SD) with one duplication in mouse and one in rat, 15 families. Black circles indicate a duplication event and grey circles a speciation event. Rn, Rattus norvegicus; Mm, Mus musculus; Hs, Homo sapiens; Bt, Bos taurus; Cf, Canis familiaris; Ec, Equus caballus; Fc, Felis catus.
We next investigated whether the set of duplicated genes showed any functional biases with respect to the rest of the genes in the genome. Gene Ontology (GO) term enrichment analysis of the 152 families from the Post-SD and Pre-SD sets, using the human ortholog to identify function, revealed an over-representation of olfactory receptor and mitochondrial genes. For the molecular function ontology, we found an enrichment in olfactory receptor activity (GO:0004984) in 10.53% of the genes list (P < 0.05 using a two-tailed Fisher's exact test and adjusting for multiple comparisons). Fifty percent of these genes were also defined as melanocortin receptor activity (GO:0004977). For the biological process ontology, we found an enrichment in several terms related to sensory perception of smell (GO:0007600, GO:0007606, and GO:0007608), in 11.18% of the gene list (P < 0.05 using a two-tailed Fisher's exact test and adjusting for multiple comparisons). The cellular component ontology was enriched in mitochondrial genes (GO:0044429), involving 8.55% of the gene list (P < 0.05 using a two-tailed Fisher's exact test and adjusting for multiple comparisons), 38.5% of which were specifically involved in the respiratory chain (GO:0070469).
Comparison of the distribution of nonsynonymous to synonymous substitution rates (dN/dS) in the branches before and after the duplication event (PreDupl vs. PostDupl, fig. 1) showed a significant tendency toward an increase in evolutionary rate following duplication (P < 0.001 and P < 10−8, for Pre-SD and Post-SD, respectively, Wilcoxon’s test; fig. 2A and B, respectively). This acceleration diminished over time, as we detected a significant decrease in dN/dS in the Pre-SD set by the time the mouse and rat lineages have segregated (P < 0.01, PostDupl vs. PostSp Wilcoxon’s test, fig. 2A).
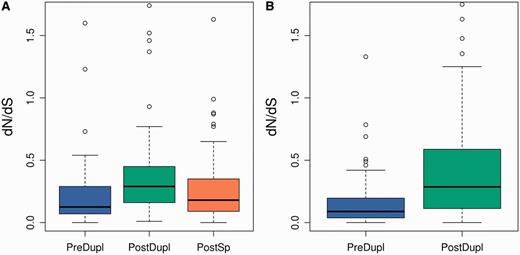
Boxplot representation of dN/dS for the Pre-SD (A) and Post-SD (B) sets. After filtering out branches with dS < 0.01, for the Pre-SD set, we had 34, 62, and 139 pre-, postduplication, and postspeciation branches, respectively, and for the Post-SD set, we had 115 and 128 pre- and postduplication branches, respectively. Differences between the PreDupl and PostDupl branches were significant at P < 0.001 for the Pre-SD set (A) and P < 10−8 for the Post-SD set (Wilcoxon’s test). The difference between the PostDupl and PostSp branches in (A) was also significant at P < 0.01.
Asymmetric Evolution of Gene Duplicates
To investigate whether acceleration in evolutionary rate affects each of the duplicates differently, we estimated the percentage of asymmetry in evolutionary rate between the two copies. As our aim was to compare different branches from the same family, we only used families in which all branches had passed the quality filters for dN and dS estimation (see Materials and Methods). We found that 65.38% and 20.41% of the pairs were evolving at a significantly different rate after the duplication (i.e., asymmetrically, P < 0.05 using a Fisher's exact test and adjusting for multiple comparisons) in the Pre-SD and Post-SD sets, respectively. It should be noted that the low number of absolute changes in individual genes could lead to an underdetection of significant differences within families, especially in the Post-SD set, which is composed of younger duplicates. In fact, when classifying the two rodent duplicates from the Post-SD set into slower and faster evolving, we observed that even in those cases classified as symmetrical, the dN/dS of the faster evolving copy was on average 3-fold higher than that of the slower evolving copy, and the difference in the distribution of dN/dS values between the faster and slower copies pooled together was significant (P < 10−6, Wilcoxon’s test). A similar trend was observed in the Pre-SD set where, even when the pair had been classified as symmetrical, the faster copy was evolving on average 2.5 times more rapidly, though in this case, differences were not significant because the sample size was reduced to just six families.
The aforementioned observations prompted us to consider the faster and slower evolving branches independently. This revealed that dN/dS for the slower evolving branch (PostDuplS) was not significantly different from the dN/dS of the preduplication branch (PreDupl), in both the Pre-SD and Post-SD sets (fig. 3A and B, respectively). In contrast, the faster evolving branch (PostDuplF) was on average 4.7 and 2.5 times accelerated with respect to the preduplication branch, for the Post-SD and Pre-SD sets, respectively (PostDuplF against PostDuplS in figure 3A and B; P < 10−12, Wilcoxon’s test). In the Pre-SD set, the speed of evolution of the faster evolving copy decelerated after speciation, as shown by a significant decrease in dN/dS values in this more recent period when compared with the period immediately after the duplication (fig. 3A, PostDuplF against PostSpF; P < 0.002, Wilcoxon’s test).
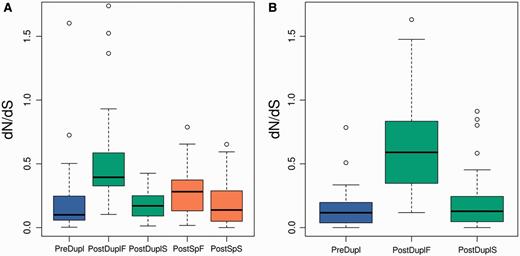
dN/dS for slower and faster duplicated gene copies for the Pre-SD (A) and Post-SD set (B). Differences between the faster postduplication branch (PostDuplF) branch and all other branches were highly significant for both sets (P < 10−10). Differences between the preduplication (PreDupl) and faster postspeciation (PostSpF) or slower postspeciation (PostSpS) branches were not significant (see supplementary data, Supplementary Material online, for all pairwise comparisons).
We investigated whether the duplicate gene acceleration observed in our sets was due primarily to the effect of retrogenes. Analysis of the genomic location of duplicated genes showed that retrogenes tended to be located on a different chromosome from the parent gene, contrary to what is observed for nonretrogene copies. Considering the Pre-SD and Post-SD sets together, 69% of duplicates located on different chromosomes were retrogenes, compared with just 11% of duplicates located on the same chromosome. Most of the duplicates located on the same chromosome were found within 300 kb of each other (83%), in agreement with the predominance of DNA-based tandem duplication. Analysis of dN/dS values for the two types of duplicated gene indicated that acceleration is not exclusive to retrogenes. In the Post-SD set, asymmetry between fast and slow evolving copies remained significant when excluding retrogenes from the comparison (P < 10−6, Wilcoxon’s test) and when considering only duplicates located on the same chromosome (P < 10−5, Wilcoxon’s test). Furthermore, fast evolving copies of the retrogene containing families were not significantly accelerated when compared with the nonretrogene families (P = 0.308, Wilcoxon’s test) nor was there a difference between fast copies for families located on the same chromosome versus those found on different chromosomes (P = 0.770, Wilcoxon’s test).
Deceleration of Evolutionary Rates after the Initial Increase
In an attempt to better define the observed pattern of evolutionary rate deceleration, duplicates of the Pre-SD and Post-SD sets were classified into younger and older by subtracting the value of dS for the preduplication branch from the dS of the postduplication branch (or the mean of both postduplication branches when available). For this analysis, we considered all families having dS > 0.01 in both the preduplication branch and at least one of the two postduplication branches, comprising 33 families for the Pre-SD set and 74 families for the Post-SD set. Positive values, indicating that the postduplication branch is longer than the preduplication branch (dS PostDupl > dS PreDupl, see branches in fig. 1), were classified as older duplicates and negative values as younger duplicates (table 1). Assuming that the primate and rodent lineages split approximately 70 Ma and the mouse and rat lineages approximately 16 Ma (Douzery et al. 2003), the mid point of the rodent ancestral branch is 43 Ma. From this, we can infer that the mean age of the older Pre-SD duplicates is approximately 56.5 Ma and of the younger Pre-SD duplicates approximately 29.5 Ma. Doing similar calculations for the Post-SD duplicated gene set, the mean age of the older Post-SD duplicates is approximately 12 Ma and of the younger Post-SD duplicates approximately 4 Ma (table 1).
dN/dS Values for Preduplication and Postduplication Branches.
| My | ∼70 to 43 | ∼43 to 16 | ∼16 to 8 | ∼8 to Present | ||||||
|---|---|---|---|---|---|---|---|---|---|---|
| Older Pre-SD (16) | Younger Pre-SD (17) | Older Post-SD (19) | Younger Post-SD (55) | |||||||
| PreDupl | PostDupl | PostSp | PreDupl | PostDupl | PostSp | PreDupl | PostDupl | PreDupl | PostDupl | |
| Mean | 0.31 | 0.31 | 0.27 | 0.19 | 0.47 | 0.21 | 0.31 | 0.39 | 0.16 | 0.43 |
| Median | 0.19 | 0.28 | 0.26 | 0.10 | 0.31 | 0.16 | 0.13 | 0.36 | 0.09 | 0.30 |
| Standard deviation | 0.39 | 0.31 | 0.15 | 0.30 | 0.35 | 0.15 | 0.67 | 0.23 | 0.16 | 0.38 |
Note.—Estimated million years are shown at the top. Number of families in parentheses.
When considering the dN/dS values (table 1), we observe that the postduplication branches are evolving significantly faster than the preduplication branches in both older and younger Post-SD duplicates (P = 0.001 and P < 10−6, respectively, Wilcoxon’s test). For the younger Pre-SD duplicates, the rate initially increases by about 2–3-fold (P < 10−3 PreDupl vs. PostDupl) and subsequently experiences a similar decrease (P = 0.006 PostDupl vs. PostSp). In the older Pre-SD duplicates, there are no significant differences between the PreDupl, PostDupl, and PostSp branches. The same result is obtained when we consider only the faster evolving copy of each pair (supplementary data, Supplementary Material online). Thus, older duplicates in the Pre-SD set (∼56.5 My mean age) appear to have already returned to their initial preduplication dN/dS values before speciation (∼16 Ma), which means that in rodents 40.5 My may be sufficient for purifying selection to erase signs of duplication driven acceleration. Using the same rationale, because we detect significant differences between the pre- and postduplication branches of the Post-SD set, we may conclude that 12 My of rodent evolution is not sufficient to return to similar values of dN/dS similar to those of before the duplication event.
The increase in purifying selection after the initial acceleration period was confirmed by comparisons at the intrafamily level. We calculated normalized dS and dN/dS for older and younger Pre-SD and Post-SD duplicates as the average postduplication value divided by the sum of the average postduplication and preduplication values. Using this formula, values have a range from 0 to 1; dN/dS values close to 0.5 indicate that post- and preduplication branches have similar dN/dS, whereas for values larger than 0.5, dN/dS of the postduplication branch is higher. For comparison, in the Pre-SD set, we also calculated the average postspeciation value divided by the sum of the average postspeciation and preduplication values. The results are displayed in figure 4. In both sets, older duplicates displayed significantly higher normalized dS values than younger duplicates, confirming that the two groups represent duplicates of very distinct age (P < 10−8 both sets). For dN/dS, clear differences between younger and older can be detected for the Pre-SD set, with younger duplicates showing significantly higher values (P = 0.01, fig. 4A). In contrast, the younger and older duplicates in the Post-SD set show no significant differences (P = 0.611, fig. 4B).
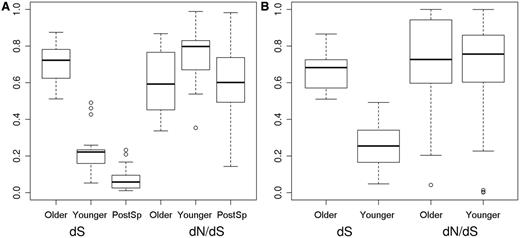
Normalized dS and dN/dS values older and younger for older and younger Pre-SD and Post-SD duplicates. Normalized values were calculated as average postduplication branch values divided by the sum of average postduplication and preduplication branch values (A). Pre-SD set: differences in dS and dN/dS between younger and older duplicates were significant (P < 10−8 for dS and P = 0.01 for dN/dS, respectively, Wilcoxon’s test). Normalized dN/dS in older duplicates was not significantly different from the corresponding value in postspeciation branches (dN/dS Older-PostSp, P = 0.792 and dN/dS Younger-PostSp, P = 0.002, Wilcoxon’s test). (B) Post-SD set: only differences in normalized dS were significant (P < 10−9).
Identification of Positive Selection
To further investigate whether acceleration of one of the copies was related to adaptive processes, we tested for positive selection in each of the branches of those families in which all branches had passed the filters for dN and dS estimation (26 families for the Pre-SD set and 49 families for the Post-SD set) using the branch-site test (see Materials and Methods). We observed a similar increase (∼3.75-fold) in cases showing positive selection following duplication in both Pre-SD and Post-SD families (table 2). No significant differences were detected when comparing the adjusted P-value distributions of branches PreDupl and PostSp (P = 0.514, Wilcoxon’s test), whereas comparisons between PostDupl–PreDupl and PostDupl–PostSp were both significant (P = 0.0005 and P = 0.001, respectively, Wilcoxon’s test). In most cases, the branch showing positive selection was the accelerated one (60% in the Pre-SD set, and 93.3% in the Post-SD set). Table 3 lists several examples of positively selected genes from each group.
Percentage of Branches Showing Significant Positive Selection.
| Sets | PreDupl | PostDupl | PostSp |
|---|---|---|---|
| Pre-SD | 7.69 | 28.85 | 4.81 |
| Post-SD | 4.08 | 15.31 | n.a. |
| Total | 5.89 | 22.08 | 4.81 |
| Sets | PreDupl | PostDupl | PostSp |
|---|---|---|---|
| Pre-SD | 7.69 | 28.85 | 4.81 |
| Post-SD | 4.08 | 15.31 | n.a. |
| Total | 5.89 | 22.08 | 4.81 |
Note.—P < 0.05 Benjamini and Hochberg false discovery rate correction.
Selected Gene Duplicates Undergoing Positive Selection after Duplication Event.
| Set | Gene ID | Description | P* |
|---|---|---|---|
| Pre-SD | ENSMUSP00000023655 | Myxovirus (influenza virus) resistance | 2.26 × 10⁻⁹ |
| ENSMUSP00000009058 | ATP-binding cassette, subfamily B | 3.64 × 10⁻⁶ | |
| ENSMUSP00000028986 | BPI fold containing family A | 6.88 × 10⁻⁴ | |
| ENSMUSP00000130225 | Pyroglutamylated RFamide peptide receptor | 2.06 × 10⁻⁴ | |
| ENSMUSP00000045229 | Fucosyltransferase 2 | 9.11 × 10⁻³ | |
| ENSMUSP00000031693 | Sperm adhesion molecule 1 | 4.12 × 10⁻³ | |
| ENSMUSP00000082947 | Zinc finger protein | 1.86 × 10⁻³ | |
| ENSMUSP00000050330 | GTPase, IMAP family | 1.67 × 10⁻³ | |
| Post-SD | ENSMUSP00000038931 | Glutathione S-transferase, pi 2 | 8.20 × 10⁻⁸ |
| ENSMUSP00000077984 | Kinesin family member C5B | 4.86 × 10⁻⁷ | |
| ENSMUSP00000040485 | Kininogen 1 | 2.20 × 10⁻⁷ | |
| ENSRNOP00000062817 | Type I keratin KA11 | 3.28 × 10⁻⁶ | |
| ENSRNOP00000020952 | Olfactory receptor 68 | 1.46 × 10⁻⁵ | |
| ENSMUSP00000058779 | Olfactory receptor 1033 | 1.00 × 10⁻⁵ | |
| ENSMUSP00000075814 | Solute carrier family 22, member 21 | 1.22 × 10⁻⁴ | |
| ENSMUSP00000036682 | WD repeat domain 20b | 5.26 × 10⁻³ |
Note.—Selection in the Pre-SD occurred in the ancestral rodent gene of the given mouse ID, whereas selection in the Post-SD set occurred in the branch corresponding to the given mouse or rat IDs.
*P value for positive selection using “branch site” test.
Positive selection at the molecular level is usually indicated by a dN/dS ratio higher than 1. However, only 4 branches out of the 12 with dN/dS >1 tested significant for positive selection using the branch-site test, which could be due to the previously reported conservativeness of this test (Zhang et al. 2005; Han et al. 2009; Toll-Riera et al. 2011). The authors of the branch-site test claim that the method is sensitive to sequence and alignment errors (Yang and dos Reis 2011). Given that the rat genome used here is of lower quality than that of mouse, in terms of coverage, number of genes and genes with supporting evidence (Kasprzyk et al. 2004), positive selection may be expected to be overestimated in spite of the careful filtering criteria employed here. However, our results do not appear to be biased because there were no significant differences in the proportion of mouse and rat branches under positive selection.
As genomic context can influence both evolutionary rate and selective processes, where possible, paralogs were classified into parent and daughter copies (see Materials and Methods). For the Post-SD set, we could unambiguously assign the parent–daughter relationship to 23 families, representing 47% of the total set, and in 96% of these cases (22 of 23 families), the daughter copy was the faster evolving duplicate. Five of the 23 families tested significant for positive selection, and in all of them, the gene undergoing selection was the daughter. For the Pre-SD set, nine families (35%) could be similarly classified, and again, in all but one case, the postduplication branch corresponding to the daughter was significantly faster evolving. Of these, three of the families had a postduplication branch that tested significant for positive selection, which was the daughter branch in two cases. The presence of positively selected sites in a protein suggests that it has acquired a novel or modified function. Thus, the data support an important role for neofunctionalization in the evolution of recent rodent gene duplicates.
Tissue-Expression Divergence Patterns
We investigated tissue-expression divergence (dT, see Materials and Methods) of fast and slow evolving mouse duplicates in comparison with the nonduplicated orthologous human gene. We employed 23 families from the Post-SD set and 12 families from the Pre-SD set for which RNAseq-based expression data were available from a recently published mouse and human tissue panel (Brawand et al. 2011). We found that tissue-expression divergence (dT, see Materials and Methods) between the faster evolving copy and the human ortholog was significantly higher than tissue-expression divergence between the slower evolving copy and the human ortholog (P = 0.002 and P = 0.003 for the Pre-SD and Post-SD sets, respectively, Wilcoxon’s test, table 4).
Tissue-Expression Divergence of Duplicated Genes.
| dT | ||||||
|---|---|---|---|---|---|---|
| Pre-SD | Post-SD | |||||
| Hs-F | Hs-S | F-S | Hs-F | Hs-S | F-S | |
| Mean | 0.79 | 0.36 | 0.85 | 0.60 | 0.24 | 0.61 |
| Median | 0.82 | 0.23 | 0.92 | 0.80 | 0.00 | 0.83 |
| Standard deviation | 0.20 | 0.31 | 0.23 | 0.39 | 0.32 | 0.41 |
| dT | ||||||
|---|---|---|---|---|---|---|
| Pre-SD | Post-SD | |||||
| Hs-F | Hs-S | F-S | Hs-F | Hs-S | F-S | |
| Mean | 0.79 | 0.36 | 0.85 | 0.60 | 0.24 | 0.61 |
| Median | 0.82 | 0.23 | 0.92 | 0.80 | 0.00 | 0.83 |
| Standard deviation | 0.20 | 0.31 | 0.23 | 0.39 | 0.32 | 0.41 |
Note.—dT, tissue-expression divergence; Hs, Homo sapiens; F, fast mouse duplicate; S, slow mouse duplicate.
Tissue divergence remained significant when considering just the 14 families from the Post-SD set for which we had both expression data and classification into parent and daughter, with dT between Homo sapiens (Hs) and the parent copy equal to 0.138, and dT between Hs and the daughter copy equal to 0.610 (P = 0.003, Wilcoxon’s test). In general, daughter copies were observed to be expressed in fewer tissues (2.2 on average) than parent copies (4 on average). Tissue-divergence values between human and mouse were not significantly different when comparing retrogene containing families to nonretrogene containing families nor for families located on the same or different chromosomes (P = 0.349 and 0.658, respectively, Wilcoxon’s test). In the five families for which we had expression data and parent–daughter categorization in the Pre-SD set, we observed that the daughter paralog always showed a restricted expression profile, that was a subset of that of the parent paralog, and typically was only expressed in one of the six tissues examined. Five of 23 genes in the Post-SD set had a clear signal of neofunctionalization in the expression data, that is, they were expressed in at least one tissue in which neither their duplicate copy nor the human ortholog was expressed.
Indel Analysis
We investigated the distribution of coding sequence indels in postduplication branches using a previously described protocol for identifying indels from alignments (Laurie et al. 2012). We observed a total of 73 bona fide indels affecting 42 (27%) postduplication branches in the Pre-SD set and 33 indels affecting 22 (22%) postduplication branches in the Post-SD set. Overall, we observed an excess of deletions relative to insertions at a ratio of approximately 1.5:1, and although approximately half the occurrences of each were of one amino acid in length, there was a slight tendency toward insertions being longer than deletions (see supplementary data, Supplementary Material online). We found a strong tendency in both data sets for indels to be found on the faster evolving branch following duplication; 35 of 47 cases in the Pre-SD set (P < 0.01, binomial test), and 30 of 33 cases in the Post-SD set (P < 10−5).
We examined whether there was any association between signs of positive selection and the presence of indels following duplication. Of the 20 branches in the Pre-SD set that tested positive in the branch-site test, 15 had indels, whereas of the remaining 136 branches, only 27 had indels, indicating a significant relationship between positive selection and indels in this data set (P < 10−5, Fisher's exact test). A similar result was found in the Post-SD set where 10 of the 15 branches that had evidence of selection contained an indel event, compared with 8 of the remaining 83 branches (P < 10−5, Fisher's exact test).
Discussion
In this study, we evaluate the dynamics of the evolutionary rate of recent rodent duplicates, considering the ratio of nonsynonymous to synonymous substitution rates (dN/dS) before and after duplication, and after the speciation event separating mouse and rat. Using dN/dS instead of other rate measures, such as dN or the number of amino acid substitutions, has the advantage that we can compare events that occurred at different times. As both accumulation of changes in pseudogenes and putative changes in badly predicted genes will lead to an apparent acceleration in evolutionary rate of the gene concerned and may mimic signals of positive selection, here we have prioritized findings deriving from functional data, rather than just predicted genes, despite this resulting in a substantial decrease in the number of families available for analysis. Our findings in terms of evolutionary rate can be summarized into two main points: acceleration after gene duplication is widespread but limited to just one copy, and evolutionary rate of the accelerated copy shows time dependence.
Acceleration in the evolutionary rate of paralogs compared with orthologs after gene duplication has been widely reported (Lynch and Conery 2000; Van de Peer et al. 2001; Kondrashov et al. 2002; Nembaware et al. 2002; Jordan et al. 2004; Scannell and Wolfe 2008; Panchin et al. 2010). However, when we consider the duplicates individually, we find that they are evolving asymmetrically and, more remarkably, that it is just one of the two copies that shows acceleration, the other copy maintaining the constraints of the ancestral gene. A previous study suggested that asymmetry in evolutionary rates was a general trend in recent human duplicates (Zhang et al. 2003). Focusing on yeast duplicates after a WGD event, Scannell and Wolfe (2008) found a burst of protein sequence evolution in both “initially fast” (5.4 times accelerated) and “initially slow” duplicate clades (2.2 times accelerated) and thus proposed that a form of subfunctionalization leads to the preservation of gene duplicates (Scannell and Wolfe 2008). A further study failed to find significant asymmetry between recent pairs of duplicates, though they were observed to evolve faster than single-copy orthologs (Kondrashov et al. 2002). However, asymmetry may have been underestimated in this study because they discarded those triplets in which the outgroup was closer to a certain paralog than the other paralog.
In this study, we have observed that acceleration of evolutionary rate is only apparent in one of the two duplicates. Here, we have estimated the evolutionary rate of the preduplication branch by using two outgroup species instead of one, in contrast to most previous studies. Analysis of the genomic location of duplicated copies shows that the parent copy evolves in a highly constrained manner, most likely preserving the ancestral function, whereas the daughter copy diverges away. This implies that the two copies are not equal at birth, not only for copies relocated to a different chromosome or retrogenes (Cusack and Wolfe 2007) but also for copies located proximally to each other. These observations strongly support the neofunctionalization model in this data set. To our knowledge, acceleration being limited to just one copy has only previously been reported in a study of yeast duplicates that originated through WGD. In that case, only 17% of the gene pairs showed accelerated evolution after the duplication (Kellis et al. 2004), whereas here the fraction was higher (65.38% and 20.41% for the Pre-SD and Post-SD sets, respectively).
We have observed that evolutionary rate is not constant through time. The initial dN/dS increase, as measured in the Post-SD set (where duplicates are younger than 16 My), is about 5-fold. However, after the initial acceleration, the rate gradually decreases. The less pronounced dN/dS increase after duplication in the Pre-SD set, which contains duplicates that have evolved for a much longer time, as well as the decrease of the rate after speciation, provide strong evidence of this slowdown.
Gene conversion is a recombination process that homogenizes gene pairs and which is believed to be especially important when the copies are nearly identical (Nagylaki and Petes 1982; Innan 2002; Casola et al. 2012). The incidence of this process in our data set is probably very small, as most gene pairs separated many millions of years ago and show very distinct evolutionary rates. Gene conversion may lead to an underestimation of the age of gene duplicates. Although we observe more duplicates classified as younger than as older in the Post-SD set, this is not the case for the Pre-SD set. This seems to suggest that the youngest duplicates are more prone to be lost over time.
We divided the Pre-SD and Post-SD sets into older and younger duplicates to gain further insights into the evolutionary rate changes through time. After this partitioning, we concluded that a period of approximately 40.5 My may be enough to counteract the spike in evolutionary rate following duplication. This is in contrast to observations following WGD in yeast where acceleration appears to have been maintained for over 100 My (Scannell and Wolfe 2008). Assuming that synonymous substitutions per synonymous site and million years in rodents is approximately 0.007 dS /My (Toll-Riera et al. 2011), a genetic distance of about 0.28 dS (0.007 × 40.5) appears to be sufficient to erase any duplication-associated protein evolution acceleration.
Previous studies focusing on C. elegans and yeast (Davis and Petrov 2004; Scannell and Wolfe 2008) found that evolutionarily constrained genes tend to duplicate more frequently than less-constrained genes. However, our set of 152 recently duplicated gene families was composed of significantly accelerated genes when comparing dN/dS of the nonduplicated rodent to an exhaustive set of 1:1 ortholog genes from Toll-Riera et al. (2011) (P = 0.004, Wilcoxon’s test after removing families with dS > 2 and < 0.01). Subsequent examination of gene function showed that the increased rates were mainly due to 25 families defined as receptors, as there were no significant differences when we excluded them from the comparison (P = 0.071, Wilcoxon’s test).
In this data set, we found that a substantial fraction of duplicates exhibited signals of positive selection, suggesting that some of the changes contributing to asymmetry are adaptive. Conant and Wagner (2003) suggested that asymmetric divergence is mainly caused by relaxed selective constraints, though in some cases it may be the result of positive selection, whereas Han et al. (2009) also found that the frequency of duplicates undergoing positive selection is larger than that of single-copy orthologs and that daughter copies transposed to new chromosomal locations are significantly more likely to have undergone positive selection. The observation that gene duplicate retention is higher in mouse than in human has also been taken as evidence that positive selection plays a key role in duplicate retention, as selection is more effective in large populations (Shiu et al. 2006). Taken together with our findings, these observations suggest that positive selection may play a major role in the maintenance of new gene duplicates in the genome.
The observed association between fast evolving branches and the presence of coding sequence indels is in accordance with previous work in which we observed a positive correlation between indels and dN/dS in one-to-one orthologs in rodents (Laurie et al. 2012). The finding here that this association also extends to proteins for which there is evidence of positive selection is interesting in light of a recent finding suggesting that indels themselves may increase the likelihood of mutation in the surrounding sequence when segregating in the heterozygous state (Tian et al. 2008). Positive selection can only act upon mutations that have already occurred, and thus it would be interesting to know whether the observed indels predate sequence mutations that were subsequently positively selected in these young duplicates. Unfortunately, there are no available models to test whether indel events themselves may be selected for.
Taking into account the important amino acid substitution rate differences between duplicated copies, one might expect diverse gene expression patterns as well. We observe that, in general, constrained copies retain a similar pattern to that of their single-copy ortholog, whereas accelerated duplicates present a significantly different expression pattern compared with the constrained form. Again, these findings support the idea that slow evolving copies preserve the original function, whereas fast evolving copies gain new functions, in agreement with the “ortholog conjecture” hypothesis, which states that function is more conserved between orthologs than paralogs but that it can change rapidly after gene duplication, as recently validated using experimental data (Altenhoff et al. 2012). Tissue-divergence patterns seem to be related to the genomic location of duplicates, because patterns when comparing fast- and slow evolving copies were distinct for duplicates located on different chromosomes but not when considering only retrogenes. It is worth noting that significant differences in tissue-divergence patterns were detected even though it is likely that the true values are being underestimated, firstly due to the limited number of tissues for which data was available, and secondly because we only tested tissue-related differences.
Previous studies have failed to find a correlation between tissue-divergence expression and the evolutionary rate of coding sequence (Wagner 2000; Conant and Wagner 2003) or found only a weak correlation, for example, only significant for dN < 0.2 (Makova and Li 2003). These findings have led to the suggestion that expression divergence may be mainly related to changes in the promoter region, because evolution of coding sequence appears to be only weakly coupled to gene expression (Wagner 2000). Though the analysis of promoter regions remains a difficult task, a modest but significant correlation between the 2 kb region upstream of the transcription start site and expression divergence has been observed (Farré and Albà 2010), suggesting a role of promoter regions in modifying expression patterns of duplicated genes. However, in both the Pre-SD and the Post-SD sets, we have detected a relationship between tissue-expression divergence and evolutionary rate, because in general faster evolving daughter copies show a more divergent tissue-expression pattern. Thus, we suggest that the evolution of gene expression in gene duplicates may be driven by changes in both coding and regulatory regions.
In summary, by using a collection of rodent duplicated gene pairs of different age, we have been able to unravel important inherent features of the gene duplication process. We have discovered that evolutionary rate acceleration after duplication is widespread but restricted to one of the copies, which increases its rate about 5-fold on average, whereas the other copy maintains the ancestral constraints. The copy-specific acceleration is associated with positive selection and functional diversification, in agreement with the neofunctionalization model. The acceleration period has a limited duration, and the rate gradually decreases until it returns to its initial values. An interesting possibility is that the acquisition of a novel function by one of the copies is facilitated by the existence of side activities in the ancestral gene that become more important in the newly generated copy (Bergthorsson et al. 2007; Näsvall et al. 2012). Optimization of the secondary function would apparently require less than 40.5 My of rodent evolution.
Materials and Methods
Data Retrieval and Sequence Alignments
We obtained an exhaustive list of paralagous mouse and rat protein coding genes that arose as a result of a single duplication event following divergence from the primate lineage, together with their corresponding human ortholog, using Biomart at Ensembl (r65) (Flicek et al. 2012). To ensure a high-quality data set, we applied the following initial filtering criteria to all pairs of duplicates: We discarded pairs where the percentage of identity between copies was lower than 50%, pairs with overlapping location (which are likely to represent distinct splice forms rather than duplicated genes), and genes lacking experimental evidence of expression. We also removed one family containing selenocysteines as these are interpreted as stop codons by CodeML. Genomic location and the percentage of identity between copies were obtained from Biomart, and experimental evidence of expression from the University of California–San Cruz (UCSC) Table Browser (considering both mRNA and EST tracks), using the mm9 and rn4 databases (Karolchik et al. 2004). Nonduplicated orthologs from cow, dog, horse, or cat were used as outgroups. We used an in-house Perl script to select sets of transcripts with the most similar length across species, for use as the representative protein.
Protein families were split into two groups according to whether duplication occurred before (prespeciation duplication set, Pre-SD) or after (postspeciation duplication set, Post-SD) the mouse-rat speciation event. The speciation event provides a natural landmark in time allowing us to compare dN/dS before and after gene duplication, and during different time intervals in the evolutionary history of these two groups of genes. Concerted evolution is a process involved in the maintenance of sequence similarity between gene copies through different recombination mechanisms, such as gene conversion (Ohta 2010). If concerted evolution occurred in families where both mouse and rat genes were duplicated before the speciation event, the observed tree might be inconsistent with the real tree (Teshima and Innan 2004). To minimize this bias, we constructed phylogenetic trees using ML methodology as implemented in the Proml program of the Phylip package (Felsenstein 2005), and we just kept those families where the topology was the same as that obtained from the Ensembl Compara pipeline (Vilella et al. 2009) and discarded those with noncoinciding topologies. A total of 117 families remained for the Post-SD set (in 15 of them both mouse and rat genes were duplicated) and 35 families for the Pre-SD set (supplementary data, Supplementary Material online). The 117 Post-SD families contained a total of 132 duplicated gene pairs (264 individual duplicated genes) as in a small subset of them the gene had duplicated in both the mouse and rat branches. The 35 Pre-SD families contained 70 duplicated gene pairs represented in both mouse and rat, for a total of 140 individual duplicated genes. For each protein family, we performed a multiple protein sequence alignment with the program Prank+F (Löytynoja and Goldman 2008) using the previously obtained ML trees as a guide tree. Corresponding nucleotide sequence alignments were generated from the Prank alignments using PAL2NAL (Suyama et al. 2006).
Estimation of Evolutionary Rates and Positive Selection Tests
The number of nonsynonymous substitutions per nonsynonymous site (dN), synonymous substitutions per synonymous site (dS), and the corresponding dN/dS ratio were estimated using the ML method implemented in the CodeML program of PAML version 4.4 (Yang 2007). We used the free-ratio “branch” model, which allows the calculation of a distinct ratio for each branch, and equilibrium codon frequencies as free parameters (Codonfreq = 3). To determine the degree of acceleration and the percentage of asymmetry between duplicates, we compared the evolutionary rates between the preduplication and postduplication branches, and between the two paralogs using Fisher's exact test.
We tested for positive selection with the “branch-site” test (Test 2 implemented in CodeML) (Zhang et al. 2005). This test compares the null model where codon-based dN/dS for all branches can only be ≤1, with the alternative model where the labeled foreground branch may include codons evolving at dN/dS > 1. The likelihood ratio test was used to compare the two models. It was calculated as 2*(L1 − L0), where L1 is the ML value of the alternative hypothesis and L0 the ML value of the null hypothesis. A χ2 distribution with 1 degree of freedom was used to calculate the P value, which was adjusted for multiple testing using the false discovery rate method of Benjamini and Hochberg (1995) within the multtest package of R.
Data Filtering
Additional filters were applied to our data sets to ensure a high-quality data set for evolutionary rate calculations, as previously described elsewhere (Toll-Riera et al. 2011). We removed families with very short alignments, that is, less than 100 triplets excluding gaps, families with dS > 2 because such high values may indicate incorrect ortholog identification (1 family), and families with dS < 0.01 because very low dS values may lead to erroneously high estimates of the dN/dS ratio (82 families). Two further families were removed from the Pre-SD set due to the Ensembl gene prediction for one of the rat orthologs in each containing many dubiously short introns. For the Post-SD set, we analyzed separately those gene duplicates that occurred independently in the mouse and the rat lineages in a certain protein family. Comparison of rates in the different branches of the same family was only performed for families in which all branches had passed the filters, that is, 49 families for the Post-SD set and 26 families for the Pre-SD set. The Pre-SD set contained 52 mouse duplicated genes, 52 rat duplicated genes, and 26 single-copy human orthologs, whereas the Post-SD set comprised 49 protein families, formed from 74 mouse duplicated genes, 24 rat duplicated genes, and 49 single-copy human orthologs. In five gene families of the Post-SD set, the gene duplication occurred after the speciation event, according to Compara prediction and the ML tree constructed using ProML (see earlier).
Duplicate Classification
The genomic location of duplicated genes and number of exons in each were obtained from Biomart (Haider et al. 2009). We classified as possible retrogenes those genes having a single exon when the corresponding paralog and ortholog copies are composed of multiple exons (Farré and Albà 2010). Where possible, genes were classified into parent and daughter copies by looking for conserved synteny using the Galaxy server to access the UCSC Genome Browser (Goecks et al. 2010) under the assumption that the parent gene will have a longer extent of conserved synteny than the daughter copy. The “Extract MAF blocks” tool was used to obtain multiple alignments for a given set of genomic intervals, and the resulting predicted parent–daughter relationships were manually compared with Ensembl r65 to check for retention of gene order. Duplicates closely located on the same chromosome (<300 kb) were excluded from this analysis because syntenic relationships are less clear at such short distances. Correspondence was found in all manually checked cases, indicated by the observation that the order of the genes surrounding the predicted parent copy and the orthologous human gene were similar. A total of 46 genes for the Post-SD set and 24 genes for the Pre-SD set could be classified into parent and daughter copies.
Gene Expression
Human and mouse gene expression data were obtained from a recent large-scale comparative RNA-seq study that used the Illumina Genome Analyzer IIx (Brawand et al. 2011). Data were available for human and mouse for six tissues: brain, cerebellum, heart, kidney, liver, and testis. Though the number of replicates varied between tissues, for most tissues there were data from one female (except testis and human liver) and two males (with the exception of human cerebellum [1 male] and brain [5 males]). Gene expression levels were reported as the mean per-base read coverage, and the authors consider values lower than 3 to be indicative of low expression. We used this value as a cutoff to discriminate between well-supported expression and background noise. We extracted gene expression data for a total of 184 genes (122 mouse and 62 human) from out data set, which correspond to 25 complete (i.e., a single-copy human gene and two mouse duplicates) Pre-SD and 33 complete Post-SD families. Tissue-expression divergence (dT) was calculated by subtracting the number of tissues where both duplicates were expressed (i.e., the intersect) from the number of tissues in which at least one of the duplicates was expressed (i.e., the union), and dividing by the latter, as described in Farré and Albà (2010). Because of low expression of the human copy or one of the two paralogs in all examined tissues, tissue-expression divergence could not be estimated for 23 families (13 Pre-SD and 10 Post-SD). We performed calculations comparing the single-copy human gene to each of the orthologous mouse duplicates and comparing the two mouse paralogs to each other. We also identified putative cases of neofunctionalization, defined as cases where one paralog is expressed in a specific tissue, in which neither the second paralog nor the single-copy ortholog are expressed.
Indel Analysis
The position and size of all indel events within the coding sequence of the proteins analyzed, as determined from the multiple alignments, were identified using an in-house Perl script as described elsewhere (Laurie et al. 2012). Indels were discarded if they were found to be proximal to an Ensembl-defined exon boundary, as such cases are more likely to represent errors in exon definition within the gene-building algorithm rather than true indel events.
GO Analysis
A GO (Ashburner et al. 2000) enrichment analysis was performed for all 152 gene families using the FatiGO program of the Babelomics v4.3 integrative platform (Medina et al. 2010). FatiGO tests for an enrichment in any of the three ontologies (biological process, cellular component, or molecular function) from levels 3 to 9, calculating a two-tailed Fisher's exact test and adjusting for multiple comparisons (Al-Shahrour et al. 2007).
Statistical Tests and Graphs
Wilcoxon’s, χ2, Fisher's exact, proportion tests, and Spearman correlations were performed using the R statistical software package (R Development Core Team 2010). Graphs were also produced using R and in particular the ggplot2 package (Wickham 2009). False discovery rate corrections for simple multiple testing were calculated following the Benjamini and Hochberg procedure (Benjamini and Hochberg 1995) using the multtest package from http://bioconductor.org/biocLite.R (Gilbert et al. 2009).
Acknowledgments
This work was supported by Ministerio de Economía y competitividad, Spanish Government (Plan Nacional BIO2009-07120 and BFU2012-36820), Generalitat de Catalunya (FI predoctoral fellowship to S.L.), and Fundació ICREA to M.M.A.
References
Author notes
Associate editor: Hideki Innan
