


Abstract
Because pathogens are powerful selective agents, host-cell surface molecules used by pathogens as identification signals can reveal the signature of selection. Most of them are oligosaccharides, synthesized by glycosyltransferases. One known example is balancing selection shaping ABO evolution as a consequence of both, A and B antigens being recognized as receptors by some pathogens, and anti-A and/or anti-B natural antibodies produced by hosts conferring protection against the numerous infectious agents expressing A and B motifs. These antigens can also be found in tissues other than blood if there is activity of another enzyme, FUT2, a fucosyltransferase responsible for ABO biosynthesis in body fluids. Homozygotes for null variants at this locus present the nonsecretor phenotype (se), because they cannot express ABO antigens in secretions. Multiple independent mutations have been shown to be responsible for the nonsecretor phenotype, which is coexisting with the secretor phenotype in most populations. In this study, we have resequenced the coding region of FUT2 in 732 individuals from 39 worldwide human populations. We report a complex pattern of natural selection acting on the gene. Although frequencies of secretor and nonsecretor phenotypes are similar in different populations, the point mutations at the base of the phenotypes are different, with some variants showing a long history of balancing selection among Eurasian and African populations, and one recent variant showing a fast spread in East Asia, likely due to positive selection. Thus, a convergent phenotype composition has been achieved through different mutations with different evolutionary histories.
Introduction
FUT2 gene codes for the alpha(1,2)fucosyltransferase responsible for the synthesis of the H antigen, which is the precursor of the ABO histo-blood group antigens in body fluids and on the intestinal mucosa. Several studies have determined that individuals that are homozygous for any nonfunctional FUT2 allele fail to present ABO antigens in secretions and on epithelial cells, and they are called nonsecretors or se individuals, whereas those individuals carrying at least one functional allele of FUT2 can express ABO on secretions (Secretors or Se individuals). Around 20% of individuals in various populations in the world fail to secrete ABO in body fluids (Koda et al. 2001).
FUT2 is 9,980 bp in total length, and it is composed of two exons (of 118 and 2,995 bp, respectively) separated by a 6,865-bp intron. Although the whole first exon constitutes an untranslated coding region, the second exon codes for a 343-amino-acid protein that has been extensively studied. Many allelic variants with secretor phenotype have been found across FUT2 (Koda et al. 2001; Birney et al. 2007). The most frequent ones are Se40, Se375, and Se481 in Xhosa, South-Africa (Liu et al. 1998) and Se357 and Se480 in Xhosas, Ghanaians, and Europeans (Kelly et al. 1995; Liu et al. 1998; Soejima et al. 2007). In total, 19 different single nucleotide polymorphisms (SNPs) have been described.
Although many polymorphisms in FUT2 are population specific, nonsecretor phenotypes are present in most populations (Soejima et al. 2007). Nonsecretor phenotypes are caused by mutations in the second exon of FUT2 gene, with two alleles being the most common cause of the nonsecretor status: 1) the nonfunctional allele se428, which codes for a stop codon at position 143 (Trp–Ter) and is responsible for the nonsecretor phenotype in Europeans, Iranians, and Africans (Kelly et al. 1995; Liu et al. 1998), and 2) se385, which is the most frequent cause of nonsecretor phenotype in South East and East Asians, due to a reduction of the alpha(1,2)fucosyltransferase activity caused by a missense mutation at codon 129 (Ile–Phe) (Yu et al. 1995; Henry et al. 1996; Koda et al. 2001; Soejima et al. 2007). Two other nonsecretor alleles appear to have a more restricted geographical distribution: se302 in Thai and Bangladeshi populations (Birney et al. 2007; Soejima et al. 2007) and se571 in Samoans (Soejima et al. 2007). Additionally, one deletion (se778), two complete deletions of the coding region (sedel, sedel2), and one fusion gene (sefus) have been reported (Soejima et al. 2007). To date, the molecular description of variation at FUT2 comes from studies in one or a few populations, and a global, DNA sequence-based perspective has not been undertaken. Thus, the novelty of this work is the description of FUT2 phenotype in populations not studied before, and the population-based global analysis of selective forces acting on the gene.
Some studies have reported balancing selection at FUT2 in African populations. Neutrality tests based on 18 SNPs in the FUT2-coding sequence in 121 Ghanaian samples showed an excess of intermediate frequencies, which is indicative of balancing selection (Soejima et al. 2007). Another study, based on genotyping SNPs across 168 genes related to immune function in three populations (CEPH Europeans, Han Chinese, and Yoruba Nigerians), showed that the allele frequency spectra of SNPs at the FUT2 gene are skewed toward intermediate frequencies in Yoruba, which is considered to be the result of balancing selection (Walsh et al. 2006). Recently, a putative promoter region of the gene has been proposed to be under balancing selection in the Yoruba population (Fumagalli et al. 2008). Another study also reports evidence of balancing selection in a European and a Iranian population (Koda et al. 2001). Koda et al. (2000) estimated a very ancient divergence time between Se and se428 at 3.1 million years (Ma). This divergence time for FUT2 is in the same range as that estimated for human ABO locus (2.7–4.7 Ma); for the latter gene, balancing selection has been proposed to be responsible for its ancient coalescence time (Saitou and Yamamoto 1997; Roubinet et al. 2004; Calafell et al. 2008; Fry et al. 2008).
The possible relationship between FUT2 alleles and susceptibility to disease has also been extensively studied. The null allele (se428) has been shown to confer protection to GGII noroviruses (Norwalk-like virus) infection, which is a major cause of acute gastroenteritis worldwide and has been associated with nosocomial infections and food-borne outbreaks (Thorven et al. 2005; Larsson et al. 2006). It has also been claimed that heterozygous (Se/se428) individuals are more prone to be infected by Norwalk-like viruses than secretor homozygotes (Se/Se), whereas nonsecretor individuals (se428/se428) are relatively resistant to the infection (Marionneau et al. 2005). The null allele se428 has also been strongly associated with slow progression of HIV-1 infection (Kindberg et al. 2006).
In this study, we have resequenced the second exon of FUT2 from a large number of samples covering most of human variation worldwide. The aim of this work is to describe the geographic variation in sequence, which will allow us to determine the presence of null alleles in a global scenario and to analyze which selective pressures, probably related with the different pathogenic environments existing in the different geographic areas, have acted on this locus throughout human history. To reach this goal, we searched for signatures of natural selection on FUT2 in many different populations through: 1) the analysis of interpopulation differentiation, 2) the phylogenetic relationships among the inferred haplotypes at the continental group level, 3) the distribution pattern of the most common secretor and nonsecretor haplotypes at the population level, and 4) the variability at intrapopulation level to check for significant decreases or increases of diversity values from those expected under a neutral evolution model. The aim of this study is to elucidate the evolutionary forces that shaped the genetic variation and function in the FUT2 gene in a global survey including different places in the world that represent different pathogenic environments.
Materials and Methods
Samples
We sequenced 732 nonrelated samples from the Human Genome Diversity Panel–Centre d'Etude du Polymorphisme Humain (HGDP–CEPH) (Cann et al. 2002), after excluding all duplicated individuals and first degree relatives (Cann et al. 2002; Rosenberg 2006). These samples were grouped according to their geographical and ethnical origin into 39 populations to avoid very low sample size and regrouped into 7 continental regions (Europe, Middle East and North Africa, Central and South Asia, East Asia, Oceania, America, and Sub-Saharan Africa) as in Gardner et al. (2006).
Sequencing
The coding part of FUT2 second exon (1,032 bp) was resequenced. The amplification primers (5′-ACACACCCACACTATGCCTGCAC-3′ and 5′-ACTTGCAGCCCAACGCATCTT-3′) were located at 100 bp from both ends of the coding region. A second internal pair of primers (5′-CCAGCTAACGTGTCCCGTTTTCC-3′ and 5′-TGCCTCCCTCAAGATGAGTGCC-3′) was located at 13 bp downstream and 35 bp upstream of the coding region, respectively, and were used to sequence the 1,032-bp segment. DNA purification was performed with Biomek FX (Beckman Coulter) using the Montage Seq 96 Kit from Millipore, and ABI3100 sequencer (Applied Biosystems) was used to read all fragments. Sequences were aligned with SeqMan program of the Lasergene v7.1.0.44 package and revised manually by two independent investigators in order to detect heterozygous positions. Polymorphic positions for all sequences are given in supplementary table S1, Supplementary Material online.
Statistical Analysis
The less frequent allele was determined based on the less common allele across all populations (supplementary table S1, Supplementary Material online). Haplotypes were inferred in each population using the Bayesian algorithm in Phase v2.1 software (Stephens et al. 2001) performing 1,000 iterations. Diversity statistics and neutrality test were calculated using DnaSP v 4.50.3 (Rozas et al. 2003). For Fu and Li's D, Fu and Li's F, and Fay and Wu's H, the chimpanzee sequence from the Ensembl database (www.ensembl.org) was used as an outgroup. The significance of neutrality tests was calculated by means of coalescent simulations with COSI software (Schaffner et al. 2005), using a model that takes into consideration the demographic history of humans for three reference populations used in HapMap: CEU (Europeans of North and Central Europe), JPT (Japanese from Tokyo), and YRI (Yoruba from Nigeria). We performed 10,000 iterations using the local recombination rate estimate obtained from HapMap (http://www.hapmap.org/). Significance in Europe, Middle East and North Africa, and Central and South Asia was obtained comparing with the simulations for CEU population; in the case of East Asia, Oceania and America to JPT and Sub-Saharan Africa values with YRI. Some of the populations do not fit well to the demographic model implemented in COSI, as it is the case for Native America and Oceania populations. However, in the absence of available demographic models and empirical distributions, we have used the closest population implemented in COSI to assess significance, as given by the genetic similarities and place of origin of populations from America and Pacific. A median-joining network establishing possible genealogical relationships among haplotypes based on the number of substitutions was performed with Network v4.5.0.0 (Bandelt et al. 1999). With this program, we estimated the time to the most recent common ancestor (MRCA) for the FUT2 coding region. The substitution rate needed for that calculation was estimated as follows: We used the divergence between the human and chimpanzee sequences (K = 0.01029, with a Jukes–Cantor model), considering that the separation of the human and chimpanzee lineages dates to ∼6 Ma. Population differentiation statistics (FST) and their significance were calculated performing an Analysis of Molecular Variance with Arlequin v3.11 (Excoffier et al. 2005); P values were assessed after 1,000 permutations. Extended Haplotype Homozygosity (EHH) decay was computed with Sweep software package v1.1 (http://www.broad.mit.edu/mpg/sweep/index.html) (Sabeti et al. 2002). Additional publicly available data including genotypes in the Human Genome Diversity Panel (HGDP–CEPH) at more than 650,000 SNP loci, obtained with the Illumina BeadStation technology, were retrieved from http://shgc.stanford.edu/hgdp/ (Li et al. 2008).
Results
Nucleotide Variation
We have sequenced the FUT2-coding region in 732 individuals belonging to 39 human populations covering most human population diversity. Full sequence results are shown in supplementary table S1 (Supplementary Material online) and the summary information is shown in table 1. We found a total of 55 SNPs (supplementary table S1, Supplementary Material online) in the second exon of FUT2 (1,032 bp). Previous studies had described 19 SNPs and 1 deletion within the region analyzed here (Koda et al. 2001). In this work, we report 37 new substitutions. Of these 37 SNPs, 27 have low minor allele frequency (MAF) <0.05, most of them (23) being population specific. One of them, SNP at position 342, is specific to the San population with a high MAF (0.20) (supplementary table S1, Supplementary Material online). With the set of samples used here, we could not detect the substitution se628 or the deletion se778 previously described in the literature (Liu et al. 1998; Birney et al. 2007; Soejima et al. 2007).
MAF and Molecular Fixation Indices (FST) for the Polymorphic Positions with MAF > 0.05
 |
|
MAF and Molecular Fixation Indices (FST) for the Polymorphic Positions with MAF > 0.05
|
|
Interpopulation Differentiation Analysis
The FST statistic was used to calculate the allele frequency differentiation among populations: among the 39 populations (FST), among the seven continental groups (FCT) and among the populations included in the same continental group (FSC). Table 1 shows the values for the 26 SNPs with MAF over 0.05. As expected, most of the variability between populations (FST) is explained by the differences among continents (FCT) (Barbujani et al. 1997). Results reveal some high FST values. In order to assess the significance of these results, we have compared them with an empirical FST distribution including genotyping in the Human Genome Diversity Panel samples (HGDP–CEPH) at more than 650,000 SNP loci (Li et al. 2008). Table 1 shows that eight of the substitutions present an FST value above the 95th percentile of the empirical distribution. In addition to these eight SNPs, three more SNPs, despite falling outside of the 95th percentile, also present a remarkably high FST. For one of these eight cases, the high FST value is mainly explained by allele frequency differences between Sub-Saharan Africa versus the rest of continental groups (SNP at position 40). In six cases, high FST values are due to the differences between Europe, Middle East and North Africa, Central-South Asia, and Sub-Saharan Africa in relation to the rest of the populations, mainly to those from East Asia (SNPs at position 171, 216, 385, 428, 739, and 960), a pattern that is unusual in humans and that will be discussed below. And finally, there is one SNP (Se375) showing a high MAF in Oceania and not in the rest of the groups. It is interesting to notice that of the eight SNPs presenting very high FST values, four are nonsynonymous variants, three of them presenting the highest FST. It is worth highlighting that one of these nonsynonymous SNPs, se385, presents a very high FST (0.39) due to its high MAF in East Asia (0.44). Furthermore, it is interesting to note the presence of four contiguous SNPs with very high FST, from position 342 to 385.
Sequence Variation
Diversity indexes of the sequence data for each of the 39 populations and results for four neutrality tests are shown in table 2. For some populations, results are significantly different from those expected under a model of neutral evolution, thus indicating a possible footprint of selection. In particular, Basque and North Italy populations are showing positive significant values for three of the four tests (Tajima's D, Fu and Li's D, and Fu and Li's F), indicating an excess of intermediate frequencies that may have been originated by balancing selection. Notice that many of the populations in West Eurasia (and North Africa) show a trend of positive neutrality test values even if they do not reach statistical significance in many cases. Sub-Saharan Africa presents a more complex pattern: On the one hand, populations in West and Central Africa present high and significant values for the neutrality tests (three of four tests in Mandenka and in Biaka Pygmies), whereas, on the other hand, neutrality tests are negative in other populations (reaching significance in the San but not in Bantu and Mbuti Pygmies), indicating an excess of rare alleles. Thus, negative values are found in the eastern and southern African populations. On the other hand, populations in East Asia show a trend toward negative values, which could be indicative of positive selection. Results in Yakut and San populations must be interpreted with caution, because data come from only four and five individuals, respectively.
Diversity Statistics and Neutrality Tests for the 39 Populations Analyzed
| Continent | Population | N | S | Hd | π | θ | Tajima's Da | Fu and Li Db | Fu and Li Fb | Fay and Wu's Hc |
| AME | Colombian | 6 | 6 | 0.530 | 0.0013 | 0.0019 | −1.28 | −0.01 | −0.42 | −5.18 |
| AME | Maya | 21 | 8 | 0.613 | 0.0011 | 0.0018 | −1.17 | −0.10 | −0.53 | −5.33 |
| AME | Surui | 8 | 1 | 0.325 | 0.0003 | 0.0003 | 0.16 | 0.66 | 0.62 | −1.08 |
| AME | Karitiana | 11 | 1 | 0.485 | 0.0005 | 0.0003 | 1.33 | 0.61 | 0.93 | −0.36 |
| AME | Pima | 12 | 3 | 0.518 | 0.0006 | 0.0008 | −0.54 | −0.72 | −0.59 | −0.38 |
| CSASIA | Balochi | 24 | 9 | 0.755 | 0.0032 | 0.0020 | 1.79* | 0.71 | 1.27 | −0.14 |
| CSASIA | Brahui | 23 | 11 | 0.853 | 0.0031 | 0.0024 | 0.79 | 0.30 | 0.56 | −1.26 |
| CSASIA | Burusho | 18 | 12 | 0.797 | 0.0029 | 0.0028 | 0.12 | 0.38 | 0.44 | −1.58 |
| CSASIA | Hazara | 21 | 9 | 0.747 | 0.0031 | 0.0020 | 1.48* | 0.74 | 1.17 | −0.26 |
| CSASIA | Kalash | 17 | 8 | 0.702 | 0.0032 | 0.0019 | 1.99* | 0.67 | 1.30 | −0.54 |
| CSASIA | Makrani | 23 | 14 | 0.824 | 0.0036 | 0.0031 | 0.53 | −1.45 | −0.91 | 0.49 |
| CSASIA | North_West_China | 19 | 11 | 0.747 | 0.0016 | 0.0025 | 1.10 | −0.81 | −1.08 | −5.18 |
| CSASIA | Pathan | 17 | 10 | 0.763 | 0.0030 | 0.0024 | 0.82 | 0.27 | 0.54 | −0.89 |
| CSASIA | Sindhi | 21 | 11 | 0.703 | 0.0033 | 0.0025 | 1.04 | −0.26 | 0.21 | 0.40 |
| EASIA | Cambodian | 9 | 5 | 0.621 | 0.0012 | 0.0014 | −0.42 | −1.33 | −1.27 | −0.65 |
| EASIA | Han | 34 | 4 | 0.669 | 0.0009 | 0.0008 | 0.27 | 0.98 | 0.89 | −2.71 |
| EASIA | Japanese | 19 | 4 | 0.802 | 0.0012 | 0.0009 | 0.79 | −0.05 | 0.24 | −1.75 |
| EASIA | North_East_China | 30 | 8 | 0.649 | 0.0009 | 0.0017 | −1.14 | −0.99 | −1.24 | −6.39 |
| EASIA | South_China | 48 | 11 | 0.730 | 0.0012 | 0.0021 | −1.11 | −2,63* | −2,49* | −2.10 |
| EASIA | Yakut | 4 | 7 | 0.643 | 0.0019 | 0.0026 | −1.36 | −0.17 | −0.56 | −4.71 |
| EUR | Adygei | 14 | 9 | 0.791 | 0.0033 | 0.0022 | 1,47* | 0.20 | 0.71 | −0.03 |
| EUR | Basque | 20 | 7 | 0.779 | 0.0030 | 0.0016 | 2.51** | 1,30* | 2,00** | −0.13 |
| EUR | French | 17 | 10 | 0.786 | 0.0031 | 0.0024 | 0.93 | 0.27 | 0.58 | −0.48 |
| EUR | North_Italy | 20 | 7 | 0.688 | 0.0030 | 0.0016 | 2.43** | 1,30* | 1,97** | −0.43 |
| EUR | Orcadian | 8 | 7 | 0.442 | 0.0024 | 0.0020 | 0.57 | 0.74 | 0.82 | −0.43 |
| EUR | Russian | 15 | 10 | 0.784 | 0.0027 | 0.0025 | 0.30 | 0.81 | 0.85 | −2.66 |
| EUR | Sardinian | 25 | 9 | 0.745 | 0.0033 | 0.0020 | 1.90* | 0.01 | 0.76 | 0.47 |
| MENA | Bedouin | 32 | 13 | 0.792 | 0.0034 | 0.0027 | 0.83 | −0.14 | 0.24 | 0.29 |
| MENA | Druze | 40 | 9 | 0.646 | 0.0028 | 0.0018 | 1.55* | 0.61 | 1.12 | −0.08 |
| MENA | Mozabite | 17 | 9 | 0.759 | 0.0033 | 0.0021 | 1.61* | 0.13 | 0.72 | −0.04 |
| MENA | Palestinian | 35 | 11 | 0.705 | 0.0031 | 0.0022 | 1.14 | −0.47 | 0.12 | 0.49 |
| OCE | NAN_Melanesian | 10 | 3 | 0.663 | 0.0087 | 0.0930 | 0.42 | 1,01* | 1.00 | 0.69 |
| OCE | Papuan | 13 | 4 | 0.686 | 0.0013 | 0.0010 | 0.79 | 1,09* | 1.18 | −1.12 |
| SSAFR | Bantu | 12 | 15 | 0.822 | 0.0038 | 0.0039 | −0.07 | −1.26 | −1.05 | 0.93 |
| SSAFR | Biaka_Pygmies | 25 | 10 | 0.793 | 0.0027 | 0.0022 | 0.65* | 0,80* | 0,90* | −2.31 |
| SSAFR | Mandenka | 17 | 10 | 0.770 | 0.0035 | 0.0024 | 1.45** | 1,49** | 1,76*** | 0.35 |
| SSAFR | Mbuti_Pygmies | 12 | 12 | 0.663 | 0.0019 | 0.0031 | −1.35 | −0.56 | −0.96 | −4.59 |
| SSAFR | San | 5 | 10 | 0.844 | 0.0022 | 0.0034 | −1.53* | −0.68 | −1.09 | −3.38 |
| SSAFR | Yoruba | 10 | 12 | 0.863 | 0.0038 | 0.0033 | 0.56 | 0.18 | 0.36 | 0.98 |
N = number of individuals; S = segregating sites; Hd = haplotype diversity; π = average number of nucleotide differences per site; θ = Watterson estimator; *P < 0.05; **P < 0.01; ***P < 0.001.
The empirical distributions of Tajima's D of 132 genes included in the SeattleSNPs database, in European–American and African–American populations (Akey et al. 2004) allow for a comparison with the present results. Three European (Basque, North Italy, and Sardinian) and three African (Mandenka, Biaka Pygmies, and Yoruba) populations show Tajima's D values higher than the 95th percentile in the Seattle SNP distribution. In the case of the Basque and the Sardinian populations, the obtained value even exceeds that of ABO, a gene already proposed to be under balancing selection (Calafell et al. 2008). Additionally, we have also compared our results with that from the Environmental Genome Project (NIEHS [National Institute of Environmental Health Sciences] SNPs, http://egp.gs.washington.edu), with similar samples with the ones we use for Europeans, East Asians, and Sub-Saharan Africans. We have compared our results with those obtained in previous works (Cagliani et al. 2008; Fumagalli et al. 2008), where a distribution of 5-kb windows is generated from the NIEHS genes data set. Tajima's D values in Mandenka, Basques, Sardinian, and North Italy population fall in the upper 95th percentile of their respective continent distribution. In the case of the North East and South China populations (those showing lower Tajima's D values in the East Asian continent, excluding the Yakut), the results do not show statistical significance. Finally, we have produced two more distributions from the NIEHS database, one including all the exons from those 250 genes typed in the Europeans, East Asians, and Sub-Saharan Africans samples and another including only those exons longer than 500 bp. Results show that Tajima's D values we have obtained for three European populations (Basque, North Italy, and Sardinians) fall within the 95th percentile of these empirical distributions. In the case of Sub-Saharan African, no population falls above the 95th percentile of both empirical distributions, and finally two East Asian populations (South China, North East China) fall below the 5th percentile of both distributions.
Genealogical Relationship among Haplotypes
Using all sequenced individuals, we identified a total of 96 haplotypes in the FUT2-coding region (supplementary table S2, Supplementary Material online, table 3). To determine the relationship among them, we constructed a median-joining network; the chimpanzee sequence was used to root the network. Figure 1 shows the network with relative frequencies and geographic origin, with an insert of the same network but based in the secretor/nonsecretor status. The haplotype structure of FUT2 is divided into two main groups, and se428 is one of the polymorphisms that define such groups. This is both a functional and a geographical clustering: The left-hand side of the network contains only nonfunctional haplotypes and chromosomes from the continents where signals of balancing selection were found (i.e., West Eurasia and Africa); on the right-hand side, a cosmopolitan assortment of both functional and nonfunctional haplotypes can be found. Nonfunctional haplotypes in the right-hand cluster are the frequent H8 and the much rarer H51 and H53, which are defined by the se385 substitution, and are found in East Asia and derived populations (Oceania and the Americas). The contrast in haplotype diversity is noticeable between the nonfunctional carriers of se428 and of se385; the latter contrasts not only with the former, but also with the star-like structure of the network around its neighbors, H3 and H10. Carriers of se302 (H12 and its derivatives: H33 and H39) are much rarer and practically restricted to South and Central Asia.
Most Frequent Haplotypes Described in the 39 Populations Analyzed
 |
|
Most Frequent Haplotypes Described in the 39 Populations Analyzed
|
|
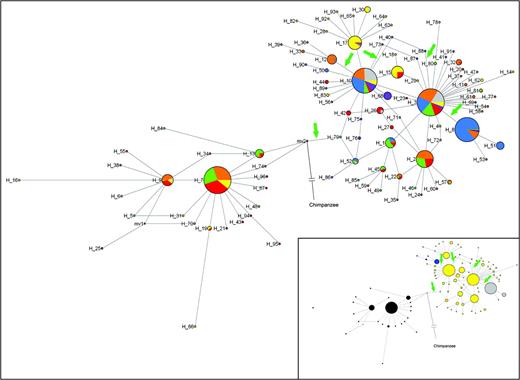
Median-joining network of FUT2 haplotypes in seven continental regions. America (gray), Central-South Asia (orange), East Asia (blue), Europe (green), Middle East and North Africa (red), Oceania (purple), and Sub-Saharan Africa (yellow). Circles correspond to haplotypes and their areas are proportional to the frequency of the haplotype. Haplotype number is shown next to circles. Inactivating mutations have been indicated by an arrow. The insert shows the same median-joining network of FUT2 haplotypes according to phenotypes: The topology is the same as in the main figure; here, colors indicate the haplotypes carrying different secretor/nonsecretor variants; se302 (blue), se385 (gray), se428 (black), se571 (red), and Se (yellow). The chimpanzee sequence has been included as an ancestral haplotype in both figures.
Figure 2 shows the worldwide distribution of the four groups of haplotypes carrying nonsecretor alleles (se302, se385, se428, and se571) and the four major haplotypes (together with their derived haplotypes) carrying secretor mutations. The worldwide distribution of secretor alleles is mainly explained by haplotypes related to H3 (red) and H10 (orange), which are ubiquitous, whereas secretor haplotypes related to H2 (brown) are specific of Europe and Central and South Asia and those related to H17 (yellow) are exclusive of Sub-Saharan Africa. On the other hand, nonsecretor haplotypes are frequent in Eurasia and Africa, even if they are produced by different substitutions. Specifically H7, the haplotype carrying the se428 null allele, is the most common null haplotype, being present in half of West Eurasians and nearly half of Africans. Notice that haplotypes carrying se385 allele (H8–H51–H53 in dark blue) are exclusive of East Asia, except for the two more eastern Central and South Asian populations (Burusho and North West China, which could have received East Asian gene flow) and Melanesians. Haplotypes carrying se302 allele (H12, green) seem to be specific to Central and South Asian populations, although they are slightly represented in Cambodians. Finally, the haplotype carrying se571 allele (H40, cyan) seems to be particular of Cambodian population.
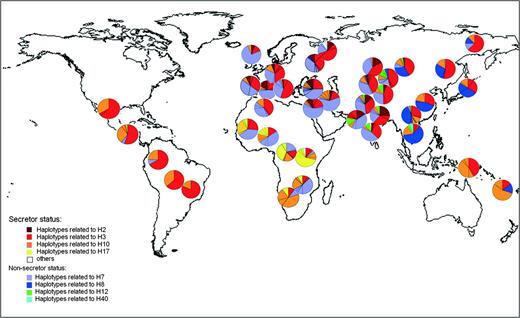
Geographical distribution of haplotypes carrying variants conferring secretor and nonsecretor phenotypes. Each color represents a frequent haplotype and those haplotypes phylogenetically close to it. Each pie corresponds to a different population in each geographical location.
Long-Range Haplotype Analysis
Because neutrality tests results tended to indicate the action of positive selection in East Asian populations, we examined the FUT2 region for signs of recent positive selection applying the long-range haplotype tests (EHH and iHS [integrated Haplotype Score]). We have compared the data from FUT2 with 69 regions related to glycosylation processes (mainly sialylation, fucosylation, and galactose tranfering) (Ferrer-Admetlla A, Sikora M, Laayouni H, Bosch E, Casals F and Bertranpetit J, unpublished data). For these purposes, we analyzed the publicly available SNP data genotyped in the Human Genome Diversity Panel samples (HGDP–CEPH) (Li et al. 2008), including SNPs up to 400 kb in both directions from each gene. To detect the signal of positive selection on the FUT2 region, we measured the EHH versus core haplotype frequency at a fixed length of 0.3 cM in both directions from the core haplotype (Sabeti et al. 2002). P values were significant (<0.05) for 17 core SNPs in four East Asian populations (Yakut, Han, Cambodian, and North East China); however, after applying multiple testing correction (Hochberg and Benjamini 1990), none of the cited 17 SNPs remains significant (q value = 0.20). We also applied the iHS method (Voight et al. 2006), where the integral under the EHH decay plot from any individual SNP is calculated. With this method, we detected a peak at ∼600 kb from the 5′ extreme of FUT2. Several genes are mapped between FUT2 and this position, making unreliable the relationship between this signature and a positive selection event at FUT2.
Discussion
Our results indicate that neutral processes alone cannot explain diversity patterns at FUT2. The phylogenetic structure of variation, the geographic distribution of variants, the degree of population differentiation, and the neutrality tests for widespread human populations show a complex picture that points to natural selection and its different actions stratified according to geography. Neutrality tests show significant positive Tajima's D values for 11 of the 39 populations, mainly from four continental groups in West Eurasia and Africa (Europe, Middle East and North Africa, Central and South Asia, and Sub-Saharan Africa). Moreover, some of these populations present high and significant values for other neutrality tests (table 2). These results suggests balancing selection as the force governing FUT2 evolution in these regions, and is in agreement with previous studies based in some African, European, and West Asian population (Koda et al. 2001; Walsh et al. 2006; Soejima et al. 2007; Fumagalli et al. 2008). The estimation of the time depth of the phylogeny (see Materials and Methods) gives an age for the MRCA of 2.61–5.27 Ma, which is higher than that estimated for neutral genes (0.7–1.2 Ma) (Clark et al. 1998; Templeton 2005; Garrigan and Hammer 2006).
The different signatures of selection presented by Sub-Saharan African populations deserve attention. The large number of samples included in this study allows us to assess the phenotype of populations where FUT2 had never been studied before. Although in other continents selective pressures show a quite homogeneous pattern, we observe a clinal tendency in Sub-Saharan Africa, with evidence of balancing selection in West and Central Africa. Biaka Pygmies and Mandenka, and to a lesser extent the Yoruba population, show signatures of balancing selection that are not detected in the rest of populations in this continent. Previous works on the Yoruba (Walsh et al. 2006) and a Ghanaian population (Soejima et al. 2007) are in agreement with our results. On the other hand, the Tajima's D value (1.52) described in a Xhosan population and initially interpreted as not significant (Koda et al. 2001) is significant when demographic models are used (Soejima et al. 2007). This fact suggests that the absence of balancing selection would be restricted to the more eastern populations. Some other peculiarities can be observed, as the presence of one haplotype (H17) at high frequencies in both Pygmy populations that is rare in the rest of populations. This phenomenon could be the result of selection acting on populations being exposed to particular environment conditions that could have favored this haplotype.
The interpopulation differentiation statistics (FST) provides more evidence supporting balancing selection in FUT2, as well as the existence of different evolutionary forces acting in different continental groups. Although not conclusive (Gardner et al. 2007), high FST has also been taken as an indicator of local-specific selective pressures, leading to positive selection (Barreiro et al. 2005; Nielsen 2005). On the other hand, the effect of balancing selection on FST is less clear. It has been proposed that balancing selection should decrease the interpopulation differentiation levels (Akey et al. 2002; Nielsen 2005), as would be expected if the same allelic variants are maintained in different populations as reported in some innate immunity receptors and in the IL10 and CCR5 genes (Bamshad et al. 2002; Wilson et al. 2006; Ferrer-Admetlla et al. 2008). Our obtained FST values reflect the action of different selective forces in different geographic areas. As stated above, the high global FST values are primarily the result of the distinct allele frequencies reported in the East Asia populations. In contrast, if this continent together with America and Oceania are excluded from the analysis, the FST values decrease drastically. East Asian populations follow a different pattern than the rest of the world. It is not trivial to understand why the inactivated African–West Eurasian allele is not present in East Asia and thus how a new variant appeared and increased in frequency. The East Asian nonsecretor phenotype is achieved by another mutation found only in H8 and in two derived haplotypes. This inactivating mutation is of recent origin and shows a drastic increase in frequency, accounting for around 50% of chromosomes and generating very little haplotype diversity (just two other haplotypes with a single substitution each). Thus, positive selection has to be invoked to explain the increase of the Asian allele. However, our analyses have failed to detect significant signatures of positive selection considering the total FUT2 variation; in fact, this footprint would only affect some parts of the tree, as selection has shaped the variation at different times.
The main question is the possible meaning of balancing selection for a set of haplotype variation with just two phenotypes and dominance of the secretor one. A plausible explanation for balancing selection might be the already reported beneficial effects of homozygous null-allele individuals. Some works have demonstrated that se428 (the null allele carried by H7 haplotype) confers protection against certain pathogens, such as the Norwalk-like virus, or that it plays a role in slowing the progression of HIV-1 infection (Marionneau et al. 2005; Kindberg et al. 2006). In a recent work, this variant has been demonstrated to be in strong linkage disequilibrium with the G allele of Se171 and that women homozygous for the latter had higher B12 levels, suggesting that the nonsecretor allele se428 is a plausible mechanism for altered B12 absorption and plasma levels. Recently, several new examples of balancing selection exerted by infectious disease have been published, including innate immunity genes (Cagliani et al. 2008; Ferrer-Admetlla et al. 2008), blood group antigen genes (Fumagalli et al. 2008), or the human major histocompatibility complex (Solberg et al. 2008).
Evolutionary forces have changed in space and time among human populations and they have to accommodate adaptation with the already existing variants. Nonetheless, the final adaptation in all African and Eurasian populations seems to have followed a common general pattern through different basic genetic variants. A detailed description of the selective events acting on genetic elements along history may be difficult to achieve, but molecular variation analysis can contribute to a better understanding of the natural history of a gene and of its phenotypic effects.
This research was funded by grants BFU2005-00243 and SAF-2007-63171 awarded by Ministerio de Educación y Ciencia (Spain) and by the Direcció General de Recerca of Generalitat de Catalunya (Grup de Recerca Consolidat 2005SGR/00608). Funds were also from the Etablissement Français du Sang (EFS) Centre Atlantique, and from the Ministère Français de la Recherche (EA3034). All the sequencing was done at the Genomic Service, Universitat Pompeu Fabra; we thank Stéphanie Plaza and Roger Anglada for their help. Computational analysis was helped by the National Institute for Bioinformatics (www.inab.org), and SNP genotyping services were provided by the Spanish “Centro Nacional de Genotipado” (CEGEN; www.cegen.org); both are platforms of Genoma España. A.F.-A. is supported by a PhD fellowship from UPF and M.S. from the Programa de becas FPU del Ministerio de Educación y Ciencia, Spain (AP2005-3982).
References
Author notes
Present address: Centre de Recherche, CHU Sainte-Justine, Université de Montréal, Montréal, Québec, Canada.
Anne Stone, Associate Editor
