


Abstract
Structural properties of a protein residue's microenvironment have long been implicated as agents of selective constraint. Although these properties are inherently quantitative, structure-based studies of protein evolution tend to rely upon coarse distinctions between “surface” and “buried” residues and between “interfacial” and “noninterfacial” residues. Using homology-mapped yeast protein structures, we explore the relationships between residue evolution and continuous structural properties of the residue microenvironment, including solvent accessibility, density and distribution of residue–residue contacts, and burial depth. We confirm the role of solvent exposure as a major structural determinant of residue evolution and also identify a weak secondary effect arising from packing density. The relationship between solvent exposure and evolutionary rate (dN/dS) is found to be strong, positive, and linear. This reinforces the notion that residue burial is a continuous property with quantitative fitness implications. Next, we demonstrate systematic variation in residue-level structure–evolution relationships resulting from changes in global physical and biological contexts. We find that increasing protein-core size yields a more rapid relaxation of selective constraint as solvent exposure increases, although solvent-excluded residues remain similarly constrained. Finally, we analyze the selective constraint in protein–protein interfaces, revealing two fundamentally different yet separable components: continuous structural constraint that scales with total residue burial and a more surprising fixed functional constraint that accompanies any degree of interface involvement. These discoveries serve to elucidate and unite structure–evolution relationships at the residue and whole-protein levels.
Introduction
Identifying properties that influence protein evolutionary rate is an important objective in biology (McInerney 2006; Pal et al. 2006; Rocha 2006). Structural properties deserve great attention in this area, as they connect protein evolution with fundamental biophysical principles (Franzosa and Xia 2008; Goldstein 2008). The highest possible resolution for investigating structure–evolution relationships is that of individual residues and their corresponding microenvironments (see fig. 1 for illustration). Many structural properties can be defined at the residue level, and correlating such properties with residue evolution allows us to identify elemental selective forces. These forces are interesting in their own right, and their summed effects contribute to our understanding of system-level evolutionary phenomena.
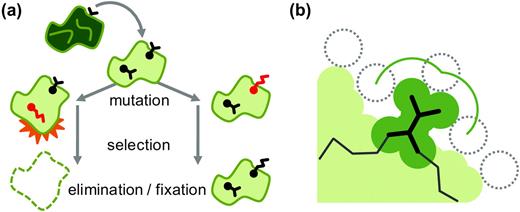
Evolutionary implications of the residue microenvironment. (a) A cartoon diagram of a protein is shown in cross section, highlighting two residues: one completely buried in the core and another partially exposed to solvent. Mutations occur at both sites, but whether or not they go to fixation depends on the properties of the residue microenvironments and their effects on the overall stability and function of the protein. (b) One quantitative property of the residue microenvironment is shown in detail. Here, a solvent molecule (dotted circle) traces the solvent accessible surface of a particular residue, shown in heavy wireframe.
Exposure to solvent is one such structural property that has received attention as a correlate of molecular evolution, both at the whole-protein and residue levels. It was observed early in the history of structural biology (Perutz et al. 1965) and has been repeatly confirmed since (Overington et al. 1992; Goldman et al. 1998; Bustamante et al. 2000; Choi et al. 2006; Conant and Stadler 2009) that residues buried in a protein's core are more likely to remain conserved during evolution than their solvent-exposed counterparts. Debate exists as to how this behavior scales to the level of whole proteins (Bloom et al. 2006; Lin et al. 2007). Whole-protein studies considering solvent accessibility often classify residues as simply “buried” or “exposed” (using geometric analysis or predictive methods). Bustamante et al. (2000) warned that such a scheme may be too simplistic. Using a small data set of bacterial proteins, they were able to demonstrate that evolutionary rate might scale in a continuous, positive manner with residue solvent accessibility. Here, we explore residue-level structural correlates of evolution in the context of a large data set of homology-mapped yeast protein structures. We consider several structural properties of the residue microenvironment, such as solvent accessibility (Lee and Richards 1971), density and uniformity of residue–residue packing (Hamelryck 2005), and burial depth relative to the protein's molecular surface (Chakravarty and Varadarajan 1999). We correlate these properties with measures of residue evolution, allowing us to identify and describe in detail the key dimensions of structural constraint at the residue level. We find that physical constraint on residue evolution is multidimensional, including a major solvent exposure component, and a weak packing density component. Furthermore, the relationship between solvent exposure and selective constraint is strong and linear across its parameter range.
Although we expect evolutionary trends with a biophysical basis to be highly general, we do not expect them to be context-free. We investigate two specific contexts, protein-core size and protein–protein interface involvement, highlighting their effects on general structure–evolution relationships and the biological significance therein. Increasing core size has little effect on evolutionary rate among solvent-excluded residues but yields a more rapid relaxation of constraint as solvent exposure increases. Our analysis provides a natural, residue-level explanation for the counterintuitive dependence of whole-protein evolution on core size. The interface involvement context yields an even more surprising result. Like the evolutionary distinction between buried and exposed residues, the unique functional constraints on interfacial residues were first identified several decades ago (Dickerson 1971). This result has been reexplored recently, with assessments of those constraints varying depending on the data set considered (Valdar and Thornton 2001; Caffrey et al. 2004; Choi et al. 2006). Interaction dynamics have also been revealed as an important variable in the evolution of protein–protein interactions, with constitutive interfaces evolving more slowly than transient ones (Mintseris and Weng 2005). We quantify interface involvement at the residue level and then contrast its evolutionary effects with those of residue burial. We find that selective constraint associated with interface involvement is composed of two fundamentally different yet separable forces: continuous structural constraint that scales with total residue burial and a fixed functional constraint associated with any degree of interface involvement. Investigation into the causal forces underlying these observations leads to an improved understanding of molecular evolution at both the residue- and whole-protein levels.
Materials and Methods
Structural Homology Mapping
We performed gapped Blast (Altschul et al. 1997) searches under default settings between 122,482 structure subunit sequences from the Protein Data Bank (Berman et al. 2000) and a database built from 5,858 translated open reading frames (ORFs) of the yeast Saccharomyces cerevisiae (Cherry et al. 1998). For each structure subunit, we formed an “ORF–subunit pair” with the ORF whose alignment produced the best (lowest) alignment E-value. We then kept those ORF–subunit pairs in which both the subunit sequence and the ORF had high coverage (≥70%) in the alignment. This insures 1) that there is little extra structure in the subunit not present in the yeast protein, and 2) that the majority of the yeast protein is represented. We found that 962 ORF–subunit pairs met these initial conditions. Of these, 24 were discarded due to inconsistencies (e.g., insufficient atomic detail). Of the remaining 938 structures, 160 were annotated as yeast protein structures—all other mappings therefore result from between species homology.
In order to explore protein–protein interface involvement, we filtered the structural complexes from which the optimal ORF–subunit pairs were derived, keeping additional ORF–subunit pairs within the complex which 1) met our basic alignment criteria above, 2) were in physical contact with the optimal ORF–subunit pair, and 3) were reported as interacting with the optimal ORF–subunit pair by at least one physical experiment in BioGRID (Stark et al. 2006). We found that 254 optimal ORF–subunit pairs were costructured with additional ORF–subunit pairs matching these conditions. The additional pairs were only used in the definition of protein–protein interfaces—their residues are not included in calculations of evolutionary statistics. Although we are confident that the interfaces we have studied are largely real, our interface mapping is by no means exhaustive. Thus, on average, we will tend to underestimate interface involvement. Optimal ORF-subunit pairs and interacting subunits are listed in supplementary table 1 (supplemental material online).
Calculation of Biophysical Properties
Table 1 provides basic definitions of the seven properties that we considered. Solvent accessible surface area (SASA) was calculated using MSMS (Sanner et al. 1996) with hydrogen atoms excluded. SASA values were normalized to the 99th percentile within each residue type to produce relative solvent accessibility (RSA); outliers were set to 100% RSA. This approach compensates for the exclusion of hydrogen atoms and allows us to focus on empirically observed RSA distributions. Coordination number (CN) and half-sphere exposures (HSEβu and HSEβd) were calculated using the algorithms described in Hamelryck (2005). Residue–residue contacts (RRC) were calculated as described in Bloom et al. (2006). Atomic contact density (ACD) is based on the atom-residue contact definition from Bloom et al. (2006); this value is normalized in the same manner as RSA. Residue depth (RD) was calculated by triangulating the surface of a protein with MSMS and then calculating the average distance from the nonhydrogen atoms in each residue to the closest surface vertex.
Structural Properties of the Residue Microenvironment
| Symbol | Residue Property | Description |
| RSA | Relative solvent accessibility | The area traced by the center of a solvent molecule (1.4-Å sphere) while in contact with the residue's molecular surface, divided by the maximum such area observed across all residues of that type (hydrogen atoms and outlier residues excluded). See figure 1b for illustration. |
| CN | Coordination number | The number of α-carbons within a 13-Å radius of the residue's own α-carbon. This “coordination sphere” is subdivided by HSEβu and HSEβd. |
| HSEβu | Up half-sphere exposure | The number of α-carbons in a 13-Å radius half-sphere normal to and containing the residue's Cα–Cβ bond axis; Cα–pseudoCβ axis in the case of glycine residues. |
| HSEβd | Down half-sphere exposure | The number of α-carbons in a 13 Å radius half-sphere normal to and opposite the residue's Cα–Cβ bond axis; Cα-pseudoCβ axis in the case of glycine residues. |
| RRC | Residue–residue contacts | The number of nonpolypeptide adjacent residues with at least one nonhydrogen atom within a 4.5-Å radius of some nonhydrogen atom in the residue of interest. |
| ACD | Atomic contact density | The number of nonhydrogen atoms within a 4.5 Å radius of some nonhydrogen atom in the residue, normalized by residue size. |
| RD | Residue depth | The average minimum distance from a nonhydrogen atom in the residue to the molecular surface of its parent protein; measured in Å. |
See the Materials and Methods section for additional details of property calculation.
Evolutionary Sequence Analysis
We generated alignments between 1) a translated ORF from S. cerevisiae, 2) the sequence of its mapped protein structure subunit, and 3) orthologous translated ORFs from Saccharomyces paradoxus, Saccharomyces mikatae, and Saccharomyces bayanus (Cherry et al. 1998) using ClustalW (Chenna et al. 2003). Orthology assignments were based on the findings of Wapinski et al. (2007). We reconstructed the codon alignments between the four genomic yeast sequences using the protein alignments as guides. We then concatenated codons within each yeast species according to the shared properties of their aligned structure positions. Alignments representing less than 100 residues were discarded. We calculated dN/dS over multiple sequence alignments using the program codeml within the PAML software package (Yang 1997). As our four yeast species are closely related, we opted to consider a single dN/dS value for the entire tree, which we specified as ([S. cerevisiae, S. paradoxus], S. mikatae, S. bayanus) following previous work (Wall et al. 2005). Standard errors for dN/dS measurements were also generated. Other parameters in codeml were left to their default values.
Statistical Analysis
Correlations reported in table 2 are standard or partial Pearson correlations (r). In light of the nonnormal distribution of the structural and evolutionary data, significance was determined from 100 rounds of randomizing permutation and recalculation.
Correlations between Structural Properties and Residue Substitution
| Correlation with RSA | Correlation with Substitution | Correlation with Substitution, Given RSA = 0 | Partial Correlation with Substitution, RSA Controlled | |
| RSA | n/a | 0.126 | n/a | n/a |
| CN | −0.767 | −0.118 | −0.042 | −0.039 |
| HSEβd | −0.340 | −0.055 | −0.029 | −0.018 |
| HSEβu | −0.777 | −0.117 | −0.035 | −0.032 |
| RRC | −0.815 | −0.105 | −0.021 | −0.008 |
| ACD | −0.721 | −0.096 | −0.046 | −0.009 |
| RD | −0.577 | −0.076 | −0.000 P>0.05 | −0.004 P<0.05 |
| Residues | 298,972 | 271,266 | 41,807 | 271,266 |
Values are significant at the P < 0.01 level unless otherwise noted.
Lines were fit to dN/dS versus physical parameter plots following the procedure outlined in Press et al. (2007). This procedure represents a modification to the standard least-squares regression that takes into account the error associated with each sequence bin. One advantage of this approach is that sequence bins with small dN/dS estimation errors receive greater weight in the line fitting process. This procedure also reports a variance for the slope and intercept of the resulting linear fit, allowing us to compare parameters between trends and assess the significance of their differences.
Results
Solvent Exposure Is a Major Structural Constraint on Residue Evolution
We assembled a data set of homology-mapped single-chain structures for 938 proteins in S. cerevisiae, containing slightly less than 300,000 residues. For each residue in each structure, we computed seven structural properties (summarized in table 1). With the exception of ACD, these properties have all been described elsewhere, but not necessarily as potential determinants of residue-level evolution. These properties are related in the sense that they all assess the degree of physical constraint imposed on a residue by its microenvironment. No two properties share a Pearson correlation coefficient greater than 0.9 (e.g., table 2, column 1), and we therefore reason that each has the potential to convey some amount of independent information. To assess the evolutionary constraint imposed on a residue by each property, we first identified positions exhibiting a substitution in any of three closely related yeast species. We then correlated residue physical property values with their evolutionary states (0 for conserved, 1 for variable) over 271,266 total positions aligned between a structure and four closely related yeast species. All of the correlations are statistically significant (see table 2, column 2). The most significant correlation belongs to RSA (r = 0.126); this correlation is positive, indicating that mutations more accessible to the solvent are progressively more likely to become fixed. Correlations with certain packing-related properties are close behind in strength (e.g., CN, at r = −0.118); here, the correlations are negative, indicating that mutations in more tightly packed residues are less likely to become fixed. We discuss these correlations further in the next section.
Local Packing Imposes a Weak, Independent Selective Constraint
Correlations between the non-RSA properties and residue substitution are no doubt influenced (and potentially explained) by their individual correlations with RSA. As an initial test of this hypothesis, we restricted the analysis of the non-RSA properties to residues where RSA = 0 (i.e., those residues that are completely buried from a solvent accessibility standpoint). We found that 41,807 aligned residues fall into this category (15%). Among these residues, the correlations between the five measures of residue packing (CN, HSEβu, HSEβd, RRC, and ACD) and substitution are still negative and significant (P < 0.01), although weaker than before (e.g., the CN correlation coefficient drops to −0.042; see table 2, column 3). As additional evidence, we report the partial correlation for each property with the effects of RSA averaged out; these values are consistent with our findings from the RSA = 0 special case (table 2, column 4). We conclude that the extent of residue packing imposes an independent, although minor dimension of evolutionary pressure on a residue. This is consistent with our basic intuition: A residue that is tightly packed with its neighbors may participate in many stabilizing interactions and thus have limited freedom for substitution. The weakened independent significance of these correlations suggests that any added pressure is small relative to the large relaxation of selective constraint associated with proximity to the protein surface (best measured by RSA). We find that RD is not significantly correlated with substitution beyond the outermost layers of the protein (P > 0.05).
CN is particularly interesting: Not only is this a very simple statistic to calculate (requiring only an α-carbon model of a protein and simple distance calculation) but also it appears to measure both the solvent accessibility- and packing-dependent components of selective constraint. CN is based on a spherical “neighborhood” that surrounds a residue. We can conceptually divide this sphere into two hemispheres: one on the same side as the residue side chain and another on the opposite side (Hamelryck 2005). The number of neighboring α-carbons in the side chain–containing hemisphere (HSEβu) is a stronger correlate of substitution than the number in the opposite hemisphere (HSEβd; r = −0.117 vs. −0.055). In line with expectation, this indicates that the more significant “neighborhood” within a residue's microenvironment is the one containing the residue's side chain.
Logistic Regression Integrates Residue Properties for Substitution Prediction
To further explore the independent significance of various residue properties, we used logistic regression to combine their predictive power in the classification of substituted and conserved residues. Logistic regression is a natural choice in this situation as our goal is to predict a binary class label (substituted or conserved) by integrating a set of heterogeneous, and potentially related, features. We considered all residues exhibiting substitutions from the previous analysis and a random subset of equal size from the conserved residues. Using 5-fold cross validation, the logistic regression classifier was trained and tested using one or more residue properties. Predictive power is limited by the fact that conserved residues (negatives) may in fact be free to mutate and go to fixation but simply have not yet done so in recent evolution (this is also a limiting influence on the substitution correlations discussed above; see table 2). It is therefore best to focus on the relative predictive strengths of the different properties and not their absolute performance.
Because we are using a balanced data set, a random classifier produces correct predictions exactly 50.0% of the time. When trained on RSA only, the classifier correctly predicts substituted versus conserved residues 60.0% of the time. When all structural properties are considered together, correct classification is boosted slightly to 60.4%. These numbers agree with our previous conclusions: 1) RSA is a major structural feature for predicting residue substitutions, and 2) any contributions made by the other related properties are minor. Bootstrap resampling analysis of correct classification rates reveals at most a 0.5% range for the values discussed here, and so the gain from structural feature integration may be insignificant.
We next compared the predictions based on these extrinsic (microenvironmental) residue properties with those based on intrinsic properties such as hydrophobicity and size. We represent these intrinsic properties collectively using residue (amino acid) type in S. cerevisiae, which can be readily incorporated in logistic regression-based predictions. By themselves, intrinsic properties correctly classify residues as substituted or conserved 58.1% of the time. When we combine these intrinsic properties with extrinsic physical properties (such as RSA), the correct classification rate improves to 62.6%, a significant increase (4.5%) relative to the errors in individual correct classification rates. We conclude that intrinsic and extrinsic properties of residues make partially independent contributions to selective constraint.
Microenvironmental properties constitute one class of extrinsic properties that influence residue evolution. It is also possible to consider larger scale extrinsic properties, such as the average degree of solvent exposure for a residue's parent protein (which scales inversely with protein-core size). Although this property has been proposed as a structural correlate of protein evolution (Bloom et al. 2006; Lin et al. 2007), it proved to be a poor predictor of single residue substitutions (yielding 51.7% correct classification, only slightly better than random). We next considered parent protein abundance level in the cell, using S. cerevisiae codon adaptation index as a proxy (Sharp and Li 1987). Abundance is a dominant correlate of evolutionary rate at the protein level (Drummond et al. 2006) and produced reasonable predictions of substitution at the residue level (58.3% correct). When combined with residue physical properties, we again observed significantly improved substitution prediction (63.0% correct), suggesting that extrinsic properties of different types and on different scales may both influence selective constraint at the residue level. We return to this idea in our discussion of physical and biological protein contexts in later sections.
Evolutionary Rate Scales Linearly with RSA
We next sought to investigate the functional relationship between the most significant determinant of residue evolution that we observed (i.e., degree of burial) and a continuous measure of evolutionary rate, dN/dS. dN/dS compares the rate of amino acid changing substitutions (dN) with the rate of silent substitutions (dS) at the DNA level; the former is presumed to be selectable, whereas the latter is not (thus acting as a normalization factor). We used RSA as our measure of burial, as it was the best single predictor of residue substitutions that we considered and is easy to interpret.
We binned residues in 5% intervals over the range of possible RSA values; dN/dS was then calculated for the residues in each bin by concatenating the aligned codons of S. cerevisiae and three other closely related yeast species. We observe a clear increase in dN/dS as RSA increases (see fig. 2a). The fact that this relationship is continuous and positive is in agreement with the conclusions of Bustamante et al. (2000). By virtue of our large sequence-structure data set, we are able to show here that the relationship between evolutionary rate and burial is strong and linear over the full range of RSA values. Taking into account the different dN/dS estimation errors associated with each RSA bin, we generated a least-squares regression line with correlation coefficient r = 0.996 (fig. 2a). The slope of this regression line is 0.101, which indicates that a 1% increase in RSA is associated with a dN/dS increase of approximately 0.001 (i.e., one extra amino acid substitution for every 1,000 silent mutations). This is a small incremental effect, but it becomes significant when considering larger differences in RSA. Indeed, the most exposed residues are evolving three times faster than their completely buried counterparts. Previous empirical and theoretical work points to a direct relationship between residue burial and protein stability (Zhou and Zhou 2004). Our findings are therefore consistent with the idea that protein stability and organism fitness are intimately connected (DePristo et al. 2005). In order to demonstrate that this global trend is not the result of variation in amino acid composition across the RSA bins, we regenerated the trend restricted to hydrophobic residues (fig. 2b) and hydrophilic residues (fig. 2c) based on the Kyte–Doolittle definitions (Kyte and Doolittle 1982). In both cases, the trend is similar to the original trend, implying a major role for residue burial in determining evolutionary rate that is independent of residue type. We further demonstrate that this global trend is not the result of variation in codon bias across the RSA bins by restricting the analysis to residues derived from preferred codons (Kliman et al. 2003); see supplementary figure 1, Supplementary Material online.
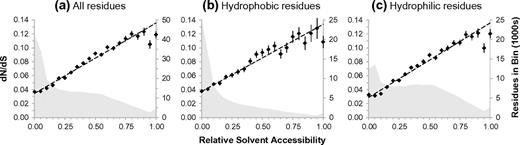
Correlating RSA and evolutionary rate. (a) Yeast codons are binned according to the RSA values of their associated residues; dN/dS is then calculated. The distribution of residues across the bins is shown in the background (right vertical axis). (b) The trend and distribution from (a) restricted to hydrophobic residues. (c) The trend and distribution from (a) restricted to hydrophilic residues.
We observed a tendency for residues to deviate negatively from the linear trend at high values of solvent exposure. This effect persists when using different solvent mapping programs (Kabsch and Sander 1983; Edelsbrunner and Koehl 2003) and when varying the solvent radius (to compensate for ignoring hydrogen atoms). A negative rate deviation could conceivably result from a counteracting selective constraint on highly exposed residues. However, a more likely explanation is that residues in the highest RSA bins are contaminated by overestimates of RSA (e.g., due to structural errors from residue motion). Although overestimates may occur in any bin, the highest RSA bins have fewer errors of under estimation, which would otherwise help to average out the total error. A related positive deviation might be expected in the highly buried bins, although their massive residue populations likely limit its effect. Another possible explanation is that some of these highly exposed residues are involved in protein–protein interfaces. Because all structural properties discussed so far are calculated for single chains in isolation, such residues tend to have higher computed RSA than expected from their evolutionary rates. The effect of protein–protein interaction on residue evolution will be studied in detail in later sections.
The correlation procedure employed here was helpful for identifying the general relationship between solvent accessibility and dN/dS. In search of this generality, we have thus far ignored the existence of global biological variables or physical parameters (“contexts”) that may systematically change the behavior of structure–evolution correlations. There are many such contexts that one could consider; in the following sections we explore the effects of two key contexts: protein-core size and burial in protein–protein interfaces.
Structure–Evolution Relationships Are Sensitive to Protein-Core Size
The effect of protein-core size on protein evolution has been studied by multiple groups, resulting in debate as to its mechanisms and significance (Bloom et al. 2006; Lin et al. 2007; Zhou et al. 2008). Here, we study the effects of protein-core size (a global physical context) on evolution at the residue level. We estimated protein-core size by first averaging over the RSA of each residue in a protein, and then ranking the proteins based on these averages. The top third of the proteins (those with high average RSA) were designated as small core, and the bottom third of the proteins (those with low average RSA) were designated as large core. We then correlated dN/dS with RSA for residues taken from large-core proteins and for residues taken from small-core proteins (fig. 3). We find that for completely buried residues (RSA = 0), evolutionary rate is similar in the small- and large-core protein contexts. Beyond this point, the trends in evolutionary rate begin to separate, such that (for a given RSA value) residues in large-core proteins are always evolving faster than those in small-core proteins. This difference in slope between the two lines is highly significant (t-test, P < 0.01). It has been previously suggested that large-core proteins, by virtue of their enhanced thermodynamic stability, have a greater tolerance for accumulated mutations (Bloom et al. 2006). Our results indicate that this tolerance scales with residue exposure, rather than increasing uniformly throughout the protein. Completely buried residues show little added tolerance to mutations with increasing core size, suggesting that they are universally critical to protein stability (and by extension, fitness).
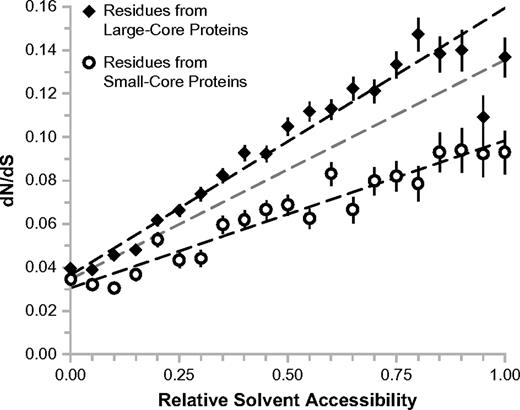
Context sensitivity of the structure–evolution relationship: protein-core size. The trend between RSA and evolutionary rate is regenerated for residues from large-core proteins (closed diamonds), and for residues from small-core proteins (open circles). The linear trend over all residues from figure 2a is shown in gray for reference.
The thermodynamic stability hypothesis has been used to justify an observed increase in whole-protein evolutionary rate with increasing core size (Bloom et al. 2006; Zhou et al. 2008). This claim seems initially counterintuitive, as large-core proteins contain more slowly evolving buried residues. The trends illustrated in figure 3 provide clarification: It is entirely possible for a large-core protein to have lower average RSA while also experiencing a higher overall evolutionary rate, provided that the increase in the rate at which dN/dS scales with RSA compensates for dN/dS decrease due to reduced average RSA. Indeed, we find that large-core proteins (average RSA = 0.269, average dN/dS = 0.065) have lower average RSA but higher average evolutionary rate than small-core proteins (average RSA = 0.399, average dN/dS = 0.056) over our data set.
Interfacial Burial Is Subject to Additional All-or-Nothing Selective Constraint
Like burial in a protein core, burial in a protein–protein interface is known to impose evolutionary constraint on a residue. Here, we investigate how this constraint scales with quantitative degree of burial in a protein–protein interface (“interface involvement”). More specifically, we are interested to know if the additional evolutionary constraint on interfacial residues can be explained solely in terms of an increase in total residue burial, subject to the general trend between burial and dN/dS from figure 2a. We defined degree of interface involvement as the change in residue burial as its parent protein transitions from a free-floating to cocomplexed state (reported as the difference in RSA between the two states, ΔRSA). Refer to the Materials and Methods section for a discussion of protein complex reconstruction.
We binned residues from proteins with mapped interaction partners according to degree of interface involvement and calculated dN/dS for each bin (fig. 4). Note that even among these proteins, the vast majority of residues fall into the noninterfacial (ΔRSA = 0) bin. This bin, marked by an “X” in figure 4, has a corresponding dN/dS value of 0.060. In contrast, the bin containing residues with the smallest nonzero interface involvement (0 < ΔRSA ≤ 0.05) has a dN/dS value of 0.044. The standard errors for this bin and the noninterfacial bin are small (0.003 and 0.001, respectively), suggesting that there is a significant drop in evolutionary rate associated with nonzero interface participation. As interface participation increases, we observe a trend toward progressively smaller dN/dS values (correlation coefficient r = −0.612). Both of these facts are consistent with the notion that interfacial residues are under increased selective constraint. Surprisingly, this constraint is quite strong even for residues with minimal interface involvement.
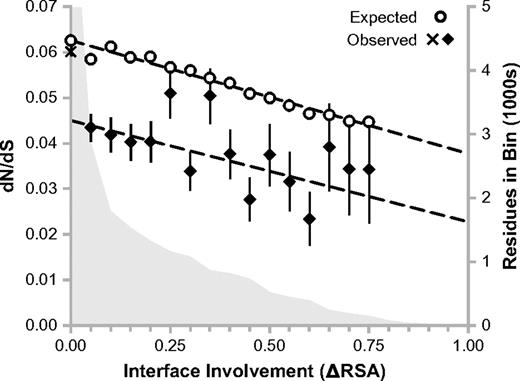
Context sensitivity of the structure–evolution relationship: interface involvement. Residues from proteins with mapped interfaces are binned according to their changes in RSA upon cocomplex formation (interface involvement, ΔRSA). The “X” represents the noninterfacial bin (ΔRSA = 0), whereas all other bins are represented by closed diamonds. Open circles represent expected dN/dS values assuming selective equivalence between buried and interfacial surface area. The distribution of residues across the bins is shown in the background (right vertical axis). There are 56,943 residues in the noninterfacial bin.
If interface involvement and residue burial are selectively equivalent, then the observed dN/dS values from figure 4 would depend only on total residue burial (1-RSA) in the cocomplexed state. Operating under this assumption, we calculated expected dN/dS values for each ΔRSA bin by 1) determining the average RSA for its residues in the cocomplexed state, and then 2) predicting dN/dS from the dN/dS versus RSA trend in figure 2a. This gives the open circles in figure 4. Expected dN/dS values decrease gradually for residues of greater interface involvement, as such residues tend to have larger total burial. The observed and expected dN/dS trends should agree with each other if interface involvement and residue burial are selectively equivalent. This is true for noninterfacial residues (ΔRSA = 0), where the expected dN/dS value 0.063 is quite close to the observed value 0.060, indicating that noninterfacial residues in interacting proteins are similar to residues in other proteins in terms of average evolutionary rate (this small difference could easily be due to error in the line fitting used to predict dN/dS). As we transition to bins with nonzero interface participation, the observed dN/dS values experience a sharp drop (as discussed above) but the expected values do not. Excluding the noninterfacial bins, a comparison of the best fit lines for the expected and observed trends reveals a highly significant difference in the two intercepts (t-test, P < 0.01). This leads to the surprising conclusion that all interfacial residues are subject to a fixed functional constraint that is independent of their quantitative degree of interface involvement. On the other hand, the slopes of the observed and expected dN/dS trends are not statistically different (t-test, P > 0.05). This suggests that, beyond the all-or-nothing functional selective constraint on interface involvement, there exists additional physical selective constraint on degree of interface involvement that is quantitatively similar to residue burial.
In summary, two residues may be similarly buried from a solvent accessibility standpoint, but if one resides in a protein–protein interface, then it will evolve much more slowly. Hence, interface involvement is a biological context with a powerful effect on the general structure–evolution relationship.
Discussion
The fixation and elimination of single residue mutations are central forces in protein evolution. Knowledge of the influencing factors at this most basic level is therefore a prerequisite for understanding higher level evolutionary phenomena. Here, we have explored relationships between structural properties of the residue microenvironment and residue evolution, updating known ideas in this area and introducing several new ones. We confirmed that solvent exposure is a major predictor of accepted residue mutations; this property is logically measured by RSA, but simple properties like CN also do very well. Controlling for solvent exposure revealed an additional, weak constraint: density of residue packing. This seems to be the only selective distinction among residues in the solvent-excluded core of a protein. The precise relationship between solvent accessibility and evolutionary rate (dN/dS) was revealed to be strong, positive, and linear. This result reinforces the idea that residue burial is not simply a binary attribute, but rather a continuous property with quantitative consequences for organism fitness. Previous work points to the maintenance of protein stability as a likely intermediary between these two variables.
Our logistic regression analysis highlighted the independent significance of a residue's microenvironment (relative to intrinsic properties) in the shaping of its evolutionary potential. Furthermore, our investigation into context sensitivity in structure–evolution relationships revealed the significant effects of global protein properties on residue-level evolution. For example, we showed that selective constraint relaxes more rapidly with increasing solvent exposure for residues in large-core proteins, a global physical context. This is likely a consequence of increased thermodynamic stability with increasing protein-core size. Evolutionary rate among solvent-excluded residues remained consistently low, suggesting that these residues are universally important to protein stability. We next explored quantitative degree of residue burial in protein–protein interfaces, a global biological context. The most striking observation here is a marked drop in evolutionary rate associated with any degree of interface involvement. Residues with a larger degree of interface involvement were found to be progressively more constrained; this argues for the existence of an associated structural selective constraint that is quantitatively similar to general residue burial. These observations highlight the fundamental evolutionary distinction between all-or-nothing functional constraints and continuously varying physical constraints. Surprisingly, total constraint on interfacial residues is on average at least as great as that acting on solvent-excluded core residues; this may have significant ramifications for structure-based studies of protein evolution that fail to consider protein–protein interfaces.
Because the set of solved protein structures is small relative to the set of known protein sequences, homology mapping played a central role in the analyses performed here. Although this procedure is obviously advantageous for constructing a large sequence-structure data set, there are several caveats to keep in mind. The set of available structures is still a limiting reagent. Consequently, the majority of yeast ORFs cannot be paired with a homologous structure. This will tend to bias our data set and results toward easily structured and often well-ordered proteins. We further assume that differences at the sequence level among close homologs do not produce measurable differences at the structure level. This potential error is compounded when we align yeast orthologs to the same structure. Even when the sequence-structure alignment is perfect, we cannot be sure that a given structure accurately conveys the in vivo properties of its residues. Nevertheless, we believe that homology mapping is still the best existing method for integrating structural details into evolutionary genomics applications; this method will only improve as the space of known structures grows in the years to come. Here, we have presented several strong relationships between residue-level structural properties and evolutionary rate. These results speak to the success of homology-based methods and contribute to an improved understanding of the role that structure plays in protein evolution.
Funding
National Science Foundation Integrative Graduate Education and Research Traineeship (DGE-0654108) to E.F.
References
Author notes
Jeffrey Thorne, Associate Editor
