


Abstract
Whether phenotypic evolution proceeds predominantly through changes in regulatory sequences is a controversial issue in evolutionary genetics. Ample evidence indicates that the evolution of gene regulatory networks via changes in cis-regulatory sequences is an important determinant of phenotypic diversity. However, recent experimental work suggests that the role of transcription factor (TF) divergence in developmental evolution may be underestimated. In order to help understand what levels of constraints are acting on the coding sequence of developmental regulatory genes, evolutionary rates were investigated among 48 TFs required for neuronal development in Caenorhabditis elegans. Allelic variation was then sampled for 28 of these genes within a population of the related species Caenorhabditis remanei. Neuronal TFs are more divergent, both within and between species, than structural genes. TFs affecting different neuronal classes are under different levels of selective constraints. The regulatory genes controlling the differentiation of chemosensory neurons evolve particularly fast and exhibit higher levels of within- and between-species nucleotide variation than TFs required for the development of several neuronal classes and TFs required for motorneuron differentiation. The TFs affecting chemosensory neuron development are also more divergent than chemosensory genes expressed in the neurons they differentiate. These results illustrate that TFs are not as highly constrained as commonly thought and suggest that the role of divergence in developmental regulatory genes during the evolution of gene regulatory networks requires further attention.
Introduction
The diversity of animal form has been a topic of interest to naturalists long before Darwin, but it is only with the pioneering work on Drosophila development that the genetic mechanisms responsible for generating morphological diversity could be approached (Lewis 1978; Nüsslein-Volhard and Wieschaus 1980; Nüsslein-Volhard et al. 1984). Perhaps one of the most fascinating results that followed is that animal development relies on a set of genes (i.e., cell adhesion proteins, signaling proteins, and transcription factors, TFs) belonging to gene families that are broadly shared across animal phylogeny and that diversified early in metazoan evolution (Technau et al. 2005; Guder et al. 2006; Nichols et al. 2006; Matus et al. 2007). The conservation of this shared genetic toolkit, although fascinating in its own right, raises the question of how the diversity of forms observed in the animal kingdom arises in the first place. A growing body of evidence indicates that the redeployment of these toolkit genes within gene regulatory networks, through evolution of regulatory sequences, is an important driver of morphological changes at various taxonomical scales (Carroll et al. 2005).
Whether phenotypic evolution proceeds predominantly through changes in regulatory sequences or changes in protein sequences has ignited an intense debate, with the argument in favor of the cis-regulatory hypothesis focusing on the prediction of strong conservation of TF function (Carroll 2005, 2008; Hoekstra and Coyne 2007; Wray 2007; Stern and Orgogozo 2008). Nonetheless, recent findings from cross-species gene-swapping experiments indicate that functional equivalence between distant TF orthologs is only partial or nonexistent (Hsia and McGinnis 2003). Moreover, changes in TF coding sequence can result in profound modifications of body plan (Galant and Carroll 2002; Ronshaugen et al. 2002). A major assumption underlying arguments against a substantial role for TF sequence evolution is that mutations in the coding sequence of highly pleiotropic genes are likely to be deleterious and thus selected against. This notion is supported by a negative correlation between nonsynonymous substitution rate and gene expression breadth (Duret and Mouchiroud 2000), although this relationship can suffer from the specifics of particular gene family function (Jovelin and Phillips 2005). However, in recent reviews, Wagner and Lynch report that contrary to common belief, about a third of human TFs are tissue specific. They also argue that the negative pleiotropic effect of mutations can be reduced by structural protein motifs and alternative splicing that make TFs highly modular. Moreover, the combinatorial mode of action of TFs can result in tissue-specific novel functions by establishing new interactions with cofactors or other TFs restricted to tissues in which all partners are expressed (Lynch and Wagner 2008; Wagner and Lynch 2008). Therefore, it seems that the contribution of TF sequence divergence to the evolution of gene regulatory networks may have been underestimated.
One way to address the levels of constraints among TFs has been to compare TFs with non-TF genes, which has revealed high rates of sequence evolution among the regulatory genes (e.g., Clark et al. 2007; Haerty et al. 2008). Nevertheless, a better understanding of TF sequence evolution requires that we quantify the level of segregating variation within populations at TF loci so as to infer selective pressures and ultimately to examine the functional effects of naturally occurring allelic variation and sequence divergence among orthologs. Early studies of intraspecific nucleotide variation in Drosophila have revealed that regulatory genes tend to be less polymorphic than structural genes (Moriyama and Powell 1996). By contrast, analysis of olfactory pathways in Caenorhabditis showed that developmental regulatory genes exhibit more between- and within-species variation than structural chemosensory genes (Jovelin et al. 2009). Nonetheless, these studies included a limited number of TFs. In this study, I test the assumption that TF sequence evolution is highly constrained by investigating the levels of segregating variation in natural populations and divergence between species for a large set of TFs required for neuronal development in Caenorhabditis elegans.
The hermaphrodite adult of the nematode C. elegans has 302 neurons that are generated in a stereotypical manner such that wild-type individuals have the same number of neurons (White et al. 1986). Neurons acquire their identity through specific patterns of migration, axonal growth, synaptic connectivity, morphology, and unique expression of neurotransmitters and gene batteries. Mutants affecting all aspects of neuron development have been identified, although most known mutants affect only some aspects of terminal differentiation. A large number of mutations are found in TFs that act cell autonomously in neuron differentiation (Hobert 2005). Neuron identity is determined by three genetic programs. Generic features common to all neuron types are specified by panneuronal TFs that act in parallel to terminal selector genes that directly coregulate the expression of terminal gene batteries, thereby differentiating neuron types. These terminal selector genes can also regulate terminal differentiation genes through the control of downstream TFs, thus further diversifying neuron types into subtypes (Hobert 2005, 2008).
Here, I analyze sequence divergence among 48 TFs required for neuron differentiation in C. elegans in order to investigate the relationship between evolutionary rates and gene function. Among these TFs, I sampled allelic variation within one population of the related species Caenorhabditis remanei for the nearly full length of the coding sequence of 28 loci required for the differentiation of several classes of neurons. Caenorhabditis remanei is better suited for this analysis because of substantially higher levels of nucleotide diversity within this species than within C. elegans (Graustein et al. 2002; Jovelin et al. 2003, 2009; Barrière and Félix 2005; Cutter et al. 2006). I show that neuronal TF coding sequences exhibit more nonsynonymous polymorphism than the coding sequences of structural genes. Neuronal TFs with distinct functions seem to be under different levels of selective constraints. TFs controlling chemosensory neuron differentiation exhibit both more nonsynonymous polymorphism and amino acid replacement divergence than TFs controlling motorneuron differentiation. The former also accumulate higher levels of within- and between-species nucleotide diversity than TFs required for the development of several classes of neurons. Finally, TFs controlling chemosensory neuron differentiation are more divergent than structural chemosensory genes. These findings illustrate that, contrary to common belief, TFs can harbor high levels of amino acid divergence both within and between species.
Materials and Methods
Ortholog Identification
The set of 48 TFs required for neuron fate determination was obtained through a literature search and from two reviews (Hobert 2005; Von Stetina et al. 2006). The identity of the neuronal cells affected by loss of function mutation in each locus is listed in table 1. Although most of these TFs have roles restricted to nervous system differentiation, some of them (17/48) also play a role in the regulation of nonneuronal tissues. These TFs are unc-130, egl-5, egl-43, ham-2, sem-4, ceh-14, lin-11, cog-1, die-1, vab-7, unc-55, mab-5, mab-18, lin-39, fozi-1, lin-14, and ref-1 (Chisholm 1991; Ahringer 1996; Euling and Ambros 1996; Baum et al. 1999; Eisenmann and Kim 2000; Grant et al. 2000; Nash et al. 2000; Alper and Kenyon 2001; Heid et al. 2001; Gupta et al. 2003; Bando et al. 2005; Inoue et al. 2005; Amin et al. 2007; Fernandes and Sternberg 2007; Guerry et al. 2007; Hwang et al. 2007; Rimann and Hajnal 2007; Shan and Walthall 2008).
Neurons Affected by Loss of Function Mutations in Caenorhabditis elegans TFs
Phenotypes are not necessarily 100% penetrant. Functional classes were obtained from WormAtlas (www.wormatlas.org).
Neurons Affected by Loss of Function Mutations in Caenorhabditis elegans TFs
Phenotypes are not necessarily 100% penetrant. Functional classes were obtained from WormAtlas (www.wormatlas.org).
The list of 54 structural genes expressed in chemosensory neurons (Bargmann 2006) and known to affect chemotaxis was obtained from Wormbase (Rogers et al. 2008). Sequences of the C. remanei alleles corresponding to the 37 structural and putatively X-linked loci (Cutter 2008) were obtained from Genbank (Benson et al. 2008). Strain PB249 has a premature stop codon in Cre-F47A4.5 at position 2959 and was discarded prior to analyses. Here, a structural gene refers to a non-TF gene. Genes were classified as structural and TF according to gene annotations in Wormbase and by using the set of annotated C. elegans TFs (Reece-Hoyes et al. 2005). A brief description of the function of the genes analyzed is available in supplementary table1, Supplementary Material online.
Blast searches were conducted against the genome assemblies of Caenorhabditis briggsae (Stein et al. 2003), C. remanei, Caenorhabditis brenneri, and Caenorhabditis japonica (Genome Sequencing Center, Washington University, St Louis, unpublished) using the TBlastN program (Altschul et al. 1990). Orthology was confirmed on the basis of amino acid sequence identity and reciprocal Blast best hits. Intron–exon boundaries were identified with respect to the C. elegans sequence and with reference to the open reading frame.
Strains, Amplification, and Sequencing
The C. remanei strains used in this study (PB237, PB241, PB244, PB245, PB247, PB255, PB256, PB257, PB258, PB261, PB263, PB266, PB269, PB271, PB272, and PB285) are derived from one population in Ohio, United States, a gift from Scott Baird, Wright State University, and were maintained following standard C. elegans protocols (Brenner 1974). Worms were found associated with isopods collected under a single log during a 2-week period. Strains were founded either with a single gravid female or with a single virgin female mated to a single male and were subsequently inbred for at least six generations of brother–sister mating to minimize intrastrain nucleotide variability. For each of the 16 C. remanei strains, RNA was extracted from plates containing worms at all stages of development using the TRI Reagent protocol (Molecular Research Center) and subsequently used to synthesize double-stranded cDNA with the Retroscript kit (Ambion). Primers used for amplification of the coding sequence of 28 TFs were designed from the C. remanei genomic sequence. Polymerase chain reactions were processed as described in (Jovelin et al. 2003) using 0.3 μl of TrueStart Taq polymerase (Fermentas) and 1 μl of template cDNA with the following conditions: hot start at 95 °C for 3 min, followed by 35 cycles of 95 °C for 1 min, 55 °C for 1 min and 72 °C for 3 min. For some of the samples, the annealing temperature was 58 °C. Amplifications were gel purified (Qiagen) and sequenced using automated sequencers at the University of Oregon sequencing facility. The primers used for amplification were also used for sequencing, allowing sequences to be confirmed on both strands. Internal primers were also used for sequencing Cre-die-1, Cre-egl-43, and Cre-unc-3. Cre-zag-1 was amplified and sequenced using two sets of primers. All sequence changes were rechecked visually against sequencing chromatograms. After trimming primer sequences, polymorphism data were obtained for 90%, on average, of the coding sequence of the C. remanei genes.
Sequence Analyses
Protein sequences were aligned by eye using BioEdit (Hall 1999) and subsequently used to generate codon-based DNA sequence alignments. Pairwise alignments used to estimate species divergence are available online as Supplementary Material online. Maximum likelihood (ML) estimates of the rates of nonsynonymous (dN) and synonymous (dS) substitutions between the most closely related species C. remanei and C. briggsae (Kiontke et al. 2004) were computed using the program CODEML of the PAML package (Yang 1997), with a codon model assuming equal rate of substitutions among sites but accounting for transition–transversion bias and by removing gap positions (supplementary table1, Supplementary Material online). Codon frequencies are the product of the observed nucleotide frequencies at each codon position. The rate of synonymous changes correcting for selection at silent sites (dS′) (Hirsh et al. 2005) was computed using the regression between the codon adaptation index (CAI) (Sharp and Li 1987) and the rate of synonymous substitutions, dS, from the full gene set (N = 104), including the TFs and chemosensory structural genes. CAI was computed for the C. remanei genes using CAI Calculator (Wu et al. 2005) and with the C. elegans reference gene set defined by Carbone et al. (2003). The rates of radical and conservative nonsynonynmous changes were computed using five classifications of amino acid chemical properties: charge; polarity; volume and polarity; charge and aromatic; charge and polarity (Zhang 2000; Hanada et al. 2006). Within each functional class, changes between amino acid groups are defined as radical and changes within groups are defined as conservative. The proportions of radical and conservative changes were computed according to the method of Zhang (2000) using C. remanei and C. briggsae orthologs and were used to obtain the rates of radical (dR) and conservative (dC) nonsynonymous changes using a Jukes–Cantor approximation (Jukes and Cantor 1969). The transition/transversion rate ratio was estimated by ML with CODEML.
Population genetic analyses including measures of nucleotide diversity (π, Nei 1987) and Tajima's D (Tajima 1989) were performed using DnaSP 4.1 (Rozas et al. 2003). Tajima's D was computed using synonymous sites only, although analyses using all sites gave similar results. Gene trees of the Cre-ceh-37 and Cre-mec-3 sequences were inferred with maximum parsimony using PAUP* 4.0b10 (Swofford 1998) and rooted with the corresponding C. briggsae ortholog. Difference in rate divergence along the branches of the two Cre-ceh-37 paralogs was tested with a likelihood ratio test (LRT) using CODEML and using the gene tree (Kiontke et al. 2004) including ceh-37 sequences from C. japonica, C. elegans, C. brenneri, C. briggsae, and C. remanei.
Results
Identification of Orthologs and Duplicates
For most of the C. elegans genes, a single ortholog could be identified in C. briggsae and C. remanei, with the exception of ceh-37 and mec-3 for which two similar sequences were found on distinct contigs in C. remanei. Reciprocal Blast searches with each of the C. remanei sequences similar to ceh-37 identified a single sequence corresponding to ceh-37. However, because of the level of divergence between the two C. remanei sequences (dN/dS = 0.0932) and because introns are too divergent to be aligned, these sequences are likely to be duplicates of ceh-37 rather than being distinct alleles. Although amplifications of Cre-ceh-37b failed for 5 C. remanei strains, sampling of Cre-ceh-37a and Cre-ceh-37b in a single C. remanei population recovered sequences that form distinct clades (data not shown), further supporting the duplication event of ceh-37 in this species. Previously, we reported the duplication of ceh-36 in C. remanei (Jovelin et al. 2009). The specificity of the duplication of ceh-36 and ceh-37 in the lineage leading to C. remanei is further confirmed as only single orthologs of ceh-36 and ceh-37 were found in the additional species C. brenneri and C. japonica. The two Cre-ceh-37 duplicates have significantly diverged at different rates since the duplication event (Cre-ceh-37a: ω = 0.1608 (ω: dN/dS ratio), Cre-ceh-37b: ω = 0.0317, 2Δl = 10.55, P < 0.01). In C. elegans, ceh-36 and ceh-37 are next to each other on chromosome X, the chromosome with the most conserved synteny between C. elegans and C. briggsae (Hillier et al. 2007), suggesting that Cre-ceh-36 and Cre-ceh-37 paralogs may have resulted from a single duplication event of a fragment of the X chromosome. Unfortunately, the rate of synonymous changes between Cre-ceh-36 (dS = 1.53) and Cre-ceh-37 (dS = 1.2) paralogs, although similar, is too large to be a good indicator of the evolutionary age of the duplicate pairs. However, it is noteworthy that lengthy duplications are rare in C. elegans and that most duplications span less than 2 kb (Katju and Lynch 2003). Blast searches with the two immediate neighbors of ceh-36 and ceh-37 identified a single ortholog in C. remanei, indicating the duplication of a short fragment of the X chromosome or independent duplications of Cre-ceh-36 and Cre-ceh-37.
By contrast, the two C. remanei mec-3 sequences are likely to be alleles of the same locus. First, the two contigs containing mec-3 are highly conserved (95.6% identical). Second, nucleotide diversity estimates across the coding sequence of the two C. remanei mec-3 genomic sequences (π = 13.54 × 10⁻³) and within the Ohio population (π = 19.15 × 10⁻³) are similar. Finally, there is no phylogenetic differentiation between the two mec-3 genomic sequences and mec-3 alleles sampled from the Ohio population (data not shown). The presence of alleles in the genome assembly of C. remanei indicates incomplete inbreeding of the strain EM464 prior to genome sequencing.
Heterozygosity appears to be much higher in the genome assembly of C. brenneri, another dioecious species. Two highly similar sequences (0.03 ≤ dS ≤ 0.18) could be found on different contigs for 31% (15/48) of the TFs in table 1. Although the low dS values could indicate the presence of young duplicates, as found in C. elegans (Lynch and Conery 2000), it is rather likely that these sequences are distinct alleles. Intron boundaries are conserved for each pair of sequences indicating that they are not the result of duplication by retrotransposition. Moreover, no duplication boundary could be detected as the smaller of the two contigs aligned along its entire length to the larger one. The length of the smaller contig ranges from 1.6 to 25.4 kb, and although there are some large insertions/deletions, the contigs are highly similar, between 80% and 97% identical. Heterozygosity in the genome assemblies of C. remanei and C. brenneri has also recently been shown using a different set of genes (Barrière et al. 2009). However, clear duplicates of cnd-1 were found in C. brenneri. A young duplicate, with high sequence similarity but carrying a premature stop codon, is located 2.7 kb downstream of Cbn-cnd-1, with a duplication span of 3.8 kb. An older duplicate (dS = 1.48), which matches C. elegans cnd-1 in reciprocal best Blast search, is located on a distinct contig with no flanking or intronic sequence similarity to Cbn-cnd-1.
TFs Controlling Chemosensory Neuron Differentiation Are More Divergent Than Structural Chemosensory Genes
Somewhat unexpectedly, we previously found that the TFs odr-7 and ceh-36, respectively, required for the differentiation of the AWA and AWC chemosensory neurons, evolve faster than the structural component of olfactory pathways expressed in these two neurons (Jovelin et al. 2009). Is this higher nucleotide rate divergence specific to these two genes or is it a general feature of developmental regulatory genes controlling chemosensory neuron differentiation? To address this issue, I compared the rate of divergence between 54 structural chemosensory genes expressed in 11 chemosensory neurons and 15 TFs required for the differentiation of chemosensory neurons (table 1). Although the rate of synonymous substitution is not different between the two gene sets (dS: Wilcoxon two-sample P = 0.95; dS′: Wilcoxon two-sample P = 0.99), the TFs are on average 1.6 times more divergent than the structural chemosensory genes (rate of nonsynonymous substitutions, dN: Wilcoxon two-sample P = 0.005; dN/ dS: Wilcoxon two-sample P < 0.0001; dN/dS′: Wilcoxon two-sample P < 0.0001) (fig. 1). The higher rate divergence among the TFs is further supported by a LRT showing rate heterogeneity among the structural and developmental regulatory genes (ωTF = 0.0871, ωstructural = 0.0525, 2Δl = 474.07, P < 0.001).
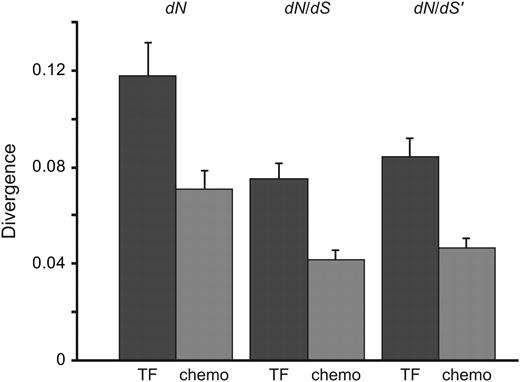
TFs controlling chemosensory neuron differentiation are more divergent than structural chemosensory genes. Comparison of species divergence estimated from Caenorhabditis briggsae and Caenorhabditis remanei between 54 structural chemosensory genes from 11 chemosensory neurons with 15 developmental regulatory genes controlling at least the differentiation of chemosensory neurons. Means are represented with one standard error.
It is reasonable to expect that selection pressure is higher against radical amino acid changes than against conservative changes because of a greater difference in amino acid chemical characteristics. Because it is also assumed that radical amino acid changes improve protein function more frequently, the ratio of radical to conservative amino acid changes (dR/dC) has been used to infer divergent selection (Hughes et al. 1990). However, if the intensity of purifying selection differs between radical and conservative amino acid replacements (Smith 2003), a ratio dR/dC > 1 may not necessarily indicate positive selection (Dagan et al. 2002; Hanada et al. 2006; Suzuki 2007). Nevertheless, dR and dC can still be used to examine what type of nonsynonymous substitutions are predominant given the higher rate of divergence among TFs required for chemosensory neuron differentiation. Five amino acid chemical classifications (charge; polarity; polarity and volume; charge and aromatic; and charge and polarity) (Zhang 2000; Hanada et al. 2006) were used to compare the ratios of radical amino acid changes with synonymous substitutions (dR/dS) and conservative amino acid changes to synonymous substitutions (dC/dS) between the TFs and the chemosensory genes. For all five classifications, both dR/dS and dC/dS are greater for the TFs than for the structural chemosensory genes (table 2). Altogether these results indicate stronger purifying selection on the chemosensory genes and/or relaxed selection on the TFs required for chemosensory neuron differentiation.
TFs Controlling Chemosensory Neuron Differentiation Exhibit Higher Levels of Radical Nonsynonymous/Synonymous (dR/dS) and Conservative Nonsynonymous/Synonymous (dC/dS) Rate Ratios Than Structural Chemosensory Genes
| dR/dS | dC/dS | |||
| Chemical Classification | TF | Structural | TF | Structural |
| Charge | 0.0471 ± 0.006 | 0.0325 ± 0.003* | 0.1084 ± 0.008 | 0.0586 ± 0.005*** |
| Polarity | 0.0793 ± 0.007 | 0.0361 ± 0.004*** | 0.0849 ± 0.007 | 0.0554 ± 0.004*** |
| Volume & polarity | 0.0587 ± 0.005 | 0.0360 ± 0.003*** | 0.1347 ± 0.011 | 0.0748 ± 0.006*** |
| Charge &aromatic | 0.0498 ± 0.005 | 0.0369 ± 0.003* | 0.1209 ± 0.010 | 0.0619 ± 0.005*** |
| Charge & polarity | 0.0635 ± 0.006 | 0.0359 ± 0.003*** | 0.1193 ± 0.009 | 0.0677 ± 0.005*** |
NOTE.—Mean ± 1 standard error. Significance is obtained from a nonparametric Wilcoxon two-sample test: *P < 0.05, **P < 0.01, and ***P < 0.001. The list of TFs used in this analysis is reported in supplementary table 3, Supplementary Material online.
The radical and conservative amino acid changes are based on five amino acid chemical classifications. Caenorhabditis remanei and Caenorhabditis briggsae were used to compute divergence.
Pattern of Polymorphism among Neuronal Transcription Factors
Polymorphism levels (π, Nei 1987) at nonsynonymous and synonymous sites are higher for the TFs odr-7 and ceh-36 (mean values: πa = 4.17 × 10⁻³, πs = 55 × 10−3) than for other loci (n = 13) in C. remanei (mean values: πa = 3.16 × 10⁻³, πs = 44.87 × 10⁻³) (Graustein et al. 2002; Jovelin et al. 2003, 2009; Haag and Ackerman 2005; Cutter et al. 2006). In order to investigate the level of nucleotide diversity among TFs, I sampled polymorphism information from 16 strains of C. remanei derived from one population, along nearly the full length of the coding sequence of 28 additional TF loci required for the differentiation of various classes of neurons (table 3). Among 31.36 kb of coding sequence from the subset of 31 genes from table 1, there are 990 polymorphic changes with only 24 sites segregating as three variants. Three loci, Cre-ceh-14, Cre-egl-5, and Cre-mec-3 show length variants with strains PB263 and PB271 having a 51-bp deletion corresponding to exon 2 in Cre-mec-3. In all cases, these length variants show deletion adjacent to splice sites, suggesting that an alternative spliced cDNA was amplified and sequenced. Three other loci, Cre-che-1, Cre-ceh-23, and Cre-die-1 exhibit size variation of a couple of codons.
Nucleotide Diversity in Neuronal TFs in Caenorhabditis remanei
| Locus | LGa | Nb | NSc | % Seqd | Pe | Af | Sg | π (10−3)h | πa (10−3)i | πs (10−3)j | Tajima′s D |
| Cre-aha-1 | I | 16 | 1,195 | 88 | 12 | 3 | 9 | 3.84 | 0.85 | 13.65 | 2.0263* |
| Cre-alr-1 | X | 16 | 948 | 87 | 17 | 1 | 16 | 4.98 | 0.17 | 20.64 | −0.4026 |
| Cre-ceh-2 | I | 16 | 546 | 88 | 6 | 1 | 5 | 2.64 | 0.55 | 9.97 | −0.3301 |
| Cre-ceh-12 | I | 15 | 464 | 85 | 14 | 5 | 9 | 7.47 | 3.19 | 21.27 | −0.1559 |
| Cre-ceh-14 | X | 16 | 901 | 86 | 21 | 3 | 18 | 5.47 | 0.93 | 21.04 | −0.6519 |
| Cre-ceh-17 | I | 16 | 626 | 90 | 15 | 1 | 14 | 8.32 | 0.69 | 32.23 | 0.2453 |
| Cre-ceh-23 | III | 16 | 830 | 91 | 73 | 5 | 68 | 27.76 | 3.47 | 99.7 | 0.0334 |
| Cre-ceh-36ak | X | 12 | 792 | 100 | 68 | 13 | 50 | 25.1 | 7.18 | 80.56 | −0.6289 |
| Cre-ceh-36bk | X | 12 | 795 | 100 | 25 | 4 | 21 | 8.6 | 1.97 | 29.08 | −0.7836 |
| Cre-ceh-37a | X | 16 | 684 | 87 | 40 | 14 | 26 | 19.42 | 7.25 | 61 | 1.2923 |
| Cre-ceh-37b | X | 11 | 736 | 87 | 34 | 2 | 33 | 22.23 | 1.88 | 88.43 | 1.5704 |
| Cre-che-1 | I | 12 | 758 | 87 | 39 | 9 | 32 | 19.73 | 4.92 | 66.41 | 0.5665 |
| Cre-cnd-1 | III | 16 | 497 | 87 | 13 | 0 | 14 | 6.59 | 0 | 25.96 | −0.9526 |
| Cre-cog-1 | II | 16 | 691 | 88 | 34 | 2 | 33 | 16.16 | 0.53 | 70.41 | −0.0854 |
| Cre-die-1 | II | 16 | 1,848 | 94 | 30 | 3 | 28 | 4.5 | 0.49 | 18.64 | −0.2018 |
| Cre-egl-5 | III | 16 | 572 | 86 | 16 | 0 | 17 | 10.97 | 0 | 46.94 | 1.7779 |
| Cre-egl-43 | II | 15 | 1,563 | 92 | 69 | 5 | 64 | 15.36 | 1.51 | 61.08 | 0.4787 |
| Cre-egl-46 | V | 16 | 782 | 92 | 29 | 4 | 28 | 15.68 | 2.47 | 62.21 | 1.2722 |
| Cre-ham-2 | X | 16 | 1,022 | 87 | 16 | 1 | 15 | 4.79 | 0.41 | 20.59 | −0.0261 |
| Cre-lim-4 | X | 16 | 856 | 83 | 16 | 2 | 14 | 6.37 | 0.93 | 26.05 | 0.4122 |
| Cre-lim-6 | X | 8 | 789 | 91 | 19 | 2 | 17 | 6.84 | 0.81 | 28.73 | −1.068 |
| Cre-lin-11 | I | 16 | 1,148 | 92 | 16 | 2 | 14 | 4.89 | 0.87 | 18.59 | 1.4177 |
| Cre-mec-3 | IV | 16 | 822 | 86 | 49 | 3 | 47 | 19.15 | 2.09 | 81.26 | 0.2256 |
| Cre-odr-7k | X | 12 | 1,380 | 100 | 76 | 17 | 59 | 15.88 | 3.86 | 58.81 | −0.4576 |
| Cre-pag-3 | X | 14 | 884 | 88 | 25 | 1 | 25 | 9.92 | 0.38 | 43.19 | −0.1922 |
| Cre-unc-3 | X | 16 | 1,429 | 97 | 52 | 3 | 51 | 11.8 | 0.97 | 46.23 | 0.1566 |
| Cre-unc-4 | II | 16 | 669 | 90 | 56 | 6 | 51 | 32.13 | 3.94 | 127.11 | 1.2304 |
| Cre-unc-30 | IV | 16 | 880 | 90 | 19 | 5 | 14 | 6.13 | 1.85 | 19.99 | 0.2655 |
| Cre-unc-130 | II | 16 | 859 | 86 | 22 | 4 | 18 | 6.83 | 1.06 | 27.35 | 0.0059 |
| Cre-vab-7 | III | 16 | 666 | 89 | 4 | 1 | 3 | 2.67 | 0.91 | 8.11 | 1.0855 |
| Cre-zag-1 | IV | 13 | 1,735 | 96 | 53 | 7 | 48 | 8.63 | 1.33 | 33.79 | −0.7972 |
NOTE.—*P < 0.05.
LG: linkage group in Caenorhabditis elegans.
N: number of strains.
NS: number of sites analyzed.
% Seq: percent of the Caenorhabditis remanei gene sequenced.
P: number of polymorphic sites.
A: number of amino acid replacement changes.
S: number of synonymous changes.
π: total nucleotide diversity.
πa: nucleotide diversity at nonsynonymous sites.
πs: nucleotide diversity at synonymous sites.
From Jovelin et al. (2009).
Although polymorphism for some loci is somewhat skewed toward rare variants (table 3), as shown by negative values of Tajima's D (Tajima 1989), the mean value of Tajima's D at synonymous sites is 0.2364. For only one locus, Cre-aha-1, Tajima's D shows significant deviation from the neutral expectation in the direction of an excess of heterozygosity, usually interpreted as a signature of balancing selection. The proportion of rare variants is low in comparison with the pattern observed in C. elegans (Jovelin et al. 2009), 32% of polymorphic changes segregate as singleton polymorphism. Nevertheless, there is a highly significant difference in the ratio of nonsynonymous to synonymous changes (A/S) between rare (i.e., singleton variants) and common polymorphism (A/Srare = 0.2083, A/Scommon = 0.1239; χ2 = 7.365, P < 0.01), suggesting that a fraction of nonsynonymous changes with low frequency may be slightly deleterious (Fay et al. 2001).
Nucleotide diversity at nonsynonymous sites ranges from 0 to 7.27 × 10⁻³ and with an average of 1.85 × 10⁻³, whereas nucleotide diversity at synonymous sites ranges from 8.11 × 10⁻³ to 127.11 × 10⁻³ and averages at 44.16 × 10⁻³ (table 3). No correlation is observed between nucleotide variability and codon usage bias as measured by the CAI (Sharp and Li 1987) (πa × CAI: Spearman's ρ = 0.044, P = 0.815; πs × CAI: Spearman's ρ = 0.168, P = 0.367). Although a better sampling will be necessary to correctly assess the level of nucleotide diversity in C. brenneri, first estimates can be obtained using the loci for which two alleles are present in the genome assembly. Among 18.36 kb of coding sequence from 15 TF loci, nucleotide diversity at nonsynonymous sites in C. brenneri ranges from 0 to 12.89 × 10⁻³ and averages at 4.3 × 10⁻³. The average nucleotide diversity at synonymous sites is 113.97 × 10⁻³, with ranges from 40.8 × 10⁻³ to 191.37 × 10⁻³. Among a subset of nine genes for which alleles are available both in C. remanei and C. brenneri, nucleotide diversity in C. remanei (measured from two alleles chosen at random for each gene) is lower than in C. brenneri (π: Wilcoxon two-sample P = 0.01). Nevertheless, the higher level of polymorphism is solely due to diversity at synonymous sites (πa: Wilcoxon two-sample P = 0.506; πs: Wilcoxon two-sample P = 0.004) suggesting that level of nucleotide diversity in C. brenneri may be relatively high.
TFs Exhibit Higher Nucleotide Diversity Than Structural Genes
In order to investigate whether neuronal TFs exhibit high or low levels of nucleotide diversity, I used a published data set of polymorphism in C. remanei for 37 structural loci (Cutter 2008). This data set of structural loci is useful for comparison because these genes have diverse functions (supplementary table 1, Supplementary Material online), and most importantly because polymorphism was obtained in the coding region using a similar number of strains that have the same geographical origin. Although the level of interspecific divergence is higher among the neuronal TFs (table 1) than among the structural genes (dN: Wilcoxon two-sample P < 0.0001; dN/dS: Wilcoxon two-sample P = 0.006; LRT: ωTF = 0.0759, ωstructural = 0.0506, 2Δl = 2066.7, P < 0.001), the overall levels of nucleotide diversity are not significantly different (π: Wilcoxon two-sample P = 0.375).
Even so, it is more informative to compare changes affecting the protein sequence and segregating within the population. The ratio of nonsynonymous to synonymous polymorphism (A/S) is significantly higher for the neuronal TFs than for the structural genes (table 4). Nevertheless, assuming that chromosomal location is conserved between C. elegans and C. remanei, in particular for genes on the X chromosome (Hillier et al. 2007), the set of structural loci is made of genes that are all putatively linked to the X chromosome. Because of a smaller population size increasing the fixation of slightly deleterious mutations through genetic drift and because of genetic hitchhiking eliminating neutral variation, the level of nucleotide diversity for X-linked loci may be lower than for autosomal loci. The putatively X-linked TFs have nonetheless a significantly higher A/S ratio than the structural genes (table 4), indicating that chromosomal location is not responsible for the difference in the pattern of polymorphism. In addition, applying a 4/3 correction to the polymorphism estimates of the X-linked loci, to compensate for differences in effective population size, leads to the same results for each comparison between the sets of TFs and structural genes from table 4 (data not shown). However, a closer look at the function of the TFs potentially linked to the X chromosome reveals that most are involved in the differentiation of chemosensory neurons (χ2 = 7.039, P < 0.01). The A/S ratio for the neuronal TFs excluding those required for chemosensory neuron differentiation is higher than for structural genes but the difference is not significant. By contrast, the TFs determining chemosensory neuron identity exhibit significantly higher nonsynonymous polymorphic changes than structural loci (table 4). Analyses using the nucleotide diversity indexes lead to the same results (supplementary table 2, Supplementary Material online). These results show that TFs, in particular those involved in the development of chemosensory neurons, can exhibit high levels of within-population variation.
TFs Controlling Neuron Identity Exhibit More Nonsynonymous Polymorphism Than Structural Genes
| Loci | Na | Ab | Sc | A/S |
| TF-all | 31 | 129 | 861 | 0.1498** |
| TF-X | 12 | 63 | 345 | 0.1826*** |
| TF-chemosensory | 14 | 78 | 412 | 0.1893*** |
| TF-autosomes | 19 | 66 | 516 | 0.1279 |
| TF-not chemosensory | 17 | 51 | 449 | 0.1136 |
| Structural-Xd | 37 | 76 | 781 | 0.0973 |
| Loci | Na | Ab | Sc | A/S |
| TF-all | 31 | 129 | 861 | 0.1498** |
| TF-X | 12 | 63 | 345 | 0.1826*** |
| TF-chemosensory | 14 | 78 | 412 | 0.1893*** |
| TF-autosomes | 19 | 66 | 516 | 0.1279 |
| TF-not chemosensory | 17 | 51 | 449 | 0.1136 |
| Structural-Xd | 37 | 76 | 781 | 0.0973 |
NOTE.—Significance is obtained from a χ2 test: **P < 0.01, ***P < 0.001.
The ratio of nonsynonymous to synonymous polymorphism in Caenorhabditis remanei is compared between structural X-linked loci to each set of TFs. Chromosomal linkage is based on Caenorhabditis elegans orthologs and is assumed to be conserved between C. elegans and C. remanei. Chemosensory genes refer to the TFs required for the differentiation of chemosensory neurons (table 1). The list of TFs in each gene set is reported in supplementary table 3, Supplementary Material online.
N: number of loci.
A: number of amino acid replacement changes.
S: number of synonymous changes.
From Cutter (2008).
Differences in Selective Pressures among Neuronal Transcription Factors
In order to further investigate the differences in evolutionary rates among neuronal TFs, I compared the level of between- and within-species divergence among genes that are specifically required for chemosensory neuron and motorneuron differentiation, respectively, and those affecting several functional classes (table 1). A LRT indicates that a model with different dN/dS for each type of TF better fits the data (ωchemo = 0.0952, ωmotor = 0.0877, ωmultiple = 0.0551; 2Δl = 423.98, P < 0.001). The TFs regulating the differentiation of several classes of neurons are under stronger selective constraints, presumably because of their broader role in neuronal development. Remarkably, the TFs that specifically regulate chemosensory neuron differentiation are the most divergent. Similarly the ratio of nonsynonymous to synonymous polymorphism A/S is significantly higher for the TFs involved in chemosensory neuron differentiation than those required for the differentiation of motorneurons and multiple neuron classes (table 5), although the difference between the two latter gene classes is not significantly different (χ2 = 0.041, P = 0.84). These results show that neuronal TFs are under different selective constraints and that regulatory genes controlling chemosensory neuron development accumulate higher levels of nucleotide diversity both within and between species.
TFs Controlling Chemosensory Neuron Identity Exhibit a High Level of Nonsynonymous Polymorphism
NOTE.—Significance is obtained from a χ2 test: *P < 0.05, **P < 0.01.
The ratio of nonsynonymous to synonymous polymorphism in Caenorhabditis remanei is compared between TFs controlling chemosensory neuron differentiation to TFs affecting the motorneuron class and to those affecting several classes of neurons including, among other classes, motorneurons and/or chemosensory neurons. The list of TFs in each gene set is reported in supplementary table 3, Supplementary Material online.
N: number of loci.
A: number of amino acid replacement changes.
S: number of synonymous changes.
Discussion
Molecular evolutionary analyses of various TF family members in plants and animals have detected rapid divergence and/or instances of adaptive selection (Sutton and Wilkinson 1997; Barrier et al. 2001; Fares et al. 2003; Jia et al. 2003; Moore et al. 2005; Hernandez-Hernandez et al. 2007; Lynch et al. 2008). Nematodes in particular seem to show elevated rates of divergence for TF genes (Castillo-Davis et al. 2004; Cutter and Ward 2005; Haerty et al. 2008; Jovelin et al. 2009). However, these studies included a small number of TFs or were based on bioinformatic analyses between orthologous or paralogous genes. Few attempts have been made to investigate global population-level constraints on TFs (Bustamante et al. 2005), and thus the extent of these constraints remained unclear. In order to address this issue, I examined nucleotide variation within one population of C. remanei among 31 TFs required for the development of various neuronal classes in C. elegans.
TFs Exhibit High Nucleotide Diversity
Remarkably, the neuronal TFs exhibit a significantly higher nonsynonymous to synonymous polymorphism ratio (A/S) than structural genes (table 4 and supplementary table 2, Supplementary Material online). However, the structural loci used in this analysis are from a data set used to quantify nucleotide diversity along the X chromosome (Cutter 2008), which could lead to several potential complications. On the one hand, theory predicts that background selection should result in higher neutral polymorphism on the X chromosome (Begun and Whitley 2000), whereas smaller effective population size and genetic hitchhiking are expected to result in lower polymorphism (Charlesworth et al. 1987). On the other hand, the X chromosome is expected to diverge more between species than autosomes (see Vicoso and Charlesworth 2006). A higher divergence of the X chromosome relative to autosomes is apparent in Drosophila melanogaster, Drosophila simulans, and Drosophila yakuba (Begun et al. 2007). However, a genomewide survey of polymorphism within D. simulans revealed that heterozygosity is not significantly lower on the X (after correction, Begun et al. 2007). To the extent that chromosomal linkage is conserved between Caenorhabditis species (Hillier et al. 2007), the higher A/S ratio of TFs could be due to a reduction of nucleotide diversity among the structural genes. However, because the A/S ratio of putative X-linked TFs is still significantly higher than that of structural genes (table 4) and because correcting for the difference in population size between chromosomes leads to the same results, the difference of polymorphism level between the two gene classes is unlikely to be the result of linkage. Moreover, the TFs show more between-species divergence than the putatively X-linked structural loci. Therefore, the higher rate divergence and higher A/S ratio of TFs are more likely to reflect differential selective constraints acting on these two gene classes.
Nucleotide Divergence and Function in Neuron Differentiation
Does this pattern of nucleotide rate divergence reflect global high rates of divergence among TFs? Genomic analyses among Caenorhabditis species show that the core set of TFs present in C. elegans, C. briggsae, and C. remanei has a significantly higher nonsynonymous substitution rate than non-TF genes present in the three species (Haerty et al. 2008). Nevertheless, the answer to this question is not straightforward. Significantly more C. elegans TF orthologs are detected in C. briggsae than orthologs for other C. elegans genes (Haerty et al. 2008), either because these genes are species-specific or because some non-TF genes are so divergent that orthology cannot be assigned. In Drosophila, genes in the Gene Ontology categories “DNA binding” and “TF activity” (i.e., potential TFs) show a higher divergence rate ratio than the median rate of divergence for all genes with Gene Ontology terms. However, this is due to a lower synonymous substitution rate rather than accelerated amino acid changes as there are no significant differences in nonsynonymous rates (Clark et al. 2007). Global patterns of divergence between TFs and non-TFs may therefore be difficult to establish.
Insights into the cellular context in which proteins operate, as in the present study, is helpful when testing assumptions regarding TF sequence evolution. This is particularly true when comparing evolutionary rates with structural proteins because any observed difference between the two gene classes could simply be due to differences in pleiotropic constraints (Duret and Mouchiroud 2000). Fully addressing the relationship between pleiotropic constraints and nucleotide variation may require standardized measures for the number of cells expressing TFs and structural genes. Nevertheless, it is noteworthy that although most TFs analyzed here have known effects restricted to nervous system differentiation (table 1), 35% (17/48) (see Materials and Methods) also play a role in the differentiation of nonneuronal tissues. Moreover, 67% (32/48) of the TFs are expressed in more than one tissue type versus 46% (35/76) for the structural genes (www.wormbase.org). Therefore, there does not seem to be a simple relationship between expression breadth and nucleotide variation for the genes analyzed here. Thus, the patterns of divergence and polymorphism reported here strongly argue that TFs can evolve rapidly and are at odds with the notion that TFs are highly constrained (Carroll 2005, 2008).
A classical means of assessing whether a gene has undergone adaptive evolution is to compare the ratio of nonsynonymous to synonymous substitutions among lineages with that of polymorphic changes within lineages (MK test, McDonald and Kreitman 1991). Although the MK test is robust when slightly deleterious mutations are segregating, in particular when there is selection for codon usage (Eyre-Walker 2002), it requires that the observed number of changes between two species accurately reflects the number of changes that happened since their divergence. The saturation at synonymous sites in Caenorhabditis prevents the use of the MK test because it may inflate the divergence ratio, leading to spurious significant results. Thus, the high level of amino acid divergence observed among the neuronal TFs could be the result of positive selection and/or relaxed section. Nevertheless, the high divergence of TF protein sequence is still relevant because the accumulation of neutral or slightly neutral nonsynonymous substitutions may play a creative role in evolution by paving the ground for subsequent beneficial mutations that would be deleterious in a different sequence context (Ortlund et al. 2007; Wagner 2008).
It is possible that the high nucleotide divergence observed in these TFs is due to their function in neuron differentiation. For instance, loss of function mutations in 70% of the genes in table 1 result in neurons that are correctly generated but not fully differentiated. One way of reducing the negative pleiotropy of TFs is tissue specificity (or in this case, cell specificity), through the cooperative action of TFs and cofactors (Lynch and Wagner 2008; Wagner and Lynch 2008). This may be a particularly important mechanism for relaxing constraints on neuronal TFs because individual neurons in C. elegans are specified by the combinatorial role of TFs, as exemplified by the joint action of ceh-10, ttx-3, and ceh-23 in the differentiation of the AIY neurons (Altun-Gultekin et al. 2001) and the joint action of ceh-36, che-1, lzy-2, fozi-1, die-1, lim-6, and cog-1 in the differentiation of the ASE neurons (Hobert et al. 1999; Chang et al. 2003; Lanjuin et al. 2003; Uchida et al. 2003; Johnston and Hobert 2005; Johnston et al. 2006). Another consequence of this combinatorial code is that regulation of target genes can be cell specific. The LIM homeobox lim-6 regulates the expression of unc-25 in the neurons RIS, AVL, and DVD but has no effect on unc-25 expression in the right and left RME neurons (Hobert et al. 1999). Similarly, the homeobox unc-30 regulates the expression of unc-25 and unc-47 in only 19 of the 26 GABAergic neurons expressing these two genes (Eastman et al. 1999).
High Nucleotide Diversity in Transcription Factors Controlling Chemosensory Neuron Differentiation
Another means of relaxing pleiotropic constraints is gene duplication (Lynch and Wagner 2008; Wagner and Lynch 2008), which can increase evolvability and lead to the evolution of new functions, to the partitioning of ancestral functions and even to speciation (Force et al. 1999; Roth et al. 2007). Two neuronal TFs, the homeodomain genes ceh-36 and ceh-37, required for the differentiation of chemosensory neurons (table 1), were specifically duplicated in the lineage leading to C. remanei. Interestingly, TFs involved in chemosensory neuron differentiation evolve at high rates. They are more divergent than structural chemosensory genes (fig. 1 and table 2) and have a greater A/S ratio than structural genes (table 4). TFs that are specifically required for chemosensory neuron differentiation also show higher between- and within-species divergence than TFs required for the development of motorneurons. They are also more polymorphic and divergent than TFs affecting the development of several functional neuron classes (table 5). Evolving different chemosensory capabilities allows specialization to new resources and can promote speciation in sympatric areas (Linn et al. 2003). For example, Drosophila sechellia‘s attraction to the fruits of its unique host Morinda citrifolia results partly from an increased sensitivity of the olfactory receptor Or22a to methyl hexanoate relative to ethyl hexanoate. Importantly, fruit attraction is also due to a 2.5- to 3-fold increase in the number of ab3 neurons, the neurons expressing Or22a, concomitant with a reduction in the number of ab1 neurons (60–80%) and ab2 neurons (93–100%) compared with D. melanogaster (Dekker et al. 2006). Although the genetic mechanisms for this shift are unknown, this example clearly shows that changes in neuron identity can lead to chemosensory diversity and behavioral specialization.
Conclusion
The high within- and between-species nucleotide variation reported here suggests that the divergence of developmental regulatory genes may play a greater role in phenotypic change and, more broadly, in the evolution of gene regulatory networks than has been previously thought. The allelic variation observed at these TF loci suggests the presence of the raw material necessary for the evolution of neuron diversity. It will be interesting to test the functional divergence of neuronal TF orthologs in Caenorhabditis.
I thank Patrick C. Phillips and three anonymous reviewers for comments on the manuscript. Scott Baird kindly provided the C. remanei strains. This work was supported by an NSF Doctoral Dissertation Improvement Grant (DEB-0710378) and by the NSF Integrative Graduate Education and Research Traineeship Training Program for Development, Evolution and Genomics (DGE-9972830), as well as grants from the National Institutes of Health (GM54185 and AG029377) and the National Science Foundation (DEB-0236180) to P.C. Phillips.
References
Author notes
John H McDonald, Associate Editor
