


Abstract
In detecting natural selection operating at the amino acid sequence level by comparing the rates of synonymous (rS) and nonsynonymous (rN) substitutions, the rates of synonymous and nonsynonymous mutations are assumed to be approximately the same. In reality, however, these rates may not be the same if different proportions of synonymous and nonsynonymous sites overlap with CpG dinucleotides, which are known to be hypermutable in some organisms. Here, we develop the evolutionary pathway methods for comparing rS and rN at multiple codon sites (all-sites analysis) and at single codon sites (single-site analysis) that take into account the hypermutability at CpG dinucleotides in estimating the number of synonymous substitutions per synonymous site (dS) and nonsynonymous substitutions per nonsynonymous site (dN). Computer simulations show that the direction and magnitude of the bias in the estimation of dN/dS caused by the hypermutability of CpGs are determined by both the number of CpGs and the relative proportions of synonymous and nonsynonymous sites overlapping with CpGs. This bias is greatly reduced when using the methods we propose to account for the hypermutability of CpG dinucleotides. In an all-sites analysis of protamine 1 genes from primates, dN/dS > 1 was observed for many pairs if the hypermutability was ignored. However, dN/dS becomes ≤1 for most of these pairs when the CpG sites are assumed to be hypermutable. Therefore, statistical indications of positive selection in some sequences or individual codons may be caused by mutation rate differences in synonymous and nonsynonymous sites.
Introduction
Point mutations occurring in the protein-coding nucleotide sequence are either synonymous or nonsynonymous according to whether they retain or alter the coding amino acids, respectively. They are also advantageous, neutral, or deleterious according to whether they confer a greater, equal, or lower fitness, respectively, to the mutant individuals compared with the average in the population. Because the probability of fixation of advantageous mutations is greater than that of neutral mutations, which, in turn, is greater than that of deleterious mutations, positive and negative selection operating at the amino acid sequence level may be inferred by comparing the rates of synonymous (rS) and nonsynonymous (rN) substitutions (Kimura 1977; Hughes and Nei 1988). The evolutionary pathway method of Miyata and Yasunaga (1980), which was later modified by Nei and Gojobori (1986), is one of the most widely used methods for comparing rS and rN at multiple codon sites (all-sites analysis). This method has also been adapted for comparing rS and rN at individual codons (single-site analysis) (Suzuki and Gojobori, 1999).
However, it is now clear that the assumption of equality for rS and rN under strictly neutral evolution does not always hold (reviewed in Filipski et al. 2007). For example, the rates of synonymous and nonsynonymous mutations may not be the same if different proportions of synonymous and nonsynonymous sites overlap with CpG dinucleotides, which are known to be hypermutable in vertebrates and plants (e.g., Subramanian and Kumar 2006). In these organisms, the cytosine of CpG is often methylated as a 5-methylcytosine, which mutates to a thymine through deamination, whereas an unmethylated cytosine mutates to a uracil. Because the mutated uracils can be corrected by the repair machinery, whereas the mutated thymines cannot, the rate of transition mutation at the CpG sites (μti(CpG)) is elevated compared with that at the non-CpG sites (μti(non-CpG)) on average (Krawczak et al. 1998; Bird 1999; Hellmann et al. 2003; Subramanian and Kumar 2003). The rate of transversion mutation at CpG sites (μtv(CpG)) is also known to be elevated compared with that at non-CpG sites (μtv(non-CpG)), although the mechanism is not fully understood.
Through comparative sequence analysis, μti(CpG) and μtv(CpG) have been estimated to be approximately 10 and 4–10 times greater than their non-CpG counterparts, respectively (Ketterling et al. 1994; Nachman and Crowell 2000; Subramanian and Kumar 2003; Zhang et al. 2007). In addition, the ratio of transition/transversion rate (μti(non-CpG)/μtv(non-CpG)) has been estimated to be ∼4 for non-CpG sites in many studies (e.g., Rosenberg et al. 2003; Jiang and Zhao 2006; Zhang et al. 2007). Consequently, the hypermutability at CpG dinucleotides has been incorporated into the codon substitution model (Jensen and Pedersen 2000; Huttley et al. 2004; Siepel and Haussler 2004; Hobolth et al. 2006).
The purpose of the present study was to develop modifications of evolutionary pathway methods for comparing rS and rN in the all-sites and single-site analyses by taking into account the hypermutability at CpG dinucleotides. Computer simulation was conducted for examining the statistical properties of these CpG-adjusted methods. We also analyzed protamine 1 genes from primates in order to study the effect of hypermutability on the estimation of rN/rS in the real data analysis.
Materials and Methods
Method for All-Sites Analysis
In this method, the numbers of synonymous sites (sS), nonsynonymous sites (sN), synonymous differences (cS), and nonsynonymous differences (cN) are estimated and used to compare rS and rN at all included codon sites in a pair of protein-coding nucleotide sequences (Miyata and Yasunaga 1980; Nei and Gojobori 1986; Kondo et al. 1993; Zhang et al. 1998). In our method, a codon and its flanking nucleotides (a total of 5 nt) are considered together as a unit of comparison. Only 4 nt are considered when the codon is located at either end of the sequence. It should be noted that when the coding sequence is interrupted by introns, which usually start with GT and end with AG, CpG dinucleotide status in the genomic sequence may be missed or misassigned in the analysis of cDNA sequences. For example, if an intron is inserted into the middle of CT, CC, or CA in the coding sequence, the CpG dinucleotide that consists of the last nucleotide (cytosine) of the 5′-exon and the first nucleotide of the intron (guanine) in the genomic sequence may be missed in the analysis of cDNA sequences. For simplicity, however, we assume single exon proteins in the present paper, because intron locations are not always available and introns may not interrupt the coding sequences at the same positions in all genes and species analyzed.
We first compute sS and sN for all codon sites of the two sequences. This is done in the same way as for classical approach for 3 nt (see Nei and Kumar 2000 for an explanation), with the exception that the rates of synonymous, nonsynonymous, and termination mutations are considered in the context of 5nt (or 4 nt). In a comparison of a pair of 5 nt (or 4 nt) sites, substitutions occurring at all sites are taken into account when generating all possible evolutionary pathways. The total number of nucleotide sites in the sequence is divided into sS, sN, and the number of termination sites proportional to the sums of the rates of synonymous, nonsynonymous, and termination mutations for all codon sites, respectively. The termination sites are discarded in the subsequent analysis (e.g., Kumar et al. 1993; Yang and Nielsen 1998; Suzuki 2007). The number of synonymous and nonsynonymous differences between codons are computed using the classical evolutionary pathway approach for 3 nt without considering the relative rates of transitional and transversional mutations at CpG and non-CpG sites (see Nei and Kumar 2000 for a detailed description). The cS and cN values are obtained as the sums of synonymous and nonsynonymous differences over all codons in the two sequences compared.
The proportions of synonymous (pS) and nonsynonymous (pN) differences are computed as cS/sS and cN/sN, respectively. The number of synonymous substitutions per synonymous site (dS) and that of nonsynonymous substitutions per nonsynonymous site (dN) are estimated by correcting for multiple substitutions using the formulae −(3/4) ln{1 − (4/3)pS} and −(3/4) ln{1 − (4/3)pN}, respectively (Jukes and Cantor 1969; Miyata and Yasunaga 1980; Nei and Gojobori 1986; Zhang et al. 1998). The rN/rS is estimated as dN/dS.
Method for Single-Site Analysis
In this method, sS and sN as well as cS and cN are computed to compare rS and rN at each codon across multiple sequences (Suzuki and Gojobori 1999). Each codon site of the multiple alignment and the flanking nucleotides are considered, as appropriate, in the context of a given phylogenetic tree. The computation of sS and sN is done in the same way as for the classical approach for 3 nt (see Suzuki and Gojobori 1999), with the exception that the rates of synonymous, nonsynonymous, and termination mutations are considered in the context of 5 nt (or 4 nt). The total number (three) of nucleotide sites in the codon is divided into sS, sN, and the number of termination sites proportional to the rates of synonymous, nonsynonymous, and termination mutations, respectively. The cS and cN values are obtained using the classical evolutionary pathway approach for 3 nt (see Suzuki and Gojobori 1999 for a detailed description).
The estimates of dS and dN are obtained as cS/sS and cN/sN, respectively, and rN/rS is estimated as dN/dS. Although multiple substitutions are not corrected for computing dS and dN, the degree of underestimation appears to be negligible in the present study because the branch lengths of the phylogenetic tree at individual codons are rather small (Saitou 1989).
Computer Simulation
In the computer simulation for the all-sites analysis, an ancestral sequence with 500 codon sites was generated using pseudorandom numbers under the assumption that the frequencies for 61 sense codons were the same. The average frequencies for 61 sense codons over all human protein–coding genes were also used for generating the ancestral sequence. The average codon frequencies were calculated based on 16,971,784 codons in 37,388 RefSeq RNAs with prefixes NM and XM (retrieved from ftp://ftp.ncbi.nih.gov/refseq/H_sapiens/H_sapiens/RNA/ on May 31, 2009) (Pruitt et al. 2007), excluding the initiation and termination codons (supplementary table S1, Supplementary Material online). In addition, ancestral sequences containing only codons TCG, CGT, or GTC were generated to examine the effect of hypermutability at CpG dinucleotides on the estimation of rN/rS. As a control, we conducted computer simulations with ancestors having the same base contents as TCG, CGT, or GTC, but lacking CpGs (TGC, CTG, or GCT). An ancestral sequence consisting only of CpGs was also generated by repeating CpG 750 times.
The ancestral sequence generated was evolved according to the phylogenetic tree shown in supplementary fig. S1, Supplementary Material online. In each case, evolution began by creating two descendants of the ancestral sequence such that their evolutionary distance was 0.05 substitutions per site (75 substitutions in 1,500 nt). This process of descendant generation was repeated 20 times, which led to a maximum evolutionary distance (d) of 1.0 from the root of the phylogenetic tree to the most distant descendants. For each bifurcation event, mutations were introduced at a nucleotide site using pseudorandom numbers according to the mutation rate, such that the rate at CpG sites was higher than that at non-CpG sites. Three different ratios of CpG versus non-CpG mutation rates and transition–transversion rates were explored: μti(CpG):μtv(CpG):μti(non-CpG):μtv(non-CpG) = 40:4:4:1, 40:1:4:1, or 40:10:4:1. The fixation probability for a synonymous mutation was assumed to be 0.1, whereas that for a nonsynonymous mutation was assumed to be 0.02, 0.05, 0.1, 0.2, or 0.5, which corresponded to the case for rN/rS = 0.2 (negative selection), 0.5 (negative selection), 1.0 (no selection), 2.0 (positive selection), or 5.0 (positive selection), respectively.
At each step of lineage bifurcation, the two generated sequences were compared to estimate dS, dN, and dN/dS for the entire sequence using the classical and the proposed CpG-adjusted methods. The correct rate ratios for μti(CpG):μtv(CpG):μti(non-CpG):μtv(non-CpG) were assumed when calculating CpG-adjusted estimates, whereas only the transition–transversion bias was taken into account in the classical method, such that the ratio of μti(CpG):μtv(CpG):μti(non-CpG):μtv(non-CpG) was assumed to be 4:1:4:1. The entire simulation process was repeated 100 times, and the average values of dS, dN, and dN/dS over all the simulation replicates were recorded.
In the computer simulation for the single-site analysis, ancestral sequences were generated as above, but evolution followed the phylogenetic tree shown in supplementary fig. S2, Supplementary Material online. Each ancestral sequence produced two descendant sequences following the mutation and selection scheme mentioned above such that the evolutionary distance from the ancestral sequence to the descendants was 0.01 (15 substitutions in 1,500 nt). This bifurcation process was repeated eight times on successive nodes, which produced a total of 256 sequences in each simulation replicate.
These 256 sequences were analyzed to estimate dS, dN, and dN/dS at each codon with the correct phylogenetic tree, using the classical and the new CpG-adjusted methods. The entire simulation was repeated 100 times, and the average values of dS, dN, and dN/dS were computed over all codon sites of all replicates.
Real Data Analysis
In order to evaluate the usefulness of the CpG-adjusted method in a real world situation, we analyzed the protamine 1 sequence data. Protamine 1 is a positively charged protein of 50–53 amino acids, which inserts itself into the minor groove of negatively charged, double-stranded DNA, replacing histones, in order to condense the DNA during the spermatogenesis in primates. Analysis of protamine 1 in primates using the classical approaches has yielded dN/dS > 1, which has been interpreted to be due to positive selection (Rooney and Zhang 1999) or relaxation of functional constraint (Retief et al. 1993; Rooney et al. 2000; Van Den Bussche et al. 2002). Interestingly, 50% of all amino acids of protamine 1 are Arginines, which are encoded by the codon CGN or AGR (N and R denote T, C, A, or G and A or G, respectively) (Rooney et al. 2000). Because the codon CGN, which constitutes 15% of all codons in protamine 1, contains a CpG dinucleotide in the first two codon positions, protamine 1 is a useful protein to examine the effect of hypermutability at CpG dinucleotides on the estimation of dN/dS.
The species names and accession numbers in the International Nucleotide Sequence Database for protamine 1 genes used in the present study are as follows: Homo sapiens (HSA), M60331; Pan troglodytes (PTR), L14591; Pan paniscus (PPA), L14590; Gorilla gorilla (GGO), L14587; Pongo pygmaeus (PPY), L14589; Hylobates lar (HLA), L14588; Erythrocebus patas (EPA), M83730; Macaca mulatta (MMU), AF119240; Papio cynocephalus (PCY), AF119239; Colobus guereza (CGU), AF119233; Procolobus badius (PBA), AF294850; Semnopithecus entellus (SEN), AF119235; Trachypithecus vetulus (TVE), AF119236; Trachypithecus johnii (TJO), AF294853 and AF294854; Trachypithecus francoisi (TFR), AF119234; Trachypithecus geei (TGE), AF294857; Trachypithecus obscurus (TOB), AF119238; Trachypithecus phayrei (TPH), AF294858; Trachypithecus cristatus (TCR), AF294861; Trachypithecus pileatus (TPI), AF294856; Nasalis larvatus (NLA), AF119237; Saimiri sciureus (SSC), AF119241; and Ateles sp. (ASP), AF119242.
The nucleotide sequences of protamine 1 genes from MMU and PCY; SEN and TVE; TFR and TGE; and TOB, TPH, and TCR were identical. The protamine 1 proteins from all species consisted of 51 amino acid sites, except for those from PPA, SEN, TVE, SSC, and ASP, all of which consisted of 50 amino acid sites. When a multiple alignment for the amino acid sequences was constructed using the computer program ClustalW (version 1.83) (Thompson et al. 1994), positions 21, 26, and 34 were missing from the sequences of PPA; SEN and TVE; and SSC and ASP, respectively. After eliminating these sites, the alignment of amino acid sequences was reverse translated into that of codon sequences. It should be noted that no CpG dinucleotides were eliminated or created by the removal of these sites. Although protamine 1 contains an intron, it was always preceded by an adenine in the coding sequence, such that no CpG dinucleotides were missed or misassigned in the analysis of cDNA sequences.
Estimates of dS, dN, and dN/dS for the entire sequence of the protamine 1 gene between primates were obtained using the classical and CpG-adjusted methods. For the CpG-adjusted estimation, we conducted computation assuming five different ratios: μti(CpG):μtv(CpG):μti(non-CpG):μtv(non-CpG) = 40:4:4:1, 40:1:4:1, 40:10:4:1, 4:4:4:1, or 20:4:4:1. For the classical case, only the transition–transversion bias was taken into account: μti(CpG):μtv(CpG):μti(non-CpG):μtv(non-CpG) = 4:1:4:1.
Results
Simulation Results for All-Sites Analysis
The results from the use of the classical and CpG-adjusted methods show a diversity of differences depending on the simulation conditions explored (fig. 1). When the frequencies for 61 sense codons are assumed to be the same in the ancestral sequence, the classical and CpG-adjusted methods produce similar estimates of dN/dS (first column in fig. 1). This is because the number of synonymous and nonsynonymous sites involved in CpGs is small and the estimation biases are also small; only 6% of synonymous sites and 4% of nonsynonymous sites in the ancestral sequence are underestimated and overestimated, respectively, in the classical method as compared with the CpG-adjusted method. The estimates of dN/dS are close to the true values, except when dN/dS is equal to 2.0 or 5.0. In this case, the CpG-adjusted method produces an estimate with a small bias, probably because the Jukes-Cantor (1969) model used for multiple-hit correction does not apply well for synonymous and nonsynonymous sites, and the simple multiple-hit correction becomes increasingly insufficient for large values of dS and dN. A greater bias is observed when using the classical method, which is likely because CpGs are eliminated more rapidly from nonsynonymous sites than from synonymous sites under positive selection, and the number of synonymous (nonsynonymous) sites is underestimated (overestimated) in the classical method. Similar results were obtained when the average codon frequencies over all human protein-coding genes were used for generating the ancestral sequence (fig. 1, second column). Bias is also observed in estimates of classical and CpG-adjusted methods for simulations with ancestral sequences consisting of TGC, CTG, and GCT (fig. 1). In these cases, violation of the assumptions in the Jukes-Cantor (1969) model becomes larger because these sequences have a significant G + C content bias. In the future, it will be useful to account for this bias while accounting for multiple hits.
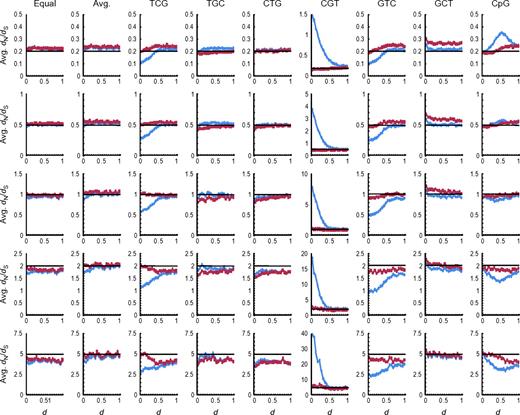
The average (Avg.) dN/dS values (ordinate) obtained at each step of evolution measured as d from the root of the phylogenetic tree (abscissa) in the computer simulation for the all-sites analysis. The estimates using the CpG-adjusted method (red line) assumed μti(CpG):μtv(CpG):μti(non-CpG):μtv(non-CpG) = 40:4:4:1, and the classical method (blue line) calculation assumed μti(CpG):μtv(CpG):μti(non-CpG):μtv(non-CpG) = 4:1:4:1. The black line indicates the true value. The graphs are arranged in rows according to the true values of dN/dS (0.2, 0.5, 1.0, 2.0, and 5.0 from the top to the bottom), and in columns according to the procedures the ancestral sequence was generated (Equal: frequencies for 61 sense codons were assumed to be the same; Avg.: average codon frequencies over all human protein–coding genes were used; and TCG, TGC, CTG, CGT, GTC, GCT, and CpG: TCG, TGC, CTG, CGT, GTC, GCT, or CpG was repeated, respectively).
When the ancestral sequence was generated as a repeat of CpG, the estimates of dN/dS from the classical method show increasingly larger deviation from the true values in general, whereas the CpG-adjusted method performs much better. These trends differ for simulations with low and high dN/dS values. When negative selection operates (dN/dS < 1), CpGs are eliminated from the synonymous sites more rapidly than from the nonsynonymous sites, leading to the overestimation of dN/dS in the classical method compared with the CpG-adjusted method. The situation is opposite when positive selection operates. In the absence of any selection, CpGs are eliminated from the nonsynonymous sites more rapidly than from the synonymous sites. This is because a nucleotide substitution at a synonymous site in a CpG dinucleotide is always accompanied by a decrease in a nonsynonymous site overlapping with the CpG, whereas a nucleotide substitution at a nonsynonymous site in a CpG can be accompanied by a decrease in a synonymous or nonsynonymous site overlapping with the CpG.
Classical and CpG-adjusted methods show major differences in simulations where the ancestral sequence consists of codons with CpG dinucleotides at two of three codon positions. For example, dN/dS values obtained using the classical method are always smaller than those obtained using the CpG-adjusted method in an analysis of descendants of a TCG ancestral sequence, which contains CpGs at the second and third positions of all codon sites (fig. 1). The differences are the largest at the earliest stages of evolution, and they decrease as the simulation progressed, ultimately reaching a common plateau, because the number of hypermutable sites decrease over time as we placed no constraints on the protein compositions. The estimates obtained from the CpG-adjusted method are found to be much closer to the true value.
Results from evolution of ancestral sequence consisting of GTC codons, which contained CpG dinucleotides at the first and third positions of all codon sites, were similar to those for TCG simulations above. The CpG-adjusted estimates performed better, as they were close to the true values. Also, classical estimates of dN/dS did not converge with those from CpG-adjusted estimates even when d reached 1.0.
In contrast, when CGT was repeated for generating the ancestral sequence, which contained CpG dinucleotides at the first and second positions of all codon sites, classical methods overestimated dN/dS considerably when d was small, but CpG-adjusted estimates did not suffer from such problems. As evolution proceeded, the estimate from the classical method became increasingly closer to the true value because of the decay in the number of CpG sites in the first two codon positions, whereas the CpG-adjusted method continued to perform much better.
Similar results were obtained when the ratio of the average value of dN to the average value of dS, (average dN)/(average dS), instead of the average value of dN/dS, was examined (supplementary fig. S3, Supplementary Material online). Similar results were also obtained under the assumptions that μti(CpG):μtv(CpG):μti(non-CpG):μtv(non-CpG) = 40:1:4:1 (supplementary figs. S4 and Supplementary Data, Supplementary Material online) and 40:10:4:1 (supplementary figs. S6 and Supplementary Data, Supplementary Material online).
Simulation Results for Single-Site Analysis
The results obtained from the computer simulation for the single-site analysis under the assumption that μti(CpG):μtv(CpG):μti(non-CpG):μtv(non-CpG) = 40:4:4:1 are summarized in figure 2. As in the case of all-sites analysis, the average values of dN/dS obtained were similar for the classical and CpG-adjusted methods when the frequencies for 61 sense codons were assumed to be the same or average codon frequencies over all human protein–coding genes were used in generating the ancestral sequence, or when the sequence consisted exclusively of TGC, CTG, GCT, or CpG. In all of these cases, dN/dS estimates were close to the true values. However, many of the estimates were slightly larger than the true values. This is because dN/dS was inflated for some replicates in the simulation, where dS was very small due to sampling errors. Indeed, the estimates became very close to the true values when the ratio of averages, (average dN)/(average dS), was taken (supplementary fig. S8, Supplementary Material online).
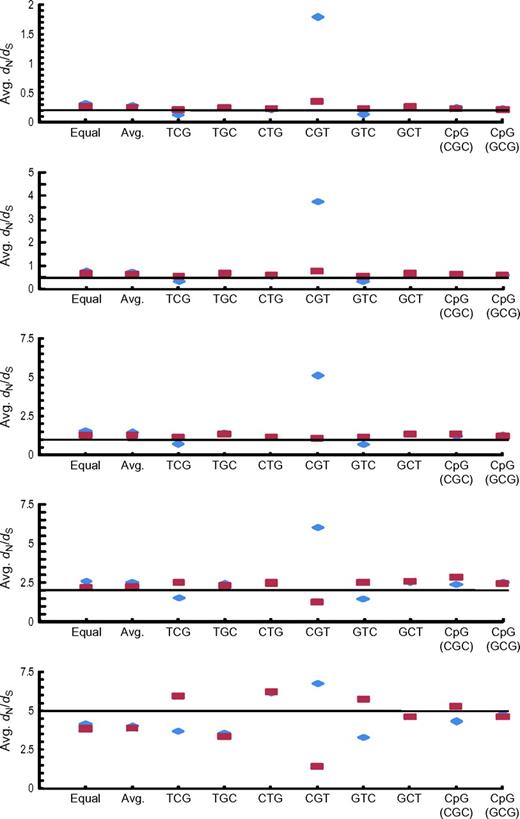
The average (Avg.) dN/dS values (ordinate) obtained in the computer simulation for the single-site analysis. The estimates using the CpG-adjusted method (red dots) assumed μti(CpG):μtv(CpG):μti(non-CpG):μtv(non-CpG) = 40:4:4:1, and the classical method (blue dots) calculation assumed μti(CpG):μtv(CpG):μti(non-CpG):μtv(non-CpG) = 4:1:4:1. The black line indicates the true value. The graphs are arranged in rows according to the true values of dN/dS (0.2, 0.5, 1.0, 2.0, and 5.0 from the top to the bottom). Labels in each graph indicate the procedures the ancestral sequence was generated (Equal: frequencies for 61 sense codons were assumed to be the same; Avg.: average codon frequencies over all human protein–coding genes were used; TCG, TGC, CTG, CGT, GTC, and GCT: TCG, TGC, CTG, CGT, GTC, or GCT was repeated, respectively; and CpG (CGC) and CpG (GCG): CpG was repeated and the ancestral codon was CGC or GCG, respectively).
The dN/dS estimates obtained for sequences that evolved from the ancestral sequence consisting of TCG or GTC were smaller when using the classical method, whereas dN/dS obtained from our CpG-adjusted method was close to the true value (fig. 2). In contrast, application of the classical method to the comparison of descendants of ancestral sequences consisting of CGT produced dN/dS values that were considerably larger than the true value, whereas dN/dS values obtained from the CpG-adjusted method were again close to the true value. It should be noted that, when the true value of dN/dS was 5.0, the average dN/dS appeared to be underestimated with the CpG-adjusted method, whereas dN/dS was closer to the true value with the classical method. This is because dN/dS was incalculable (dS = 0 and dN > 0) for most of the codon sites due to sampling errors, and these sites were eliminated from the computation of the average value of dN/dS. Indeed, (average dN)/(average dS) obtained from the CpG-adjusted method was much closer to the true value than that obtained from the classical method, which was considerably larger than the true value (supplementary fig. S8, Supplementary Material online).
Similar results were obtained under the assumptions that μti(CpG):μtv(CpG):μti(non-CpG):μtv(non-CpG) = 40:1:4:1 (supplementary figs. S9 and Supplementary Data, Supplementary Material online) and 40:10:4:1 (supplementary figs. S11 and Supplementary Data, Supplementary Material online).
Discussion
In both the all-sites and single-site analyses, the estimates of dN/dS were close to the true value for the classical and CpG-adjusted methods when the ancestral sequence was generated assuming the equal frequencies for 61 sense codons (effective number of codons Nc = 61.0) (Wright 1990) or the average codon frequencies over all human protein–coding genes (Nc = 54.6). Similar results were observed when the sequence was generated as a repeat of TGC, CTG, or GCT, which did not contain any CpG dinucleotides. These results suggest that the effect of hypermutability on the estimation of dN/dS is small as long as the codon usage bias is weak or the number of CpG dinucleotides is small in the sequences analyzed. In these cases, the proportions of synonymous and nonsynonymous sites overlapping with CpG dinucleotides do not appear to be very different.
However, the presence of CpGs in the ancestral sequences (TCG and GTC sequences) produces sequences for which dN/dS estimates obtained without accounting for the hypermutability of CpGs are smaller than the true value. In TCG and GTC, the first and second codon positions are essentially nonsynonymous sites, whereas the third codon position is a synonymous site. Therefore, in the ancestral sequence, 100% of synonymous sites and 50% of nonsynonymous sites overlap with CpG dinucleotides and are thus hypermutable. When dN/dS is computed without adjusting for CpG hypermutability, both of the rates of synonymous and nonsynonymous mutations are underestimated. However, the degree of underestimation for the former is greater than that for the latter, because a greater fraction of synonymous sites is hypermutable. As a result, the ratio of sN to sS is inflated, and dN/dS is underestimated. This lower than expected dN/dS ratio would produce spurious signatures of negative selection even when the evolution was strictly neutral or driven by positive selection.
In contrast, computer simulations with CGT ancestral sequences produced estimates of dN/dS from the classical method that were greater than the true value, because only the rate of nonsynonymous mutation was underestimated (0% of synonymous sites and 100% of nonsynonymous sites overlapped with CpG dinucleotides) and thus sN/sS was deflated. Therefore, positive selection may be detected even when the evolution was strictly neutral or driven by negative selection.
The importance of the relative proportions of synonymous and nonsynonymous sites overlapping with CpG dinucleotides for the estimation of dN/dS was further investigated by generating the ancestral sequence consisting only of CpG. In the all-sites analysis, the estimates of dN/dS were similar when using the classical and CpG-adjusted methods at the earliest stages of evolution, where the proportions of synonymous and nonsynonymous sites overlapping with CpGs were both close to 100%. Similar estimates of dN/dS from the classical and CpG-adjusted methods were also observed in the single-site analysis.
In the computer simulation for the all-sites analysis, it was observed that even when the codon usage bias of the ancestral sequence was extremely high and dN/dS estimates were biased in the classical method at the beginning of the evolutionary simulation, the bias diminished as d from the ancestral sequence increased, apparently because the number of CpG dinucleotides decreased during evolution. Therefore, if no selection has operated to maintain CpGs in the protein-coding nucleotide sequence of vertebrates and plants during evolution, only a small number of CpGs is expected to be contained in the extant species of these organisms, and the bias in the estimation of contemporary dN/dS will be negligible.
However, functional constraints operating at the amino acid sequence level may retain amino acids encoded by the codons containing a CpG or those ending with a cytosine and starting with a guanine, where CpGs may be maintained as a by-product (e.g., Subramanian and Kumar 2003; and see Protamine 1 discussion below). In addition, the GC-biased gene conversion may increase the G + C-content in mammals (Berglund et al. 2009; Galtier et al. 2009), and CpGs may also be produced as a by-product.
Clearly, the direction (overestimation or underestimation) and magnitude of the bias in the estimation of dN/dS caused by the hypermutability at CpG dinucleotides are determined not only by the number of CpGs, but also by the relative proportions of synonymous and nonsynonymous sites overlapping with CpGs that are methylated. However, the germline methylation status of CpG sites is usually unknown. Furthermore, it is difficult to estimate the relative ratios of μti(CpG):μtv(CpG):μti(non-CpG):μtv(non-CpG) for the sequences analyzed, because the number of CpGs contained in most sequences is rather small. In such a situation, we recommend that dN/dS be computed using the classical and CpG-adjusted methods described here for one or a few realistic relative ratios when testing for natural selection. We have done this for protamine 1 in order to examine how the consideration of hypermutability of CpG may affect the evolutionary inferences of adaptive evolution, because 15% of all amino acids are Arginines encoded by CGN in protamine 1 (Rooney et al. 2000). Based on our simulation results, one would expect that the previous use of classical methods to estimate dN/dS has produced biased estimates of dN/dS for protamine 1.
Prior to conducting a CpG-adjusted analysis of protamine 1 sequences, we examined evidence for the possible methylation of the coding sequences of protamine 1 CpG sites. To begin with, no CpG islands (G + C content ≥ 55%, [observed CpG]/[expected CpG] ≥ 0.65, and length ≥ 500-nt sites; Takai and Jones 2002) were found in the coding region of protamine 1 or in 1,000-nt sites flanking this gene in the genomes of human, chimpanzee (P. troglodytes), macaque (M. mulatta), orangutan (Pongo abelii), and marmoset (Callithrix jacchus). Experimental studies in mice have indicated that the CpGs in the coding region of protamine 1 are highly methylated in the germline cells (e.g., round spermatids and motile spermatozoa) and that they are partly methylated in somatic cells and testes (Choi et al. 1997; Borghol et al. 2008). Therefore, CpG dinucleotides in the coding region of protamine 1 are likely hypermutable. Furthermore, coding region of protamine 1 is CpG rich despite their hypermutability because many Arginines are required for protamine 1 to bind to acidic DNA in sperms and to interact with an acidic amino acid cluster in β subunit of casein kinase II for activating it in fertilized eggs (Ohtsuki et al. 1996). There is also evidence that methylation at CpGs in the coding region of protamine 1 regulates its expression (Choi et al. 1997; Borghol et al. 2008). These observations suggest that methylated CpG dinucleotides in the coding region of protamine 1 are maintained by the functional constraints operating at both the amino acid and nucleotide sequence levels.
Therefore, we compared the results obtained from the all-sites analysis of protamine 1 genes among primates under the assumptions that μti(CpG):μtv(CpG):μti(non-CpG):μtv(non-CpG) = 4:1:4:1 (classical methods) and 40:4:4:1 (CpG-adjusted method). These results are summarized in table 1. Of a total of 171 pairwise comparisons, 19 cases were excluded from the analysis because dN/dS was incalculable (dS = 0 and dN > 0). The number of cases with dN/dS > 1 (115) was significantly greater than that with dN/dS ≤ 1 (37) when using the classical method (P < 10−9; χ2 test). The average value of dN/dS was 1.688, and (average dN)/(average dS) was 1.366, suggesting that positive selection has extensively operated on protamine 1 in primates, as inferred previously in many studies.
The dN/dS Values Estimated in the All-Sites Analysis of Protamine 1 Genes from Primates
| Species | HAS | PTR | PPA | GGO | PPY | HLA | EPA | MMU, PCY | CGU | PBA | SEN, TVE | TJO | TJO | TFR, TGE | TOB, TPH, TCR | TPI | NLA | SSC | ASP |
| HSA | N.A. | N.A. | 1.436 | 0.936 | 0.485 | 0.713 | 0.700 | 0.948 | 0.829 | 0.551 | 0.744 | 0.827 | 0.821 | 0.655 | 0.574 | 0.875 | 0.505 | 0.396 | |
| PTR | N.A.a | N.A. | 0.912 | 1.484 | 0.904 | 0.766 | 0.753 | 0.850 | 0.662 | 0.586 | 0.794 | 0.750 | 0.899 | 0.652 | 0.623 | 0.937 | 0.522 | 0.376 | |
| PPA | N.A. | N.A. | 0.933 | 1.518 | 0.924 | 0.655 | 0.643 | 0.735 | 0.698 | 0.508 | 0.689 | 0.643 | 0.764 | 0.554 | 0.530 | 0.956 | 0.461 | 0.285 | |
| GGO | 2.777b | 1.915 | 1.994 | 0.603 | 0.450 | 0.506 | 0.497 | 0.660 | 0.626 | 0.425 | 0.549 | 0.606 | 0.595 | 0.459 | 0.438 | 0.623 | 0.386 | 0.229 | |
| PPY | 1.772 | 3.038 | 3.166 | 1.306 | 0.340 | 0.330 | 0.256 | 0.531 | 0.434 | 0.272 | 0.340 | 0.451 | 0.349 | 0.313 | 0.268 | 0.375 | 0.234 | 0.234 | |
| HLA | 0.975 | 1.961 | 2.042 | 1.022 | 0.769 | 0.695 | 0.562 | 0.905 | 0.737 | 0.492 | 0.666 | 0.738 | 0.738 | 0.535 | 0.515 | 0.779 | 0.413 | 0.277 | |
| EPA | 1.478 | 1.735 | 1.507 | 1.203 | 0.770 | 1.661 | N.A. | N.A. | N.A. | 0.690 | 2.168 | 2.625 | N.A. | 1.030 | 0.788 | N.A. | 0.970 | 0.538 | |
| MMU, PCY | 1.490 | 1.750 | 1.519 | 1.213 | 0.612 | 1.374 | N.A. | N.A. | N.A. | 0.553 | 1.736 | 2.172 | N.A. | 0.805 | 0.580 | N.A. | 0.776 | 0.532 | |
| CGU | 1.915 | 1.873 | 1.648 | 1.532 | 1.192 | 2.116 | N.A. | N.A. | N.A. | 1.108 | 3.480 | 3.108 | N.A. | 1.714 | 1.433 | N.A. | 1.284 | 0.705 | |
| PBA | 1.765 | 1.541 | 1.649 | 1.533 | 1.000 | 1.805 | N.A. | N.A. | N.A. | 0.929 | 2.920 | 2.558 | N.A. | 1.423 | 1.171 | N.A. | 1.043 | 0.839 | |
| SEN, TVE | 1.128 | 1.300 | 1.150 | 0.991 | 0.622 | 1.153 | 1.534 | 1.255 | 2.411 | 2.112 | 0.000 | 0.195 | 0.101 | 0.095 | 0.061 | 0.904 | 0.426 | 0.345 | |
| TJO | 1.483 | 1.710 | 1.512 | 1.240 | 0.753 | 1.516 | 4.697 | 3.843 | 7.384 | 6.469 | 0.000 | N.A. | 0.210 | 0.132 | 0.096 | 2.833 | 0.598 | 0.456 | |
| TJO | 1.605 | 1.570 | 1.372 | 1.335 | 0.961 | 1.641 | 5.561 | 4.706 | 6.432 | 5.535 | 0.415 | N.A. | 0.430 | 0.204 | 0.198 | 3.354 | 0.674 | 0.510 | |
| TFR, TGE | 1.507 | 1.771 | 1.537 | 1.228 | 0.703 | 1.541 | N.A. | N.A. | N.A. | N.A. | 0.204 | 0.417 | 0.835 | 0.226 | 0.000 | N.A. | 0.888 | 0.443 | |
| TOB, TPH, TCR | 1.219 | 1.302 | 1.131 | 0.962 | 0.642 | 1.133 | 2.092 | 1.675 | 3.405 | 2.958 | 0.198 | 0.270 | 0.406 | 0.414 | 0.104 | 1.365 | 0.640 | 0.341 | |
| TPI | 1.110 | 1.303 | 1.132 | 0.963 | 0.575 | 1.136 | 1.663 | 1.250 | 2.960 | 2.522 | 0.134 | 0.205 | 0.410 | 0.000 | 0.204 | 1.071 | 1.771 | 0.586 | |
| NLA | 1.614 | 1.871 | 1.952 | 1.305 | 0.766 | 1.650 | N.A. | N.A. | N.A. | N.A. | 1.815 | 5.557 | 6.424 | N.A. | 2.514 | 2.081 | 1.288 | 0.713 | |
| SSC | 1.143 | 1.299 | 1.167 | 1.016 | 0.604 | 1.079 | 2.385 | 1.939 | 3.094 | 2.613 | 1.062 | 1.447 | 1.595 | 1.961 | 1.438 | 3.995 | 2.850 | 0.667 | |
| ASP | 0.921 | 0.950 | 0.756 | 0.632 | 0.641 | 0.759 | 1.373 | 1.385 | 1.763 | 2.154 | 0.905 | 1.157 | 1.265 | 1.038 | 0.814 | 1.409 | 1.627 | 1.707 |
Note.—Values above the diagonal are for CpG-adjusted analysis (μti(CpG):μtv(CpG):μti(non-CpG):μtv(non-CpG) = 40:4:4:1) and those below the diagonal are without CpG adjustment (μti(CpG):μtv(CpG):μti(non-CpG):μtv(non-CpG) = 4:1:4:1).
Not applicable because dS = 0.
The values were colored red and black when they were > 1 and ≤1, respectively.
However, the CpG-adjusted estimates of dN/dS reduced the number of cases with dN/dS > 1 from 115 to 25. Now, the number of dN/dS > 1 pairs is significantly smaller than the number with dN/dS ≤ 1 (127) (P < 10−15; χ2 test). In addition, the average value of dN/dS and (average dN)/(average dS) also dropped from 1.688 and 1.366 to 0.776 and 0.603, respectively, suggesting that negative selection has operated on protamine 1 in primates. The relative frequencies for the cases with dN/dS > 1 and dN/dS ≤ 1 were significantly different according to whether dN/dS was computed with or without accounting for hypermutability (P < 10−25; Fisher's exact test). Similar results were obtained even when 19 cases with dS = 0 and dN > 0 were regarded as dN/dS > 1 (data not shown).
To examine the relative effects of elevated transitional (μti(CpG)) versus transversional (μtv(CpG)) rates on the estimation of dN/dS, the protamine 1 data were also analyzed under the assumptions that μti(CpG):μtv(CpG):μti(non-CpG):μtv(non-CpG) = 40:1:4:1, 40:10:4:1, 4:4:4:1, or 20:4:4:1. The results clearly showed that the elevated transversional rates due to hypermutability of CpGs do not have a significant effect on the inference of negative selection (supplementary table S2, Supplementary Material online) and that the elevated transitional rates dictate whether one would infer positive selection (relative ratio of 4:4:4:1) or negative selection (relative ratio of 20:4:4:1) (supplementary table S3, Supplementary Material online).
In the above analyses, we assumed average rate ratios that have been derived from genome wide analysis. However, μti(CpG) is reported to vary along the human genome due to the variation in the local G + C content (Fryxell and Moon 2005). To examine the relative ratio of μti(CpG):μtv(CpG):μti(non-CpG):μtv(non-CpG) in the genomic region around the protamine 1 gene, 10,000-nt sites upstream and downstream each of the coding region of protamine 1 in the human genome, as well as the corresponding regions in the chimpanzee and macaque genomes, were retrieved using the University of California Santa Cruz Genome Browser (http://genome.ucsc.edu/) (Kent et al. 2002). The orthologous sequences from human, chimpanzee, and macaque were aligned with ClustalW, and the coding regions of protamine 1, protamine 2, and protamine 3 were masked. The reliability of the alignment for noncoding regions was assessed by using the sliding window of 11-nt sites: The central site in a window was judged as well aligned if 8 or more of the other (10) sites were conserved among the 3 species. (The results mentioned below were robust to the change in threshold value assumed; results not shown.) For each of well-aligned sites, the ancestral status at the interior node of the phylogenetic tree for the three species was inferred by the maximum parsimony method (Fitch 1971).
For a total of 13,762 sites where the ancestral status was inferred unambiguously, the nucleotide in the ancestral sequence was compared with that in the human or chimpanzee sequence, and each nucleotide difference was classified as a transition or a transversion that occurred at a CpG or at a non-CpG site of the ancestral sequence. It was observed that 13 transitions and 2 transversions occurred for 180 CpG sites and 142 transitions and 72 transversions occurred for 13,582 non-CpG sites. If we assume that the noncoding region is largely nonfunctional and its substitution pattern reflects the mutation pattern, then the rate ratio μti(CpG):μtv(CpG):μti(non-CpG):μtv(non-CpG) is estimated to be 27.2:2.1:3.9:1.0, which is not very different from the relative ratios we assumed in the present study. Indeed, negative selection was supported for protamine 1 when the estimated ratio was used in the computation (data not shown).
In the above, we have primarily focused on the effect of the hypermutability of CpGs on the assumption of equality for rS and rN under strictly neutral evolution. However, many other factors may also disturb this assumption (e.g., Filipski et al. 2007). It has been proposed that mRNAs containing codons that are recognized by less abundant tRNAs are prone to be mistranslated. Because mistranslated proteins may be misfolded and toxic, natural selection may operate to form the codon usage bias toward codons that are recognized by more abundant tRNAs (Drummond and Wilke 2008). It has also been reported that CpG dinucleotides are suppressed in bacterial and viral genomes, because unmethylated CpGs, which are characteristic to these organisms, may stimulate innate immune responses in vertebrates (Greenbaum et al. 2008; Hoelzer et al. 2008). For these cases, it may be important to correct the effect of natural selection operating at the nucleotide sequence level for the comparison of rS and rN (Subramanian and Kumar 2003, 2006; Tamura et al. 2004; Yang and Nielsen 2008).
New methods developed in the present study are implemented in the program package ADAPTSITE (version 1.5) (Suzuki et al. 2001), which is available from http://www.bio.psu.edu/People/Faculty/Nei/Lab/software.htm. We thank Ms Kristi Garboushian for providing editorial comments and Ms Mindy Ricardo for uploading ADAPTSITE. We are indebted to Jose C. Clemente and two anonymous reviewers for providing scientific comments. This work was supported in part by KAKENHI 20580007 to Y.S. and a research grant from National Institutes of Health to S.K.
References
Author notes
Asger Hobolth, Associate Editor
