


Abstract
The relationships at the base of the metazoan tree have been difficult to robustly resolve, and there are several different hypotheses regarding the interrelationships among sponges, cnidarians, ctenophores, placozoans, and bilaterians, with each hypothesis having different implications for the body plan of the last common ancestor of animals and the paleoecology of the late Precambrian. We have sequenced seven nuclear housekeeping genes from 17 new sponges, bringing the total to 29 species analyzed, including multiple representatives of the Demospongiae, Calcarea, Hexactinellida, and Homoscleromorpha, and analyzed a data set also including six nonmetazoan outgroups and 36 eumetazoans using a variety of phylogenetic methods and evolutionary models. We used leaf stability to identify rogue taxa and investigate their effect on the support of the nodes in our trees, and we identified clades most likely to represent phylogenetic artifacts through the comparison of trees derived using different methods (and models) and through site-stripping analyses. Further, we investigated compositional heterogeneity and tested whether amino acid composition bias affected our results. Finally, we used Bayes factors to compare our results against previously published phylogenies. All our maximum likelihood (ML) and Bayesian analyses find sponges to be paraphyletic, with all analyses finding three extant paraphyletic sponge lineages, Demospongiae plus Hexactinellida, Calcarea, and Homoscleromorpha. All but one of our ML and Bayesian analyses support the monophyly of Eumetazoa (here Cnidaria + Bilateria) and a sister group relationship between Placozoa (here Trichoplax adhaerens) and Eumetazoa. Bayes factors invariably provide decisive support in favor of poriferan paraphyly when compared against either a sister group relationship between Porifera and Cnidaria or with a monophyletic Porifera with respect to a monophyletic Eumetazoa. Although we were able to recover sponge monophyly using our data set, this was only possible under unrealistic evolutionary models, if poorly performing phylogenetic methods were used, or in situations where the potential for the generation of tree reconstruction artifacts was artificially exacerbated. Everything considered, our data set does not provide any support for a monophyletic Diploblastica (here Placozoa + Cnidaria + Porifera) and suggests that a monophyletic Porifera may be better seen as a phylogenetic artifact.
Introduction
Phylogenetic studies based solely on morphology have always found sponges to be monophyletic, a result of the uniqueness of the sponge body plan and the water canal system (Nielsen et al. 1996; Zrzavy et al. 1998; Peterson and Eernisse 2001). It was with surprise, then, that some initial 18S ribosomal DNA studies incorporating both siliceous and calcareous sponges found that the calcareous sponges were more closely related to eumetazoans than to demosponges, albeit often without strong statistical support (Cavalier-Smith et al. 1996; Collins 1998; Borchiellini et al. 2001; Peterson and Eernisse 2001). Given the detailed similarities between the body plans of demosponges and calcareans, these results suggested that what were thought of as sponge synapomorphies, such as the water canal system, could have been metazoan symplesiomorphies. However, in some cases, this result was difficult to interpret as several studies (Cavalier-Smith et al. 1996; Peterson and Eernisse 2001) found that the calcareous sponges were nested within the eumetazoans as the sister group to ctenophores, an almost certainly incorrect topology, and thereby calling into question the accuracy of those trees. Despite this result, other molecular data sets, for example, nuclear housekeeping genes (Kruse et al. 1998; Peterson and Butterfield 2005; Sperling et al. 2007), 28S rDNA (Medina et al. 2001), or increased taxonomic sampling with 18S rDNA (Wallberg et al. 2004), continued to find a paraphyletic “Porifera.” Indeed, several recent analyses have found that the homoscleromorph Oscarella carmela was even more closely related to eumetazoans than were the calcareous sponges, a result not totally unexpected given morphological considerations such as their possession of a basal lamina and a true acrosome (reviewed in Sperling et al. 2007; Nielsen 2008; Ereskovsky et al. 2009).
More recently, however, several studies using an expressed sequence tag (EST) methodology or complete mitochondrial genomes suggested that sponges, at least those sampled, were monophyletic (Jiménez-Guri et al. 2007; Dunn et al. 2008; Lavrov et al. 2008; Philippe et al. 2009; Schierwater et al. 2009), and a recent ribosomal DNA study showed that these genes harbor some, albeit not significant, signal for “poriferan” monophyly (Dohrmann et al. 2008). Some recent studies have also found a sister group relationship between either a monophyletic Porifera and Cnidaria (Dunn et al. 2008; Lavrov et al. 2008) or a monophyletic Porifera and Coelenterata (Schierwater et al. 2009).
Sponge relationships have a significant impact on our understanding of the palaeoecology of the last common ancestor of Metazoa. A basal position for sponges with respect to all other animals, irrespective of poriferan monophyly versus paraphyly, suggests that microphagous feeding is most likely primitive for Metazoa, given that choanoflagellates are the sister group of animals (Carr et al. 2008; Ruiz-Trillo et al. 2008). But if sponges are nested inside Eumetazoa (i.e., sponges as the sister group of Cnidaria or Coelenterata), then the last common ancestor of all metazoans might have been a mobile, macrophagous predator with a gut and nervous system (Miller and Ball 2008; and see below), an inference with obvious paleoecological implications (Peterson et al. 2005). In addition, because comparative genomic analyses have suggested that most metazoan transcription factor families were acquired at the base of Metazoa, with subsequent diversifications within those families at the base of Eumetazoa and/or the base of Bilateria (Ryan et al. 2006; Larroux et al. 2008; King et al. 2008), nesting poriferans within Eumetazoa would then demand even more secondary gene loss in sponges than previously hypothesized (e.g., Peterson and Sperling 2007).
The EST and mitochondrial genome studies suggesting that sponges are nested within Eumetazoa are often plagued with very limited taxon sampling, usually including only a handful of demosponges, two homoscleromorphs at most, and often no calcareans. Indeed, the recent study of Philippe et al. (2009), who analyzed nine sponge species from all four major poriferan groups, recovered the traditional tree with Porifera as the sister group of a clade consisting of the traditional eumetazoan taxa (i.e., cnidarians, ctenophores, and bilaterians). Thus, because taxon sampling can have a strong effect on the phylogenetic accuracy (see also Graybeal 1998; Zwickl and Hillis 2002; Hillis et al. 2003), we have sequenced the seven nuclear housekeeping genes used by Peterson and Butterfield (2005) and Sperling et al. (2007), from 17 new sponge species. These genes were initially chosen by Peterson et al. (2004) because they were both phylogenetically accurate and they spanned a range of evolutionary rates (Mushegian et al. 1998), and they do not show any obvious paralogy problem among the considered taxa (Peterson et al. 2004). This increased taxon sampling allowed us to test alternative hypotheses of poriferan relationships using the largest taxonomic data set of protein-coding genes assembled to date including multiple representatives of the hexactinellids (3 species), calcareans (4 species), homoscleromorphs (2 species), and demosponges (20 species). In addition, our data set included a large sampling of eumetazoans (36 species) and multiple outgroups (6 species). Here, this data set is used to (I) test hypotheses of sponge relationships (i.e., sponge monophyly vs. paraphyly) and (II) test whether Porifera and Cnidaria are each other's sister taxon and (III) to test the intrarelationships among demosponges and ascertain the robustness of the G1–G4 clades as proposed by Borchiellini et al. (2004).
Our results find support for the paraphyly of Porifera and the monophyly of Epitheliozoa (Homosclermorpha + Placozoa + Eumetazoa), a sister group relationship between Placozoa and Eumetaoza, and the monophyly of Eumetazoa (here represented by Cnidaria and Bilateria only). We were also able to show that, at the least according to our data set, the monophyly of Porifera may be better seen as a tree reconstruction artifact as this group is systematically recovered when analyses are performed using inadequate methods (e.g., Neighbor-Joining [NJ] with mean observed distances) or from the analysis of a data set that we generated by pooling sites in our alignment that could be identified as being either fast evolving or constant (i.e., a data set of fast-evolving sites in which site-specific rate heterogeneity was artificially exacerbated for experimental purposes). We conclude that, because at least according to our data set sponges appear to represent a grade of organization which is basal to Eumetazoa, the origin of Eumetazoa (including Ctenophora, see Philippe et al. 2009) and of the eumetazoan gut and nervous system is best understood when properly rooted within the context of sponge biology and evolution.
Materials and Methods
Data Collection
Ircinia strobilina, Aplysina fulva, Halisarca sp. (currently being described by M.C. Diaz), Verongula rigida, Spirastrella coccinea, Geodia gibberosa, and Plakortis angulospiculatus were collected at the STRI Bocas del Toro research station, Panama. Rhabdocalyptus dawsoni and Aphrocallistes vastus were collected by Sally Leys (University of Alberta) at San Jose Islets, Barkley Sound, British Columbia, Canada. Clathrina cerebrum was collected by Dorte Janussen (Senckenberg, Frankfurt, Germany) near Rovinj, Croatia. Damiria (Xytopsene) sp. and Cinachyrella alloclada were purchased from Gulf Specimens Marine Supply (Panacea, FL). Tethya aurantia and Leucilla nuttingi were purchased from Santa Barbara Marine Biologicals (Santa Barbara, California). Suberites sp., Haliclona sp., and Mnemiopsis leidyi were purchased from the Marine Biological Laboratory (Woods Hole, MA). Chalina sp. was purchased from Gulf of Maine Marine Supply (Pembroke, Maine).
Partial sequences for seven nuclear housekeeping genes, namely aldolase, methionine adenosyltransferase, ATP synthase beta chain, catalase, elongation factor 1 alpha, triosephosphate isomerase, and phosphofructokinase, were obtained from these taxa following the protocol outlined in Sperling et al. (2007). Total RNA was prepared from live animals or from specimens preserved in 75% ethanol or RNAlater (Ambion) using a one-step Trizol method (GIBCO-BRL). cDNA synthesis used the RETROSCRIPT kit (AMBION), with 1–3 ug of total RNA for both the random decamers and the oligo dT reactions, which were then pooled. Polymerase chain reaction (PCR) amplification, cloning, and sequencing used the same PCR conditions and primers as in Sperling et al. (2007), with the exception that some of the genes were ligated for 5 min at room temperature into the Stratagene Strataclone vector system. Data for Heterochone calyx were collected during an EST project (Philippe et al. 2009) and provided prior to publication by G. Wörheide. Sequences from Dictyostelium discoideum, Saccharomyces cerevisiae, Schizosaccharomyces pombe, Neurospora crassa, Gibberella zeae, Monosiga brevicollis, Acropora millepora, and Trichoplax adhaerens were downloaded from genomic traces on the NCBI trace server. All other taxa were taken from Sperling et al. (2007). Sequences were edited, translated, and aligned using MACVECTOR v.10.0.2 (Genetics Computer Group) using the default settings in ClustalW, with the final alignment completed by eye. No positions were excluded from the analysis. The final alignment scored 71 taxa and 2,057 amino acid positions. It had 89.3% of the cells filled after the removal of minor indels, and no taxon had less than five of the seven genes. Because we were unable to amplify more than three genes from the ctenophore M. leidyi and our minimal requirement of five genes was not present in public databases for any ctenophoran species, we were unable to include a representative of this phylum in the analysis. Thus, throughout this paper, we are not testing the monophyly of Eumetazoa in the classical sense but rather the monophyly of Cnidaria + Bilateria with respect to sponges and placozoans. New sequences are submitted to GenBank under accession numbers GQ330931–GQ331026.
Phylogenetic Analyses
First we investigated, using maximum likelihood (ML) mapping under Whelan and Goldman (WAG) + G, whether, in principle, our data set conveyed sufficient phylogenetic signal to resolve the relationships among the considered taxa. This was done using Tree-Puzzle 5.2 (Schmidt et al. 2002).
Phylogenetic trees were then built from our 71-taxon data set (Supplementary Material online), which consisted of 6 nonmetazoan outgroups, 29 sponges, and 36 eumetazoans, using ML, Bayesian analysis, NJ with mean observed distances, and maximum parsimony (MP). Bayesian analyses were performed under WAG, WAG + G (WAG-G), mixed empirical general time reversible (GTR) models + G (MEM), mixed empirical GTR models + G + I (MEM-GI), mechanistic GTR + G (GTR), CAT + G (CAT), CAT with WAG exchange rates + G (CAT-WAG), CAT with GTR exchange rates + G (CAT-GTR), and Breakpoint-CAT. Bayesian MEM and MEM-GI analyses were performed using MrBayes (Ronquist and Huelsenbeck 2003). Bayesian analyses under WAG, WAG-G, and GTR were performed using both MrBayes and Phylobayes (Lartillot and Philippe 2004), whereas all the CAT-based analyses (with the exception of the Breakpoint-CAT analysis) were performed using Phylobayes. Breakpoint-CAT was implemented using NH-Phylobayes (see below the “Compositional Heterogeneity”). ML analyses were performed under MEM in RaxML v.7 (Stamatakis et al. 2005; Stamatakis 2006), whereas MP and NJ analyses were performed using PAUP4b10 (Swofford 1998).
The bootstrap was used to estimate the support for the nodes in the ML (100 replicates), MP (1,000 replicates with 10 sequence addition per replicate and the multree option turned off), and NJ (1,000 replicates) trees. Posterior probabilities were used to express the support for the nodes in the Bayesian phylogenies. Further details of how the Bayesian and ML analyses were implemented are reported in the Supplementary Material online.
We implemented a composite model selection strategy to identify, among the various models we used (WAG, WAG-G, MEM, MEM-GI, GTR, CAT, CAT-WAG, and CAT-GTR), the one providing the best fit to our data set. We thus selected the tree inferred under the best fitting model as the one representing the most likely evolutionary scenario for our data set. This model selection strategy was completed using the Akaike information criterion (as implemented in Modelgenerater; Keane et al. 2006), Bayes factors (see Nylander et al. 2004), and cross-validation (Stone 1974). Methodological details of these analyses, which suggested GTR to be the best fitting among the classic time reversible models we tested and CAT-GTR to be the best fitting among the mixture model we tested and the overall best fitting model, are presented in the Supplementary Material online.
Results of Bayesian analyses performed using both MrBayes and Phylobayes (WAG, WAG-G, and GTR) were mostly congruent. Accordingly, here we shall discuss Bayesian trees derived using Phylobayes (if not otherwise stated). Bayesian and ML analyses performed under MEM and Bayesian analyses performed under MEM and MEM-GI were also broadly congruent. Bayes factors suggested that MEM-GI fit the data better than MEM (see Results and Supplementary Material online). Accordingly, we shall here discuss only the results obtained in MrBayes under MEM-GI, whereas results of the ML MEM and Bayesian MEM analyses will not be discussed.
Compositional Heterogeneity
Because the presence of compositionally heterogeneous taxa can cause phylogenetic artifacts, the full data set was analyzed using Breakpoint-CAT (Blanquart and Lartillot 2008): A mixture model that explicitly takes into consideration and attempts to model, compositional heterogeneity. Breakpoint-CAT was implemented using NH-Phylobayes (Blanquart and Lartillot 2008). We also performed posterior predictive analysis (Bollback 2005, see also the Phylobayes manual) under CAT-GTR (our overall best fitting model) to test whether our data set included taxa with compositionally heterogeneous sequences. An analysis in which compositionally heterogeneous taxa (as identified in the posterior predictive analysis) were excluded was performed under CAT-GTR.
Sequence Saturation–Dependent Tree Reconstruction Artifacts
We used saturation plots, posterior predictive analysis (Bollback 2005) of sequence saturation (see Phylobayes manual), the comparison of the trees derived in our phylogenetic analyses (particularly those inferred using MP, NJ, and CAT-GTR), and a Slow–Fast (Brinkmann and Philippe 1999) based site-stripping protocol (see also Pisani 2004) to further investigate the possibility that clades potentially supported by our data set could be phylogenetic artifacts. Posterior predictive analysis (implemented using Phylobayes) was used to compare the ability of alternative models to correctly estimate the homoplasy in our data set. Software limitation only allowed using posterior predictive analysis to compare the performance of models implemented in Phylobayes (CAT-GTR, CAT-WAG, CAT, GTR, WAG-G, and WAG).
Saturation plots are visual tools and are not as accurate as posterior predictive analysis in distinguishing the ability of alternative models to analyze a given data set. However, saturation plots allowed comparing the performance of all the models we implemented (MEM-GI included) and to contrast these models against the mean observed distances used in our NJ analyses. For the saturation plot analyses, our overall best fitting model (CAT-GTR) was selected as a reference model (for further methodological details, see Supplementary Material online).
Underparameterized models (e.g., WAG), models that cannot accurately predict the homoplasies observed in our data set, and models (and methods) that generate saturated distances (see Supplementary Material online) are likely to return incorrect tree topologies. Accordingly, we compared trees derived using underparameterized models (e.g., WAG—see Supplementary Material online and Results), trees derived using methods that generated saturated distances (e.g., NJ—see Supplementary Material online and Results), and trees derived using methods that poorly predicted the homoplasies in our data set (e.g., WAG) with our reference CAT-GTR tree to pinpoint similarities and differences and evaluate which of the relationships potentially supported by our data set are most likely artifactual.
A modification of the original slow–fast method of Brinkmann and Philippe (1999) was used to further test the nature of relationships potentially supported by our data set. Slow–Fast was used to identify the evolutionary rate of the characters in our data set, which were then partitioned, generating data sets of slowly and fast-evolving sites. These data sets were analyzed using a variety of phylogenetic methods (MP, NJ, and Bayesian analysis under WAG, CAT, and CAT-GTR; for further methodological details, see Supplementary Material online).
A comparison of the trees derived under MP, NJ, WAG, CAT, and CAT-GTR from our full data set and from data sets derived from the slow–fast analysis was used to pinpoint clades most likely to represent phylogenetic artifacts. This was done by considering that MP, NJ, and WAG should be more susceptible to generating tree reconstruction artifacts, particularly when used to analyze data sets containing only sites identified by our slow–fast protocol as being fast evolving.
Leaf Stability and Support
Rogue taxa (sensuWilkinson 1996) are those that cannot be grouped with confidence. A variety of factors can cause their instability from inadequate data sampling to relatively mild long branch attraction and/or compositional heterogeneity. The last two factors may cause a taxon to jump between two or more alternative positions (the correct one and the artifactual ones) in bootstrap and Bayesian analyses. Accordingly, the presence of unstable taxa negatively impacts support values for the nodes in a tree and can significantly decrease the support for groups of taxa that are otherwise stable and form well-defined monophyletic groups (Wilkinson 1996). We used leaf stability (Thorley and Wilkinson 1999) to identify unstable taxa in our full data set and performed further analyses of reduced data sets (excluding significantly unstable taxa), to clarify the support and relationships among the remaining taxa, and to test whether the inclusion of these unstable taxa was biasing our results. Leaf stability values were calculated using RadCon (Thorley and Page 2000) under each of the three existing measures (maximal, difference, and entropy). Unstable taxa in the Bayesian analyses were identified using trees sampled from the MCMC chains after convergence was reached, whereas leaf stability in the ML analyses was estimated from the bootstrap trees. Leaf stability values are not normally distributed. Accordingly, we considered to be significantly low every leaf stability value that appeared as an outlier (below the first quartile) in a boxplot representation of these values. The Hexactinellida, G2/Myxospongiae, and Calcarea were significantly unstable under every considered model and method of analysis (see Results and supplementary table S6, Supplementary Material online). We thus performed analyses of reduced data sets in which 1) Hexactinellida were excluded, 2) Hexactinellida and the G2/Myxospongiae were excluded, and 3) Hexactinellida, G2/Myxospongiae, and the Calcarea were excluded. Bayesian analyses of the reduced data sets were performed under WAG, WAG-G, MEM-GI, GTR, CAT, CAT-WAG, and CAT-GTR. Finally, a Bayesian analysis of a data set from which both compositionally heterogeneous (see above) and unstable taxa were excluded was performed under CAT-GTR.
Tests of Alternative Hypotheses
Bayes factors (see Nylander et al. 2004) are general statistical tools that can be used, within a Bayesian framework, to compare alternative models (e.g., the trees representing the relationships for a group of taxa) and evaluate the weight of the evidence in favor of one of the compared models (and against the alternative one). Here Bayes factors were calculated (under MEM-GI) to test alternative hypotheses of sponge relationships. We compared the paraphyly hypothesis (as detailed in fig. 1), against alternative, previously published hypotheses. The first hypothesis tested was the Porifera + Cnidaria hypothesis of Schierwater et al. (2009), Dunn et al. (2008), and Lavrov et al. (2008). The second was the “textbook” phylogeny resulting from cladistic analyses of morphological cladograms (Nielsen et al. 1996; Peterson and Eernisse 2001) where a monophyletic Porifera is the sister group of Cnidaria + Bilateria. We excluded the placozoan when calculating Bayes factors as they are irrelevant to testing the phylogenetic relationships of the sponges, and studies that found Cnidaria + Porifera (Lavrov et al. 2008; Schierwater et al. 2009) group them in different positions.
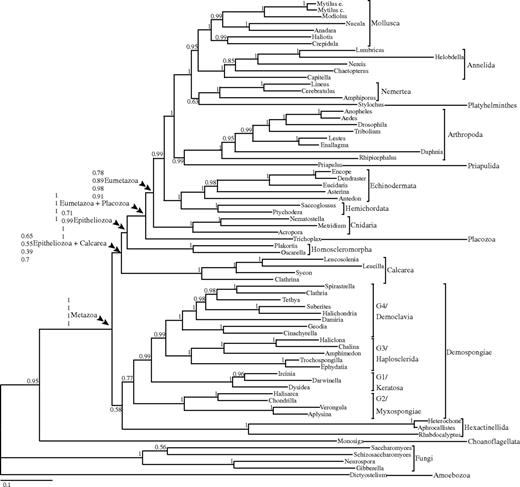
Bayesian phylogeny derived using seven nuclear housekeeping genes (2,057 amino acids) from 65 metazoan taxa and six nonmetazoan outgroups analyzed under the CAT with GTR exchange rates + G model, the overall best fitting model for this data set. Support values are posterior probabilities. For the key nodes in this phylogeny, support values represent (from top to bottom) CAT-GTR (best fitting mixture model and best fitting model overall), GTR (best fitting among the classic GTR models), MEM-GI (best fitting among the mixed empirical GTR models we tested), and WAG-G (best fitting empirical GTR model according for the complete alignment according to the Akaike information criterion, as implemented in Modelgenerator).
To compare every pair of considered hypotheses using Bayes factors, we ran three constrained analyses in MrBayes. Each of these analyses could only visit trees compatible with one of the three considered hypotheses (i.e., monophyletic Porifera as sister to Cnidaria + Bilateria, paraphyletic Porifera as sister to Cnidaria + Bilateria, and Cnidaria + Porifera as sister to Bilateria). For each of the three constrained analysis, two runs of four chains were run for 2,000,000 generations (sampling every 1,000 generations). A burn-in of 1,000,000 generation was used for all analyses, and for each analysis, only the sample from the run that obtained the highest harmonic mean (calculated in MrBayes using the “sump” command) was considered. However, we also investigated, for the full data set, comparisons between the chain with the worst harmonic mean for the analysis constrained to run under the paraphyly hypothesis of figure 1 against the chains with highest harmonic mean obtained under the two alternative hypotheses and the results (not reported) did not change. Bayes factors were calculated only under MEM-GI. Unfortunately, software limitation did not allow us to calculate Bayes factors under the overall best fitting CAT-GTR model and runs under GTR in which the sponges were constrained to be monophyletic did not converge. Bayes factors were calculated in Tracer 1.4.1 (Rambaut and Drummond 2007). Standard errors around the estimated Bayes factors were calculated using the bootstrap (1,000 replicates). Bayes factors were interpreted according to the table of Kass and Raftery (1995).
Results
Model Selection, Compositional Heterogeneity, and Leaf Stability
We first determined the best fitting model for these data. The partition-specific, best fitting, empirical GTR models to be used in the ML MEM analyses were identified using Modelgenerator (see also Supplementary Material online) and are reported in supplementary table S1. WAG-G was the best fitting empirical GTR model selected by the Akaike information criterion when the seven genes were considered a single data partition (see supplementary table S1. Bayes factors (see Supplementary Material online) showed that of the models implemented in MrBayes the best fitting one was GTR and the worst fitting one was WAG (see supplementary table S2). Cross-validation showed that, of the models implemented using Phylobayes, WAG was the worst fitting one. This was followed by WAG-G, GTR, CAT, and CAT-WAG, with CAT-GTR being the best fitting model (supplementary table S3). Merging the results of the Bayes factor and cross-validation analyses, we generated a global ranking of all the considered models, showing that CAT-GTR is the overall best fitting model (supplementary table S4). We thus selected the CAT-GTR tree as the one most likely to correctly represent the phylogenetic relationships for the taxa in our data set (see fig. 1).
Posterior predictive analysis of amino acid homogeneity composition showed that eleven of the species in our data set were compositionally heterogeneous (see supplementary table S5). One of these species was the choanoflagellate M. brevicollis (P = 0.009). This is important because this species represents the sister group of Metazoa, and its presence in our data set could have biased our results. However, analyses performed excluding the compositionally heterogeneous taxa, or using Breakpoint-CAT, recovered results consistent with our CAT-GTR tree (see table 1) suggesting that the presence of M. brevicollis is not biasing our results, despite this taxon not being an optimal outgroup for our data set.
Summary of Support Values for 18 Bayesian Analyses
| Full Data Set | Trimmed Data Set (no unstable) | No Hetero. | ||||||||||||||||
| CAT-GTR | CAT-WAG | CAT | GTRa | WAG-Gb | WAG | MrBayes MEM-GI | Breakpoint-CAT | CAT-GTR (slow sites only) | CAT-GTR | CAT-WAG | CAT | GTR | WAG-G | WAG | MrBayes MEM-GI | No Hetero. only CAT-GTR | No Hetero. and unstable CAT-GTR | |
| Choanozoa | 95 | 99 | 99 | 99 | 100 | 100 | 100 | 100 | 85 | 94 | 100 | 99 | 100 | 100 | 100 | 100 | NC | NC |
| Metazoa | 100 | 100 | 100 | 100 | 100 | 100 | 100 | 100 | 100 | 100 | 100 | 100 | 100 | 100 | 100 | 100 | 100 | 100 |
| Calcarea plus Epitheliozoa | 65 | 63 | 86 | 55 | 70 | X1 | X1 | 80 | 66 | NC | NC | NC | NC | NC | NC | NC | 51 | NC |
| Epitheliozoa | 71 | 46 | 72 | 99 | 100 | 96 | 100 | 77 | 83 | 100 | 100 | 100 | 100 | 100 | 100 | 100 | 81 | 100 |
| Placozoa plus Eumetazoa | 100 | 99 | 99 | 100 | 100 | X2 | 100 | 100 | 99 | 100 | 100 | 94 | 99 | 99 | 96 | 88 | 99 | 98 |
| Eumetazoa | 78 | 72 | 89 | 87 | 91 | X2 | 98 | 69 | 98 | 99 | 99 | 96 | 100 | 100 | 100 | 100 | 98 | 100 |
| Bilateria | 99 | 99 | 92 | 94 | 97 | 98 | 100 | 77 | 76 | 99 | 99 | 96 | 57 | 97 | 73 | 99 | 79 | 86 |
| Demospongia | 79 | 81 | X3 | X3 | X3 | X3 | 52 | X3 | X3 | 100 | 100 | 97 | 100 | 100 | 100 | 100 | 97 | 99 |
| Hexactinellida | 100 | 100 | 100 | 100 | 100 | 100 | 100 | 100 | 100 | NC | NC | NC | NC | NC | NC | NC | 100 | NC |
| Calcarea | 100 | 100 | 100 | 100 | 100 | 100 | 100 | 100 | 100 | NC | NC | NC | NC | NC | NC | NC | 100 | NC |
| Homoscleromorpha | 100 | 100 | 100 | 100 | 100 | 100 | 100 | 100 | 100 | 100 | 100 | 100 | 100 | 100 | 100 | 100 | 100 | 100 |
| G1 | 100 | 100 | 100 | 100 | 100 | 100 | 100 | 100 | 100 | 100 | 100 | 100 | 100 | 100 | 100 | 100 | 100 | 100 |
| G2 | 100 | 100 | 100 | 100 | 100 | 100 | 100 | 100 | 100 | NC | NC | NC | NC | NC | NC | NC | 100 | NC |
| G3 | 100 | 100 | 100 | 100 | 100 | 100 | 100 | 100 | 100 | 100 | 100 | 100 | 100 | 100 | 100 | 100 | 100 | 100 |
| G4 | 100 | 100 | 99 | 100 | 100 | 100 | 100 | 100 | 100 | 100 | 88 | 99 | 100 | X5 | X5 | X5 | 100 | 95 |
| G3 + G4 | 99 | 99 | 99 | 100 | 100 | 100 | 100 | 100 | 100 | 93 | X4 | 56 | 100 | X5 | X5 | X5 | 100 | X4 |
NOTE.—Support values listed are PP percentages. Analyses were performed on the full data set; the slow–fast derived slow only data set; the trimmed data set with the unstable Hexactinellida, G2/Myxospongiae, and Calcarea removed; the data set excluding taxa showing heterogeneous amino acid compositions (No Hetero.); and the data set excluding both the unstable Hexactinellida, G2/Myxospongiae, and Calcarea and the taxa with heterogeneous amino acid composition. Sponge paraphyly is recovered by all analyses, with all finding at least Homoscleromorpha to be more closely related to Eumetazoa than to demosponges. All analyses find Eumetazoa to by monophyletic, and all but one find the placozoan Trichoplax as the sister taxon to Eumetazoa. Eumetazoa = Cnidaria + Bilateria. Epitheliozoa = Homoscleromorpha as sister group to (Placozoa + Eumetazoa). Calcarea (Epithel.) = Calcarea as sister group to Epitheliozoa. NC = taxa not included in that analysis. X = clade not recovered. 1 = Calcarea sister group to all other metazoans. 2 = Placozoa sister group to Bilateria. 3 = Hexactinellida within Demospongiae. 4 = G1 sister group to G4. 5 = G1 within G4.
GTR analyses proved very difficult to converge. Here we show the results of the MrBayes GTR analyses. Phylobayes GTR analysis differed as they found Calcarea as the sister group of all other animals. Support for Calcarea (Epithel.) according to the Phylobayes GTR analysis was 24.8%.
The tree obtained in MrBayes differed from the one found in Phylobayes as the former found Calcarea as the sister group of all the animals. Here we are showing support values from the Phylobayes tree. Support for Calcarea (Epithel.) according to the MrBayes analysis was 36%.
Unstable taxa have a significant impact on the support for other groups as they tend to cluster in multiple alternative positions (Wilkinson 1996). The results varied between analyses and model, but we found three main groups of taxa to be significantly unstable in all our leaf stability analyses (supplementary table S7). Hexactinellids were the most unstable group, and apart from being generally long branched, two of the hexactinellid taxa included in our analyses (H. calyx and R. dawsoni) also had a skewed amino acid composition (P = 0.067). A second group of systematically unstable taxa were the myxospongid or “G2” demosponges. Posterior predictive analysis showed that the myxosponge A. fulva was compositionally extremely heterogeneous (P ∼ 0), whereas V. rigida had a relatively skewed (although not significantly skewed) amino acid composition (P = 0.09). The Calcarea were also found to be significantly unstable in all analyses, and posterior predictive analysis determined that Leucosolenia sp. also had an extremely skewed amino acid composition (P ∼ 0).
Animal Phylogeny
When discussing the relationships among the major animal groups and their support, we shall only refer to the results obtained from the analyses of 1) the full (71 taxa) data set (a total of nine Bayesian analyses, an NJ and an MP analysis), 2) the trimmed data set excluding the unstable G2/Myxospongiae, Hexactinellida, and Calcarea (a total of eight Bayesian analyses, an NJ and an MP analysis), 3) the data set excluding the compositionally heterogeneous taxa (one CAT-GTR analysis), and 4) the data set excluding the compositionally heterogeneous taxa and the G2/Myxospongiae, Hexactinellida, and Calcarea (one CAT-GTR analysis). In addition to that we shall consider (5) the CAT-GTR analysis of the “slow only” data set: the data set including all the taxa but scoring only the sites that are slowly evolving according to our slow–fast analyses (see also Supplementary Material online). Results of the analyses of the other trimmed data sets, those excluding only subsets of unstable taxa (i.e., only excluding the Hexactinellida or the G2/Myxospongiae plus the Hexactinellida) will not be discussed as they are consistent with the results presented herein (fig. 1 and tables 1 and 2).
Test of Alternative Sponge Relationships
| Ln Bayes Factor and Their Standard Errors | ||||
| Model | Paraphyly (fig. 1) versus Monophyly | Paraphyly (fig. 1) versus Porifera + Cnidaria | Monophyly versus Porifera + Cnidaria | Data Set |
| MEM-GI | 7.753 (±0.692) | 58.98 (±0.692) | 51.177 (±0.913) | Full |
| MEM-GI | 18.018 (±0.724) | 56.057 (±0.724) | 38.039 (±0.834) | Hexactinellida, G2, and Calcarea out |
NOTE.—This table reports Bayes factors (calculated under MEM-GI). BF decisively discriminates against both monophyletic Porifera and Porifera + Cnidaria, when these hypotheses are compared against the paraphyletic Porifera of figure 1. BF also decisively discriminates against Porifera plus Cnidaria when this hypothesis is compared against monophyletic Porifera.
Monophyly of Eumetazoa
With one exception, all Bayesian analyses (see table 1) as well as our ML, NJ, and MP analyses, recovered a monophyletic Eumetazoa, here comprising Cnidaria + Bilateria. As mentioned above, we were unable to include ctenophores and are therefore not testing eumetazoan monophyly in the classic sense but rather the monophyly of Cnidaria + Bilateria with respect to sponges and placozoans. The exception was the Bayesian analysis performed under WAG of the full data set, which placed Trichoplax as the sister group to Bilateria with moderate support (posterior probability [PP] = 0.6). None of our analyses recovered a Cnidaria + Porifera clade. Eumetazoa was still recovered after the removal of compositionally heterogeneous or unstable taxa, suggesting that it was not the inclusion of these taxa in the full data set that were causing this node to be artifactually recovered.
Although Eumetazoa was recovered in all but one of our analyses, the statistical support for this group was sometime relatively low (table 1). However, support values changed dramatically when the fast-evolving sites or the unstable or compositionally heterogeneous taxa were removed. In all Bayesian analyses with fast-evolving sites, unstable taxa, compositionally heterogeneous taxa, or both compositionally heterogeneous and unstable taxa removed, PPs for Eumetazoa were 0.96 or higher, with PP = 1 under many of the models (table 1).
The Position of Placozoa
Based on the retention of plesiomorphic elements such as introns and open reading frames of unknown function in their mitochondrial genomes, Placozoa have been proposed to be the sister taxon to all other animals (Dellaporta et al. 2006), although the phylogenetic tree in that paper found them to be basal diploblasts. Alternatively, a “whole-genome” phylogenetic analysis found strong support for the more traditional grouping of Placozoa + Eumetazoa (Srivastava et al. 2008). Our data set, which had only a third of the amino acid residues but 8× the taxon sampling of Srivastava et al. (2008), fully supported the whole-genome analysis by finding Placozoa, here represented by the Grell strain of T. adhaerens, as the sister group to the eumetazoans (fig. 1). Placozoa + Eumetazoa were recovered in seven of the eight Bayesian analyses of the full data set (table 1) with significant support. In addition, the analysis of the slowly evolving sites and all the analyses with either unstable or compositionally heterogeneous taxa removed still found Placozoa as the sister group to Eumetazoa (table 1). Accordingly, the presence of fast-evolving sites, unstable, and compositionally heterogeneous taxa did not seem to have biased our results, strongly suggesting that placozoans are not basal metazoans.
The Paraphyly of Porifera
All Bayesian analyses of the full data set recovered sponges as paraphyletic, although some variation of the branching order and the support for different topologies was observed between different evolutionary models. The Bayesian analysis performed under the overall best fitting model CAT-GTR (see fig. 1), recovered the topology found by Sperling et al. (2007), with three sponge clades forming a paraphyletic grade with respect to Placozoa + Eumetazoa. Specifically, the Homoscleromorpha, Calcarea, and then the Demospongiae + Hexactinellida were recovered, respectively, as successive sister lineages to Placozoa + Eumetazoa. This topology was also recovered in Bayesian analyses performed under CAT-WAG and CAT, GTR (in MrBayes but not in Phylobayes), and WAG-G (in Phylobayes but not in MrBayes). The Bayesian MEM-GI and WAG analyses as well as the GTR analysis performed in Phylobayes, and the WAG-G analysis performed in MrBayes also found three separate sponge lineages, but with Calcarea as the sister group to all other animals and Demospongiae + Hexactinellida as the sister taxon of a monophyletic Epitheliozoa (i.e., Homoscleromorpha + Placozoa + Eumetazoa). We found no support for a topology in which hexactinellids were the sister group to all other metazoans (Kruse et al. 1998) or the sister group to bilaterians (Haen et al. 2007). However, their phylogenetic instability (see the leaf stability analysis above) does not allow us to make a confident statement regarding their phylogenetic position.
The support values for the nodes separating the major sponge lineages (Demospongiae, Calcarea, Homoscleromorpha, and Hexactinellida) ranged from very low (e.g., the CAT-WAG tree) to very high, for example, PP = 0.99 and PP = 1.00 for Epitheliozoa in both the Phylobayes and MrBayes GTR and WAG-G analyses, respectively. Bayes factors provided decisive support in favor of the paraphyly hypothesis of figure 1, when compared with the monophyletic Porifera hypothesis (see table 2).
When repeating the Bayesian analyses after removing the compositionally heterogeneous and/or the unstable taxa, sponge paraphyly was still recovered, often with considerably higher support values (table 1). Particularly, Epitheliozoa had PP = 1.0 in all but one of these analyses (see table 1). The recovery of this topology with strong support after removal of heterogeneous and unstable taxa indicates that this node is unlikely to represent an artifact caused by the presence of these taxa. Similarly, in the CAT-GTR analysis of the slowly evolving sites, support for Epitheliozoa increased from PP = 0.71 to PP = 0.83, suggesting that the signal supporting this node is principally associated with the slowly evolving sites.
Intraclass Relationships
Each of the three sponge Linnean classes had more than two representatives, allowing us to at least partially test relationships within those classes. For the Hexactinellida, A. vastus and H. calyx were always sister taxa with respect to R. dawsoni and always with perfect support, consistent with morphological cladistic and rDNA phylogenetic analyses (Dohrmann et al. 2008). Within the Calcarea, the Bayesian analyses of the full data set supported the monophyly of the three calcaroneans with respect to the calcinean C. cerebrum, all with perfect support and again consistent with morphological and 18S rDNA phylogenetic analyses (Manuel et al. 2003; Dohrmann et al. 2006). Within the Calcaronea, all analyses found Sycon lingua to be the sister taxon of L. nuttingi + Leucosolenia sp., again with perfect support.
Within the demosponges, we recovered, with strong support, the four clades originally found with 18S rDNA (Borchiellini et al. 2004): G1 or Keratosa (=Dictyoceratida + Dendroceratida), G2 or Myxospongiae (=Verongida + Halisarcida + Chondrillidae), G3 = Haplosclerida, and G4 which is all other spiculate orders. These four clades all had PP = 1.0 or in only one case PP = 0.99 (table 1). In addition, all the analyses of the full data set (including the CAT-GTR analysis of the slowly evolving sites) found significant support (either PP = 1.0 or PP = 0.99) for the sister group relationship between Haplosclerida (G3) and G4. Although some of the analyses with the unstable or compositionally heterogeneous taxa removed recovered this node with strong to perfect support, some of these analyses also found the G1 clade either within or as the sister group to the G4 clade. The only notable difference between the housekeeping gene trees presented here and previously published rDNA and mitochondrial genome trees was the position of the freshwater haplosclerids, which we found grouping with perfect support with the marine haplosclerids (G3), as opposed to being the sister group to all remaining G4 sponges (Borchiellini et al. 2004; Redmond et al. 2007; Lavrov et al. 2008).
As with other previously published demosponge phylogenies, the basal relationships within demosponges and specifically the relationships of the G1/Keratosa and G2/Myxospongiae clades to each other and to the spiculate (G3/Haplosclerida + G4) clade were difficult to discern. All Bayesian analyses on the full data set found the G2/Myxospongiae’s, sometimes along with the hexactinellids, to be the sister group of all other demosponges. However, this relationship often had low statistical support, and the G2/Myxospongiae as well as the Hexactinellida were identified as significantly unstable in the leaf stability analyses. Two of these taxa, V. rigida and A. fulva, had moderately and significantly skewed amino acid compositions, respectively, and may be attracted toward the long-branched hexactinellids (which also include compositionally skewed species). Consequently, it is difficult to determine if this basal position of the G2/Myxospongiae with respect to other demosponges, as well as the position of Hexactinellida within the Demospongiae, represents phylogenetic signal or systematic error.
Identification of Possible Phylogenetic Artifacts: ML Mapping, Saturation Plots, Homoplasy Prediction, Parsimony, NJ, and Slow–fast Analyses
ML mapping showed that the signal in our data set is, in principle, sufficiently strong to resolve the relationships among the taxa it scores (supplementary fig. S1).
Posterior predictive analysis seem to show that CAT predicts homoplasies in our data set more efficiently than any other model (including CAT-GTR, see supplementary table S5) and should not be prone to generating tree reconstruction artifacts. The second best model at predicting the homoplasies observed in our data is CAT-GTR, followed by CAT-WAG, GTR, WAG-G, and WAG.
Saturation plots (supplementary fig. S2) showed that the use of CAT-based models, GTR, WAG-G, and MEM-GI allowed the estimation of trees with comparable patristic distances. However, when CAT-GTR–based patristic distances were compared against the corresponding WAG and mean observed distances, it was clear that the latter are saturated (supplementary fig. S2e and Supplementary Data). This suggests that trees derived under WAG, and our NJ tree, are likely to display spurious groups.
As mentioned above, using WAG, calcareans were recovered as the sister group to all other animals, and the Placozoa were found as the sister group to the bilaterians. A sister group relationship between Calcarea and all the other considered animals was also found in Bayesian MEM-GI analyses, in Phylobayes analyses performed under GTR, and in MrBayes analyses performed under WAG-G. This result was never recovered using the CAT-based models. Considering that mechanistic GTR is the best fitting among the standard GTR models we tested but that the CAT-based models fit our data significantly better than any of the standard GTR models, we suggest that this result is most likely artifactual. A sister group relationships between Trichoplax and Bilateria were only obtained when the data are analyzed using WAG, suggesting that this is a model-dependent result and thus likely to be artifactual.
Results of our bootstrap MP analysis, when summarized using a majority rule consensus tree with minority components, displayed a poorly supported (bootstrap proportion [BP] = 14%) monophyletic Porifera plus Placozoa (supplementary fig. S3). Monophyletic Porifera was also recovered by our NJ analysis of the full data set (supplementary fig. S4). In the NJ analysis, the support for Porifera was moderate (BP = 66%), and Trichoplax was recovered as the sister group of the Eumetazoa. Monophyletic Porifera was never recovered in our ML and Bayesian analyses. MP is well known for being very sensitive to long-branch attraction and other systematic biases (Felsenstein 1978), and the saturation plots (supplementary fig. S2f) suggest that our NJ analyses should also be expected to display spurious groups. We thus suggest that a monophyletic Porifera may represent a tree reconstruction artifact.
Results of our slow–fast analyses seem to confirm the hypothesis that the relationships among the Porifera detailed in the MP and NJ analyses may be artifactual. A bootstrap MP analysis of the “slow sites” only data sets (see Supplementary Material online and supplementary fig. S5) did not recover a monophyletic Porifera. Instead, a paraphyletic Porifera was recovered such that Homoscleromorpha was the sister group of the Eumetazoa (BP = 28%) and Calcarea was the sister group of the Eumetazoa + Homoscleromorpha (BP = 28%). In other words, an MP analysis of the slow sites only (supplementary fig. S5) found the same relationships among the sponges that CAT-GTR found for the full data set (compare fig. 1; supplementary fig. S5). Support for the clades in supplementary figure S5 is low; however, this analysis demonstrates that when only relatively slowly evolving sites are analyzed using MP, support is lost for a monophyletic Porifera, whereas support is gained for the paraphyly hypothesis of figure 1. Analyses of the slow only data set performed under NJ (data not shown) still resulted in a monophyletic Porifera. However, a saturation plot (results not reported) showed that for divergences as deep as those that we are attempting to resolve with this data set, the mean observed distances are highly saturated even when considering the slowly evolving positions only. In any case, using NJ, we also observed a significant decrease in the support obtained for monophyletic Porifera when the fast-evolving sites were excluded (from BP = 66% to BP = 38%).
The artifactual nature of a monophyletic Porifera and of trees in which Calcarea represent the sister group of all the other animals seems to be further confirmed by analyses of the slow only data set performed using WAG, CAT, and CAT-GTR. Results of the WAG analysis are reported in supplementary figure S6. Calcarea are not the sister group of all the other animals in this tree. Instead, a topology congruent with that of the CAT-GTR tree of figure 1 was recovered. Similarly, the CAT analysis of the same data set also found support for a paraphyletic Porifera, although in this analysis Calcarea and Homoscleromorpha were found as each other sister group (albeit with low support PP = 0.5; see supplementary fig. S7). Finally, when the slow only data set was analyzed under CAT-GTR, a tree mostly congruent with that of figure 1 was found (see supplementary fig. S8 and table 1). Interestingly, the CAT-GTR analysis of the “slow sites only” found increased support for Epitheliozoa (see table 1).
To further test our results, we performed analyses of the “heterogeneous only” data set (for methodological details, see also Supplementary Material online) under CAT, WAG, MP, and CAT-GTR. The heterogeneous only data set is a data set that we assembled by combining the sites that we identified as fast evolving (using slow–fast) and the constant sites. The constant sites were added to the fast evolving ones to exacerbate site-specific rate variation and to generate a data set that should be expected to generate tree reconstruction artifacts, at the least when analyzed using underparameterized models or methods that are sensitive to systematic biases. Interestingly, when CAT, WAG, or MP were used to analyze the heterogeneous only data set, a monophyletic Porifera + Placozoa was invariably recovered (supplementary figs. S9–Supplementary Data). Trichoplax was found as the sister taxon to the monophyletic Porifera (PP = 1 in the WAG analysis) and nested within Porifera as the sister group of Calcarea in the CAT and MP analyses. Although the support obtained for monophyletic Porifera and Porifera plus Placozoa (i.e., a partial Diploblastica) varied (PP = 1 in the WAG no gamma analysis, PP = 0.56 in the CAT analysis, and BP = 13% in the MP analysis), these analyses confirm that, at the least according to our data set, the signal supporting these groups is mostly associated with the fast-evolving sites. Accordingly, these groups are probably better seen as phylogenetic artifacts. Further, these analyses suggest that if the conditions generating the artifacts are exacerbated (e.g., if a data set of fast-evolving sites in which site-specific rate heterogeneity is artificially exacerbated is assembled), this artifact become very resilient, even appearing when a model like CAT that had previously been shown to be very robust to systematic artifacts is employed. Finally, the analysis of the heterogeneous only data set performed under CAT-GTR (supplementary fig. S12) did not find a monophyletic Porifera. Instead, it recovered a basal Calcarea and a monophyletic Homoscleromorpha plus Demospongia and Hexactinellida, confirming that trees showing Calcarea as the sister group of all the other animals are also most likely artifactual.
Discussion
Here we tested hypotheses of sponge relationships with increased taxonomic sampling. Our results are broadly consistent with previous analyses of these seven genes (Peterson and Butterfield 2005; Sperling et al. 2007) and were unable to refute the hypothesis of poriferan paraphyly. Indeed, we find that homoscleromorphs are more closely related to eumetazoans than they are to demosponges. Our analyses refute the hypothesis that cnidarians are more closely related to sponges than they are to bilaterians and, in addition, find that placozoans are most likely the sister taxon of eumetazoans, as hypothesized by Nielsen et al. (1996) and Peterson and Eernisse (2001). In addition, we have shown that the general insights gleaned from rDNA studies involving intraclass level poriferan relationships are largely robust, with the only major deviation the movement of the freshwater haplosclerid sponges from the G4 to the G3 clade, supporting the monophyly of Haplosclerida. Finally, we showed that according to this data set, a monophyletic Porifera and a monophyletic Porifera + Placozoa are better seen as phylogenetic artifacts. It is possible that these are data set–dependent results. However, it certainly is surprising that these clades are only recovered when underparameterized models, poorly performing methods, and/or conditions that should exacerbate the generation of phylogenetic artifacts are considered.
Eumetazoan Monophyly
Several recent studies using data sets such as ESTs (Dunn et al. 2008; Schierwater et al. 2009) and complete mitochondrial genomes (Lavrov et al. 2008) have found overall topologies for the most basal part of the metazoan tree that are radically different from the one found in this study and from traditional ideas concerning animal phylogeny. For example, the EST study by Dunn et al. (2008) found ctenophores as the earliest diverging animal group, followed by Cnidaria + Porifera as the sister taxon to Bilateria, albeit with low support. Trees derived from complete mitochondrial genomes also find Cnidaria + Porifera, but with perfect Bayesian support (Lavrov et al. 2008). As mentioned above, although we do not have data from ctenophores as we were unable to amplify these seven genes, which were also not present in published ctenophore EST traces, the position of ctenophores does not impact upon the two main goals of this paper: investigating the relationships of the sponges and testing whether sponges and cnidarians are sister groups with respect to the Bilateria.
A Cnidaria + Porifera sister group relationship was not recovered by any of the phylogenetic analyses conducted during this study. Furthermore, for both the full data set and the data set without unstable taxa, Bayes factors decisively discriminated against this hypothesis (table 2), in agreement with the numerous independent data sets supporting the monophyly of Eumetazoa. For example, outgroup comparison with choanoflagellates indicates that the choanocyte is the primitive feeding mode for Metazoa as choanoflagellates feed from a current that is generated by a flagellum by trapping food in a collar of microvilli. Further, ingroup comparison strongly suggests that the guts of both cnidarians and bilaterains are homologous, as not only is there extensive morphological and developmental similarity, but the gene regulatory network underlying gut development and morphogenesis is also shared (Scholz and Technau 2003; Martindale et al. 2004). The topology of Cnidaria + Porifera would require that either the choanocyte was derived independently between sponges and choanoflagellates or the gut of cnidarians and bilaterians arose independently from some presumed ancestral state and neither seems likely given the evidence currently available.
A sister group relationship between Cnidaria and Porifera is also less parsimonious when considering the evolution of several important gene families. Gene trees for both ANTP genes (Larroux et al. 2007; Peterson and Sperling 2007); Sox, Fox, and T-box genes (Larroux et al. 2008); and basic helix-loop-helix genes (Simionato et al. 2007) show many instances where a gene that is present in single copy in the demosponge genome is the orthologue of (at least) two eumetazoan paralogs (e.g., the ARNT/Bmal-like example figured by Simionato et al. 2007). Under the traditional hypothesis of metazoan phylogeny, namely (Porifera (Cnidaria, Bilateria)), which is also the phylogenetic topology recovered herein, albeit with a paraphyletic Porifera, this gene tree would be most parsimoniously interpreted as a gene duplication postdating the sponges-(Cnidaria + Bilateria) split. But if Cnidaria + Porifera is the correct topology, then this would then require independent losses of a demosponge paralog in both cnidarians and bilaterians, as well as the loss of both cnidarians + bilaterian paralogues in demosponges—a much less parsimonious scenario. Furthermore, studies of the small RNA complement of demosponges (Grimson et al. 2008; Wheeler et al. 2009) have demonstrated that although demosponges do express small RNAs, they do not share any small RNAs in common with cnidarians, whereas cnidarians and bilaterians do share a microRNA gene in common, miR-100, which must have also been lost in demosponges if Cnidaria + Porifera is a correct description of these basal interrelationships. In toto, when considering that phylogenetic studies derived from morphology (Nielsen et al. 1996; Peterson and Eernisse 2001), 18S rDNA (Wallberg et al. 2004), nuclear housekeeping genes (Peterson and Butterfield 2005; Sperling et al. 2007; this study), small noncoding RNAs (Grimson et al. 2008; Wheeler et al. 2009), some EST studies (Jiménez-Guri et al. 2007; Philippe et al. 2009), and sequences derived from complete genomes (Putnam et al. 2007; Srivastava et al. 2008), all agree that Cnidaria + Bilateria are part of a monophyletic group which excludes the sponges, it is likely that these mitochondrial and EST-based trees that recover a Porifera + Cnidaria clade are incorrect.
Poriferan Paraphyly
This data set of seven nuclear housekeeping genes has in previous studies recovered sponge paraphyly (Peterson and Butterfield 2005; Sperling et al. 2007). This study tests this hypothesis with additional taxon sampling, which can be one of the most fundamental determinants of phylogenetic accuracy (Graybeal 1998; Zwickl and Hillis 2002; Hillis et al. 2003). Increased taxon sampling did not refute the paraphyly hypothesis for this data set, and indeed, we found evidence for at least three independent sponge lineages, the Demospongiae + Hexactinellida, the Calcarea, and the Homoscleromorpha, which is summarized in figure 2. Our analyses lend further strength to the paleobiological and paleoecological ramifications derived from such a topology that have been explored in previous papers (Cavalier-Smith et al. 1996; Borchiellini et al. 2001; Peterson and Butterfield 2005; Peterson et al. 2005; Sperling et al. 2007; Nielsen 2008) and consequently will not be discussed here.
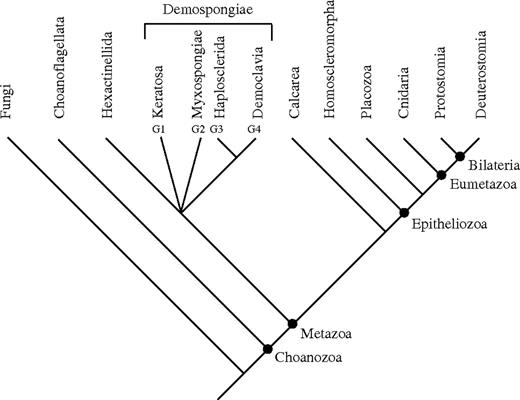
Summary cladogram of our analyses showing the major sponge and basal metazoan groups. This figure represents a summary of the information in all our Bayesian and ML analyses and the results of the analysis of the slowly evolving sites (supplementary figs. S5–Supplementary Data). The analyses consistently find Eumetazoa (here Cnidaria + Bilateria) to be monophyletic, placozoans as the sister group to Eumetazoa, and the Homoscleromorpha as the sister taxon to Placozoa + Eumetazoa. The position of the Calcarea varies between analyses, but the best fitting models place them as the sister group to the Epitheliozoa. The relationships at the base of Demospongiae and the placement of the Hexactinellida are currently unresolved.
Although the statistical support for paraphyly is, in some cases, not particularly high, support always rises to significant levels when compositionally heterogeneous and unstable taxa are removed (table 1). Bayes factors indicate that, for this data set, a paraphyletic Porifera is a substantially better fit (∼2,328 times better; see table 2) than a monophyletic Porifera. In addition, finding homoscleromorphs more closely related to eumetazoans than to demosponges is not entirely unexpected and raises interesting issues concerning, for example, the developmental mechanisms underlying the evolution of true tissues, a potential synapomorphy of Epitheliozoa (Boute et al. 1996; Boury-Esnault et al. 2003; Sperling et al. 2007).
In contrast to the homoscleromophs, the phylogenetic position of Calcarea was more variable with our analyses. Most analyses, including those performed under the best fitting evolutionary model, found Calcarea as a separate sponge lineage that was the sister lineage to Epitheliozoa, similar to our earlier results (Peterson and Butterfield 2005; Sperling et al. 2007), whereas others found Calcarea as the sister group to all other metazoans. This latter topology is likely to be artifactual as it was associated with the poorly fitting WAG model and the analysis of fast-evolving sites (see supplementary tables S2–Supplementary Data and Supplementary Data). Besides, this topology was not recovered when the slow sites only data set was analyzed using WAG. In this analysis, the Calcarea was again found as the sister group of the Epitheliozoa, as in the trees obtained under the best fitting model (compare fig. 1; supplementary fig. S6), with significant support (PP = 0.99).
The bootstrap NJ tree with mean observed distances, which are the most saturated (supplementary fig. S2), and bootstrap MP tree are similar to the one in figure 1. The only major difference is that in these trees Porifera or Porifera + Placozoa were recovered as monophyletic. A similar result was found by Manuel et al. (2003). When their 18S rDNA sequences were analyzed using MP, a monophyletic Porifera was recovered, whereas an ML analysis of the same data set recovered a paraphyletic Porifera. Given this result, and because in our data set sponge monophyly was exclusively obtained using highly saturated distances, MP, or from the analysis of fast-evolving sites, we suggest that a monophyletic Porifera may represent a phylogenetic artifact associated with uncorrected systematic biases. This is confirmed by the CAT analyses of our “heterogeneous sites” only data set, which showed that a monophyletic Porifera can be recovered, even using well-performing models like CAT, when the conditions generating the artifact are exacerbated.
The difference between the tree in figure 1 and that of, for example, Philippe et al. (2009), which found sponge monophyly, mainly lie in the rooting position as the two unrooted trees are essentially congruent for the taxa over which they overlap. That study used a large protein alignment and illustrates the importance of taxonomic sampling in EST studies; compare, for example, Philippe et al. (2009) with Dunn et al. (2008). The incongruence observed between Philippe et al. (2009), Dunn et al. (2008), and Schierwater et al. (2009) also illustrates that EST/phylogenomic data sets are far from congruent. Irrespective of which (we think any) of these studies will be shown to be correct their incongruence pinpoints that increasing gene sampling does not guarantee phylogenetic accuracy (see Jeffroy et al. 2006). Philippe et al. (2009) increased taxon sampling in comparison to previous EST studies, but they still included relatively few sponges, which might not have been sufficient to clarify their relationships. Philippe et al. (2009) used the well-performing CAT model to carry out their analyses, but we have shown here that even this approach may be insufficient to overcome phylogenetic biases when the artifact-generating conditions are exacerbated (see supplementary fig. S10). Nonetheless, the current congruence of independent morphological data sets and large protein alignments does argue in favor of sponge monophyly as the congruence of trees inferred from alternative data types represents the strongest possible evidence in favor of a phylogenetic hypothesis (Pisani, Benton and Wilkinson 2007). Therefore, although the jury is clearly still out with respect to the monophyly versus paraphyly of Porifera, the analyses of our data set favor sponge paraphyly and indicate that systematic error within this data set, if not corrected, results in the recovery of an artifactual monophyletic Porifera.
Intraclass Relationships
In general, our results were concordant with previous estimations of within-class sponge phylogeny, recovering, for example, the expected topologies within Calcarea and Hexactinellida. Within demosponges, the G1–G4 nomenclatural system originally proposed by Borchiellini et al. (2004) has been found to be relatively robust, both by 18S and 28S rDNA studies (Nichols 2005; Redmond et al. 2007), the complete mitochondrial genome study by Lavrov et al. (2008), and this study. This numbering system, although a wise choice for a preliminary study, is not especially evocative and limits the accessibility of the phylogenetic information for those not intimately familiar with the original paper. We encourage the use of the names Keratosa for G1, Myxospongiae for G2, and Haplosclerida for G3 as this clade appears to include the freshwater haplosclerids (fig. 1). We propose the term Democlavia for the G4 clade, the most speciose group of spiculate demosponges and with the widest variety of spicule morphologies, after the latin Clavus meaning nail or spike. Because the position of the freshwater demosponges is uncertain, we define Democlavia as all organisms more closely related to Clathria (Microciona) prolifera than to Amphimedon queenslandica and Haplosclerida as all organisms more closely related to A. queenslandica than to Clathria (Microciona) prolifera; the freshwater demosponges will then be accommodated within one of these two clades as their position becomes resolved.
Conclusion
Here we have shown that Porifera is likely a paraphyletic assemblage of basal metazoan taxa, strongly suggesting that the last common ancestor of all living animals was a benthic, sessile microsuspension-feeding organism. This realization has a direct and profound bearing on our understanding of the paleoecology of the late Proterozoic, the biology of the last common ancestor of animals, and the construction of the eumetazoan genome. Nonetheless, more data and more sophisticated analyses need to be applied to this problem and indeed to the problem of basal metazoan interrelationships in general. For example, analyses of this data set, rDNA, and some analyses of mitochondrial genomes all indicate demosponges and hexactinellids are closely related, but as there is little resolution at the base of demosponges, it is not clear whether the hexactinellids are nested inside demosponges or not. Further, the interrelationships among the homoscleromorphs are still contentious. Certainly, more data from more taxa, using both EST and single-gene PCR approaches, as well as perhaps small RNA analysis, will help immensely in addressing these critical areas of the animal tree.
We thank K. Gordon, C. Laumer, J. Sullivan, A. Heimberg, C. Fiore, J. Lyons, V. Moy, L. Blodgett, and I. Blumenthal for laboratory assistance, D.E.G. Briggs, D. Tank, S. Smith, T. Near, J. Vinther, and J. Landon, for helpful discussion, and P. Cardenas for help in the field. S. Leys and G. Worheide provided helpful comments on an earlier draft of the manuscript. We thank D. Janussen for the collection and gift of C. cerebrum, S. Leys for the collection and gift of A. vastus and R. dawsoni, and G. Worheide for providing unpublished EST sequences for Heterochone. E.A.S. thanks R. Thacker, C. Diaz, S. Leys, R. Collins, and the students of the 2007 STRI sponge taxonomy course for an enjoyable and educational time at Bocas del Toro. E.A.S. is supported by a Society of Systematic Biologists award for graduate research, K.J.P. is supported by the National Science Foundation, and D.P. is supported by Science Foundation Ireland SFI-RFP grant (08/RFP/EOB1595). All computational work was completed using the infrastructure of the NUI Maynooth High Performance Computing Facility.
References
Author notes
Billie Swalla, Associate Editor
