


Abstract
We develop a broadly applicable class of coevolving latent space network with attractors (CLSNA) models, where nodes represent individual social actors assumed to lie in an unknown latent space, edges represent the presence of a specified interaction between actors, and attractors are added in the latent level to capture the notion of attractive and repulsive forces. We apply the CLSNA models to understand the dynamics of partisan polarization in US politics on social media, where we expect Republicans and Democrats to increasingly interact with their own party and disengage with the opposing party. Using longitudinal social networks from the social media platforms Twitter and Reddit, we quantify the relative contributions of positive (attractive) and negative (repulsive) forces among political elites and the public, respectively.
1 Introduction
The increase in partisan polarization over the last five decades is one of the most consequential developments in American politics. Ample evidence from political science suggests that political elites, like members of Congress, increasingly disagree on policies (e.g., McCarty, 2019; McCarty et al., 2016). Despite continued scholarly debate on the degree of ideological polarization among the public (Abramowitz & Saunders, 2008; Fiorina et al., 2005), there is little doubt today that substantial portions of the public are polarized in their affections towards the parties (Bafumi & Shapiro, 2009; Greenberg, 2005; Huddy et al., 2015; Iyengar et al., 2012; Jacobson, 2007; Mason, 2015).
Though the causal mechanisms of affective and ideological polarization remain active areas of research (e.g., Dias & Lelkes, 2021; Levendusky, 2013; Mason, 2018)—as do their operationalizations (Lelkes, 2016)—their documented manifestations are already many, including increases in party loyalty, straight-ticket voting and animosity towards candidates (Abramowitz & Webster, 2016; Christenson & Weisberg, 2019; Jacobson, 2000), as well as decreases in ambivalence, indecision and floating in elections (Smidt, 2017). Notably, considerations of the impact of polarization and political identities have spilled over onto less overtly political targets as well (DellaPosta et al., 2015; Hetherington & Weiler, 2018), such as marriage (Alford et al., 2011; Iyengar et al., 2012), online dating and friendship (Bakshy et al., 2015; Huber & Malhotra, 2017), where to live (Bishop, 2009; Christenson & Makse, 2015; Mummolo & Nall, 2017), and who in the family to talk to Chen and Rohla (2018). In this work, we similarly devote our attention to exploring polarization in social life, but in the modern and evolving environment of social media.
Social media is an increasingly popular and accessible forum for all kinds of discussion (Brundidge, 2010; Holt, 2004), yet the question of whether these discussions take place in silos of like-minded individuals is yet unresolved (Barberá, 2020; Tucker et al., 2018). Scholarship has pointed to homophilic interactions online or echo chambers (Bodrunova et al., 2019; Bright, 2018; Halberstam & Knight, 2016; Yarchi et al., 2021) as well as heterophilic ones (Bruns, 2019; Zuiderveen Borgesius et al., 2016), with recent works providing nuanced insights through considerations of different platforms and over time change (Waller & Anderson, 2021; Yarchi et al., 2021). Indeed, social media platforms may facilitate polarization leading to greater fragmentation (Bobok, 2016; Hayat & Samuel-Azran, 2017) via user selective exposure (Settle, 2018) and algorithmic filtering towards user predispositions (Mutz, 2001; Nahon, 2015). Scholarship finding heterogeneous engagements has noted an important role for online interactions in providing cross-cutting views, especially given polarization in the other spheres of modern political and social life (Bakshy et al., 2015; Barberá et al., 2015; Barnidge, 2017; Dubois & Blank, 2018; Eady et al., 2019). Such cross-cutting interactions may mitigate intergroup biases (Bond et al., 2018; Marchal, 2021), which, from the perspective of normative democratic theory, may be essential in reducing the discord in highly polarized political systems (Mutz, 2006; Pettigrew, 1998).
With the magnitude and reach of partisan polarization at seemingly unprecedented levels in US politics and beyond, we seek to better understand its nature online. First and foremost, we ask: is there an increase in partisan polarized interactions on social media? And if so, is it due to increasing interactions with one’s own party or decreasing interactions with the other party—or both, as we might expect from social identity theory (Tajfel & Turner, 1979)? Moreover, are these patterns consistent across Democrats and Republicans, and across elites and the public? Our goals then are both to check for partisan polarization’s presence in social media interactions among the elites and the public, engaging the early debates on mass-elite polarization, and also to uncover the attractive and repulsive forces of polarization over time, which speaks to an emerging literature on negative partisanship.
Originally noted in studies of multiparty voting (Caruana et al., 2015; Medeiros & Noël, 2014; Rose & Mishler, 1998), the idea of negative partisanship is that negative evaluations of the out-group party (i.e., negative partisanship)—as opposed to positive evaluations of the in-group party (i.e., positive partisanship)—are dominant in political behaviour and opinions. Indeed, the movement in affective polarization has largely been in terms of increasingly negative feelings for the other party and its members, while feelings towards their own have remained fairly stable (Abramowitz & Webster, 2018; Christenson & Weisberg, 2019). Such findings suggest an increased role for negative partisanship, which we evaluate by uncovering the relative strengths of attractive and repulsive forces of partisan in-group and out-group interactions on social media.
We construct two longitudinal social networks from the social media platforms Twitter and Reddit to investigate partisan polarization and, more specifically, the contributions of positive (attractive) and negative (repulsive) partisanship among political elites and the public, respectively. In the following section, we discuss in more detail each of the social media networks, but we note here that in both networks nodes represent individual social actors and edges represent the presence of a specified interaction among them. If the expectations from the aforementioned literature on partisan polarization above are correct then we should find social media users increasingly interacting with users from the same party, while disengaging from those of the other party. Of course, negative partisanship suggests a growing role for disengaging with the other party over interacting with their own. In addition, we recognize the possibility that these dynamics exhibit asymmetry, differing for elites and the public, as they might across the two parties.
To test the expectations of polarization and negative partisanship in social media interactions, we develop a class of coevolving latent space network with attractors (CLSNA) models in which both the links between nodes and certain characteristics (or attributes) of nodes evolve over time—each in a way that impacts the other. This class of models falls within the subclass of latent space models, of which static versions are now especially well-developed, and progress on dynamic versions has been made in recent years. Existing dynamic latent space network models (Sarkar & Moore, 2005; Sewell & Chen, 2015a, 2015b, 2016, 2017) dictate simply that latent characteristics evolve in time in a Markov fashion and then links between nodes exist with probabilities driven by node distance in the underlying latent space. In contrast, in our framework the temporal evolution of latent characteristics can depend on network connectivity—hence, a coevolving network model. Such a feedback mechanism is embedded into the model via the presence of attractors (a concept fundamental to dynamical systems) at the latent (i.e., unobserved) level. This class of coevolving network models is, to the best of our knowledge, novel, and the models are generally applicable to any case of coevolutionary phenomena in social behaviours such as flocking and polarization.
For this application, we define a two-group CLSNA model with two attractors mimicking attractive and repulsive forces, which is a specific version of the CLSNA model class. In this version of the model, each node in the network is assumed to fall into one of two groups with known labels, and their movements are influenced by their neighbours through specially defined attractors. We also account for persistence of links in the dynamic evolution of the network, which is a necessary control informed by social network theory. Finally, we define a change-point version of this model to allow for the potential of time-variation of parameters, where the network evolves according to one set of parameter values up to a given change-point, and another set of parameter values after the change-point.
This article is organized as follows. In Section 2, we provide an overview of the two network data sets used in this study through an exploratory analysis. In Section 3, we introduce the statistical network model proposed in this work, including a discussion of model behaviours and parameter interpretation, as well as a Metropolis-Hastings (MH) within Gibbs MCMC framework for posterior inference. In Section 4, we present the application of this model to the two data sets and quantitatively analyze the evolution of the key factors of social media interactions. In Section 5, we conclude the study with a discussion of the results and the model proposed. More details on the network definition, the algorithm and simulation/application results are provided in the online supplementary material, Appendix.
2 Network data
In this section, we introduce data used in this study. We construct and explore two different online longitudinal social interaction networks for evidence of polarization, one of the elite, via Twitter, and one of the public, via Reddit. Data and code are available at https://github.com/KolaczykResearch/CLSNA-2Party-Polarization.
2.1 Twitter congressional hashtag networks
We collected tweets for every US congressperson with a handle from 2010 to 2020. This yielded 796 accounts, 843,907 tweets, and 1,252,455 instances of hashtag sharing (after retweets and tweets with no hashtags are removed). These data were used to construct a binary network for each year, wherein nodes correspond to sitting members of Congress and edges indicate that the number of common hashtags tweeted by both members of Congress that year was more than the average. We use the yearly average instead of a static threshold in constructing edges, because hashtag usage in Twitter by members of Congress increased substantially over the past decade, which allows our model to capture more meaningful interaction dynamics beyond increasing hashtag usage. The nodes for the resulting networks vary from year to year since some members of Congress were reelected, while others may have joined Twitter at a later stage, left early or both. In our analysis, we focus our analysis on the 207 members of Congress who served in office and stayed active on Twitter over the entire course of our study, among whom 131 are Democrats and 76 are Republicans.
The choice of edge construction can be consequential in studies of polarization. While the approaches vary, here we follow the literature that has taken advantage of hashtag sharing (Borge-Holthoefer et al., 2015; Bovet et al., 2018; Darwish, 2019; Kušen & Strembeck, 2018; Magdy et al., 2016; Weber et al., 2013). In doing so, we perceive of polarization in terms of indirect engagement (e.g., Bode et al., 2015; Bruns & Moe, 2014; Giglietto & Lee, 2017; Naaman et al., 2011; Wilkinson & Thelwall, 2012)—i.e., joining or avoiding the same topics of discussion. Relative to more direct engagement on social media, like retweeting or mentions, this approach provides a higher bar for polarization, since disengaging issues is an arguably more consequential activity—at least for members of Congress whose duty it is to address important topics—than just ceasing to engage with specific individuals. Our approach recognizes the key role of legislators in addressing important political topics regardless of party lines. In this framework, polarization is evinced when members discontinue engaging with the same topics and issues. We further discuss the edge construction in online supplementary material, Section 1 of the Appendix.
2.2 Reddit comment networks
In the case of Reddit, we collected the full data on submissions and comments since the site’s inception through pushshift.io. We focus on active Reddit users whose ideologies can be identified from their comments or flairs with declarative patterns, e.g., ‘I am a Republican’. We thereby selected 102 Republicans and 267 Democrats who made (1) at least one comment in each month during April 2015–March 2020, and (2) more than 50 comments in a year across political subreddits (e.g., ‘politics’, ‘Libertarian’, ‘PoliticalDiscussion’, ‘Conservative’, and so on). We then constructed longitudinal binary networks on these 369 active users for each one-year period based on their interactions in comments, wherein an edge between two active users indicates that they commented on the same submission. Like the Twitter analysis, the edge here is based on engaging the same submission or topic—and not necessarily direct engagement among two or more users. Because average commenting rates in Reddit did not change substantially over time, we use a static threshold in defining edges.
2.3 Exploratory analysis
Figure 1 shows plots of the density of edges within and between Democrats and Republicans as they evolve over time for the Twitter and Reddit networks, respectively. In the top panel of Figure 1 for Twitter congressional hashtag networks, while initially growing together in density, over the last four years, we notice divergent trends among the subsets of Democrats and Republicans, with Democrats increasing in their social media connections to each other and Republicans decreasing. While connections have increased overall, the presidential election year of 2016 brought about a drop in inter-party connections. In the bottom panel of Figure 1 for Reddit comment networks, while intra-party connections for the two parties share similar trends, with both of them initially increasing then decreasing, they differ in the extent of drop over the last three years, with more interaction ties dissolved among the subset of Republicans than Democrats. The inter-party connections also have decreased following the election year of 2016.
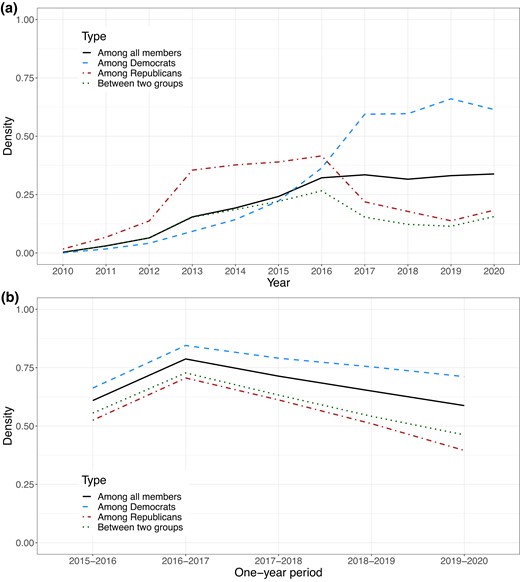
Four types of densities over years (inter-party, intra-party, and overall). Top: Twitter congressional hashtag networks on 207 members of Congress who served in office and stayed active in Twitter over the entire course of our study from 2010 to 2020. Bottom: Reddit comment networks on 369 active Reddit users identified as either Democrats or Republicans.
This is the first hint that the evolving polarization of the elite and general public begs a more complex interpretation than is usually brought to bear. Of course, this is only descriptive, and thus we turn to inferential methods with our proposed two-group CLSNA model with attraction and repulsion.
3 A two-group CLSNA model with attraction and repulsion for polarization
In this section, we outline our specific statistical modelling and inference approach.
3.1 Model definition
Let Gt = (Vt, Et) be a network evolving in (discrete) time t, with vertex set Vt and edge set Et. For simplicity, assume that Vt ≡ V is fixed over time, of order N = |V|. Let Yt be the (random) adjacency matrix at time t corresponding to Gt. Throughout the paper, we use capitals to denote random variables and lower-cases to denote the realizations of them. We assume data come in the form of time series of adjacency matrices {yt : t = 1, …, T}, where yt,ij = 1 if there is an edge between node i and node j at time t and 0 otherwise.
To model the dynamic evolution of networks in connection with our expectations of polarized online interactions, we use the latent space approach and add attractors in the latent level to capture the notions of attractive and repulsive forces at the heart of negative partisanship. Let be a time-indexed latent (i.e., unobserved) position for node i in p-dimensional Euclidean space, and zt = {zt,i}. Assume that each of the N nodes of the network falls into one of two groups, i.e., Democratic and Republican, with known node label for node i, where is the set of group labels. Formally, we define our model as follows:
with initial distribution at time t = 1,
Here s( · , · ) is a similarity function, and and are the two attractor functions for node i in Yt−1. Specifically, we set s(zt,i, zt,j) = ||zt,i − zt,j||2, and define the two attractors for node i as follows:
which are the discrepancies of zt−1,i from two local averages at time t − 1. These latter are the average of latent values of nodes in the following two sets, informed by a combination of group membership, and network connectivity:
, neighbours of node i in the same group.
, neighbours of node i in a different group.
When or or both are empty, we set , or or both to be zero. This means that when node i has no neighbours in a certain group, or no neighbours at all, there is no attraction from that group, or no attraction at all.
In this proposed model, we assume that each node lies in a p-dimensional Euclidean latent space, and the smaller the distance between two nodes in the latent space, the greater their probability of being connected, as in (1), (2). The expressions in Equations (6) and (7) capture the discrepancy between the current latent position of node i and the average of that of its current neighbours in groups 1 and 2, respectively. The corresponding parameters and γb represent attractive/repulsive forces, as we discuss below.
In contrast to the existing dynamic latent space network models (Sarkar & Moore, 2005; Sewell & Chen, 2015a, 2015b, 2016, 2017) where the latent process is assumed to evolve over time in a Markov fashion with transition distribution, e.g., Zt,i|Zt−1,i = zt−1,i ∼ Normal(zt−1,i, σ2Ip), and thus to drive evolution of the networks, as illustrated in Figure 2(left), our CLSNA model allows the network connectivity to enter the temporal evolution of latent positions in the form of attractors, as illustrated by the diagonal arrow in Figure 2(right). Specifically, in our model the evolution of latent positions for each node i from t − 1 to t is modelled by the normal transition distribution in Equation (3), the mean vector of which depends not only on the latent position of itself at time t − 1 but also on the two local averages, one from its neighbours in the same group, the other from its neighbours in a different group, as captured in (6) and (7). This is an important aspect of our model since it quantifies propensity for attraction/repulsion within/between two groups, and can help us understand how polarization/flocking and interaction coevolve. Strength of attraction/repulsion toward local averages is therefore summarized by the attractor functions and the associated parameters, the details of which are discussed in the later sections.
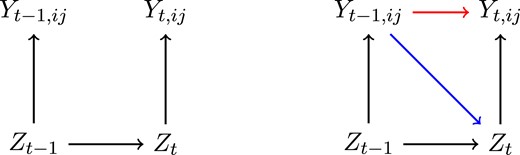
Graphical model representations of existing dynamic latent space network models (left), and proposed CLSNA (right) with both node attraction (diagonal arrow) and edge persistence (horizontal arrow).
We also include an effect for edge persistence, as illustrated by the horizontal arrow in Figure 2 (right), which is a necessary control informed by social network theory. δ captures the impact of having an edge at time t − 1 on whether or not there is an edge at time t. For δ > 0, the probability of an edge at time t will be increased when one exists already at time t − 1, and hence the model explicitly captures a notion of edge persistence.
3.2 Model behaviour and parameter interpretation
Our model incorporates a level of baseline connectivity (α), edge persistence (δ), two separate within-group node attraction for the two groups ( and , respectively), between-group node attraction (γb), and a measure of volatility (τ2 initially, and σ2 for t > 1). A rich set of behaviours can be generated by varying these parameters. The three attraction parameters , , and γb are of particular interest, in that by varying the sign they allow for the possibility of different combinations of attraction and/or repulsion in the evolution of the latent positions. The sign of these parameters encodes the direction of these forces—a positive sign indicates latent positions being pulled toward the direction of local averages, called attraction, while a negative sign indicates being pushed toward the opposite direction, called repulsion. For example, when , we can interpret this as two groups flocking together, while for but γb < 0, the two groups are flocking separately—that is, we have a notion of polarization.
In Figure 3, we illustrate the behaviour of latent positions and network connectivity in simulated models for the two scenarios, one reflecting two group flocking, and the other, polarization among the same two groups. For convenience of visualization, the latent space is taken to be one-dimensional. We can see that initialized with different latent positions, the time courses for positions of the N = 10 nodes in this network cluster together under flocking. But initialized together, they diverge into two clusters under polarization. At the same time, while the network becomes ever more densely connected over time under flocking, it evolves towards two fully connected subgraphs under polarization.
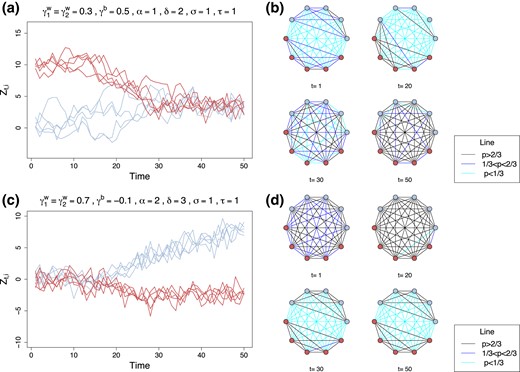
Top: Flocking setting (). Bottom: Polarization setting (). Left: Trajectories of latent positions by time for two groups in one-dimensional space. Right: Snapshots of the evolution of the probability of connections between different nodes in the graph.
One interesting observation from our simulation studies is that setting too large could lead to divergent model behaviours: we lose the attraction effect since nodes are being pulled too far away from the local averages, although the repulsion effect seems to be well-behaved for large magnitude of γb. This indicates that there is an interesting balancing relation between the different parameters of the model that warrants further theoretical investigation. Such an undertaking is beyond the scope of this work, but it certainly is an interesting avenue for further research.
3.3 Quantifying the extent of inter-/intra-party attraction/repulsion and edge persistence
While the sign of each attraction parameters encodes attraction (positive sign) or repulsion (negative sign) within group 1, within group 2, and between the two groups, respectively, the absolute value of these parameters can be used to quantify the extent of inter-/intra-party attraction/repulsion. Similarly, the value of δ can be used to quantify the relative importance of edge persistence. Accordingly, we take the magnitude of inter-party repulsion as a measurement for negative partisanship, and that of intra-party attractions for positive partisanship.
We can answer an array of questions regarding the nature of polarization online and, more specifically, negative partisanship by investigating the values of these parameters. For example, does the phenomenon of partisan polarization occur in our Twitter and Reddit data? If so, is repulsion to the other party or engagement with one’s own the dominant factor driving the interactions among elites and the public online? These questions can be answered respectively by assessing whether γb < 0; and by comparing the values of , with |γb|. Essentially, positive (negative) γb indicates positive (negative) interaction towards the out-party, and |γb| measures the extent of out-party disengagement. Similarly for , , the signs encode in-party positive/negative interaction, and the magnitude encode the extent of in-party engagement or disengagement.
3.4 Bayesian inference
The parameters in our model are natural and interpretable candidates for statistical inference. Given the hierarchical nature of our model, Bayesian inference based on appropriate interrogation of the posterior distribution makes sense. That is, given an observed network time series or, more specifically, a time series of the corresponding adjacency matrices , we can make inference of the latent positions Zt and model parameters based on the posteriors p(Z1:T, θ| Y1:T). A closed-form expression for this distribution is not available, but we can use Markov chain Monte Carlo. We have implemented an adaptive Metropolis-Hastings (MH) within Gibbs MCMC scheme for posterior sampling. The implementation is non-trivial, as certain issues of scaling (regarding the volatility parameters σ2 and latent positions) and rotational invariance (in the latent space) must be resolved. To be specific, we fix σ2 = 1 to solve the issue of lack of identifiability of the model. Besides serving as a solution to a technical problem in MCMC where two conditional distributions are not identifiable, it essentially enforces the model, specifically logit(pt,ij), to be scale-invariant with respect to σ2. By fixing σ2 = 1, we set a baseline reference for logit(pt,ij). Details of the MCMC algorithm and the rationale of fixing σ2 = 1 are provided in online supplementary material, Sections 2 and 3 of the Appendix.
4 Results
In this section, we fit our model to both Twitter data and Reddit data, with a latent space of dimension p = 2, and present the estimates for model parameters and latent positions. The choice of two dimensions is consistent with DW-NOMINATE, one of the most popular established ideal point models of congressional ideology, for which two dimensions explain up to 90% of variation in roll call voting (Poole & Rosenthal, 2001). To evaluate how well the model explains the data used to fit the model, we obtain the in-sample edge predictions by plugging the estimates into the linkage probability function and compute the AUC (area under the ROC curve) (Hanley & McNeil, 1982).
4.1 Twitter data analysis
We first fit our model with time-invariant parameters to the whole sequence of longitudinal networks in Twitter from year 2010 to 2020. The AUC values computed at each year are all above 0.976, and the overall AUC value computed across all times is 0.988, providing evidence that our model fits the data very well.
The summary statistics for the posterior distribution of model parameters are provided in Table 1. The edge persistence coefficient indicates that the log-odds that an edge appears increase by 1.5 if the same edge appeared in the previous time frame. The between-group coefficient is −0.155, demonstrating polarization across the sets of Republican and Democratic members of Congress. Additionally, the within group coefficient is 0.493 for Democrats, and 0.105 for Republicans, which means that while they have moved away from one another, they generally flocked to their own. Moreover, the Democratic members have a higher extent of intra-party attraction on Twitter, meaning that for Democratic members the interactions with their own party were stronger than those for Republican members. Comparing the magnitude of between-group coefficients to the two within-group coefficients, we can see that for Democrats the interactions toward their own party were stronger than the disengagement with the other party, while for Republicans negative partisanship was dominant.
Summary statistics for the posterior distribution of parameters using the whole sequence of Twitter networks from 2010 to 2020
| Mean | 125.763 | 2.809 | 1.500 | 0.493 | 0.105 | −0.155 |
| SD | 9.268 | 0.022 | 0.018 | 0.026 | 0.025 | 0.014 |
| 2.5% Quantile | 108.881 | 2.766 | 1.464 | 0.444 | 0.055 | −0.183 |
| 97.5% Quantile | 145.193 | 2.850 | 1.537 | 0.543 | 0.153 | −0.127 |
| Mean | 125.763 | 2.809 | 1.500 | 0.493 | 0.105 | −0.155 |
| SD | 9.268 | 0.022 | 0.018 | 0.026 | 0.025 | 0.014 |
| 2.5% Quantile | 108.881 | 2.766 | 1.464 | 0.444 | 0.055 | −0.183 |
| 97.5% Quantile | 145.193 | 2.850 | 1.537 | 0.543 | 0.153 | −0.127 |
Notes. 1-Democrats, 2-Republicans. These results indicate presence of edge persistence (), higher within-group attraction for Democrats than Republicans ( (mean difference = 0.388, SE = 0.035)), presence of between-group repulsion (), and some evidence for greater magnitude of between-group repulsion than within-group attraction for Republicans ( (mean difference = 0.050, SE = 0.022)), the opposite for Democrats ( (mean difference = −0.338, SE = 0.027)).
Figure 4 shows the posterior means of latent positions for each member of Congress in the Twitter hashtag networks. The dynamics of the clustering of latent positions exhibits a clear consistency with the evolution of within/between party edge densities seen in the top panel of Figure 1, with Democratic members of Congress (dots) tending to converge over time, while Republican members of Congress (crosses) initially converge then disperse following the presidential election year of 2016. The inflection around 2016 seen in the bottom panel of Figure 4 suggests that dynamics driving partisanship have changed.
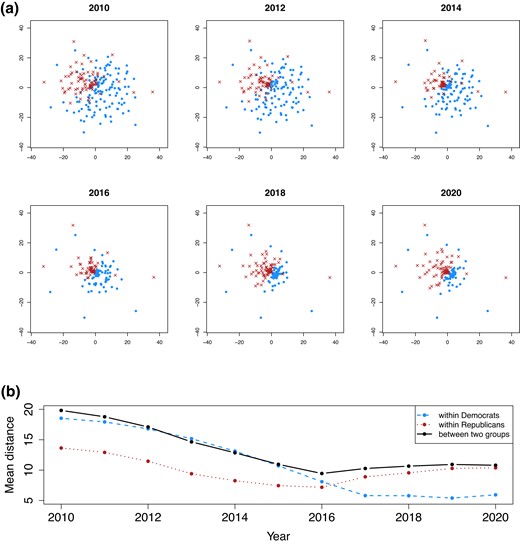
Top: Posterior means of latent positions for Twitter congressional hashtag networks (displaying only a subset of years). Dot-Democrats, Cross-Republicans. The dots get closer over time, while the crosses get closer first and then start spreading after 2016. Bottom: Mean latent distances within each group and between groups.
So far, we have seen that the CLSNA model is quite powerful in terms of revealing polarization in social network interactions, as well as disentangling and quantifying the two sides of polarization: positive and negative partisanship. These results motivate questions about the dynamics of the relationships uncovered above. In particular, given a host of major political, social and economic events over the past decade, can our model help us pinpoint changes in polarization and edge persistence over this period?
In order to confirm and quantify change in attraction, repulsion, and edge persistence, we fit a series of models that allow a single change-point to vary from 2012 to 2019. Specifically, for each choice of change-point, we parameterized our model separately within the two corresponding subperiods of time, thus obtaining a set of parameter values up to the given change-point, and similarly another set of parameter values after the change-point. The resulting eight fitted models with different change-points were compared through deviance information criteria (DIC) (Spiegelhalter et al., 2002), and the one with the lowest DIC value was selected (the DIC values for all competing models are provided in online supplementary material, Section 7 of the Appendix). Our modelling identified 2015 as the year in which the network relationships changed the most. The AUC values computed at each year for this model are all above 0.976, and the overall AUC value computed across all times is 0.988. From this model, we obtain the posterior means and 95% credible intervals for the parameters δ, , , and γb, for each of the two time periods 2010–2014 and 2015–2020.
Edge persistence appears to be fairly stable in the two time periods (shown in online supplementary material, Figure 1 in the Appendix). Figure 5 illustrates the evolution of within-group attraction/repulsion for Democrats, for Republicans, and between-group attraction/repulsion γb. The between-group coefficient γb (yellow bars) is negative in both time periods, although its magnitude increases a bit (mean increase = 0.027, SE = 0.051, P(increase > 0) = 0.701) in the second time period from 2015 to 2020. This suggests polarization across the sets of Republican and Democratic members of Congress appeared throughout the past decade, with some indication that it started to rise in 2015.
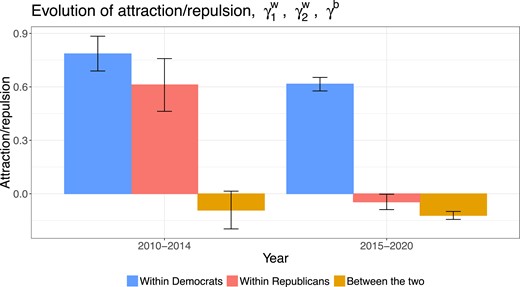
Evolution of posterior means and 95% CI for within-group attraction/repulsion for Democrats, for Republicans, and between-group attraction/repulsion γb in Twitter congressional hashtag networks. Polarization between two parties appeared in both time periods. The within-group coefficients for both parties decreased, falling to negative for Republicans.
The within-group attraction coefficients for Democrats (left bars) remain fairly large for the two time periods, albeit with a slight drop in the second period, while those for Republicans (middle bars) exhibit a steeper downward trend falling from positive to negative. That is, for Democratic members of Congress the interactions with their own party have remained fairly strong, even after 2015 and during unified government under the Trump administration. For Republicans, however, the interactions with their own party are weaker than they are for Democrats prior to 2015. Most intriguing, perhaps, Republican in-party interactions became negative in 2015. That is, during the Trump administration, Republican members of Congress not only remained disengaged with Democrats but also began to disengage with their own—i.e., a decrease in strength of in-group interaction.
By comparing the magnitude of within-group coefficients (left or middle bars) with between-group coefficients (yellow bars), we find that for Democratic members of Congress positive partisanship dominated the entire time period of study from 2010 to 2020. Democrats interactions with their own was a binding feature of their polarization. In contrast, for Republican members of Congress disengagement with Democrats started to dominate interactions with their own in 2015 . Indeed, Republicans’ interactions with their own party fell as well. Although not explicitly tested, the evidence here suggests that Trump’s extensive appearance in social media and candidacy declaration in 2015 either caused or occurred in conjunction with the take-over of negative partisanship for Republican members of Congress. Whether due to long evolving attitudes within members of Congress or concurrent political trends, or simply reactions to the new presidential candidate, from 2015 to 2020 Republican members of Congress were defining their online partisanship more in terms of their disengagement with Democrats than engagement with other Republicans.
We have so far restricted the analysis to only one change-point. We could of course continue this analysis with more than one change-point. For example, we have run a series of models with two change-points chosen between 2012 and 2019, and selected that model with the lowest DIC value, which places change-points at year 2014 and 2019. However, the relative improvement of this model over that with a single change-point is quite modest. See online supplementary material, Section 7 of the Appendix for details.
4.2 Reddit data analysis
In this section we carry out the same line of analysis on the Reddit comment networks for the public. Recall that the Reddit data collected are from April 2015 to March 2020. Each network constructed represents the interaction during a one-year period from April of a given year to March the year after, and hence there are in total five networks constructed. We fit a model with a single set of parameters for the entire 2015–2020 period. In addition, we fit a series of models with a single change-point and selected the one with lowest DIC value, which places that change-point at the year 2018, three years after the change-point for elites. Again, the models appear to fit the data quite well, although arguably slightly worse than in the case of the Twitter networks (e.g., with AUC values for the best fitting change-point model computed at each one-year period above 0.840 and overall AUC values above 0.890).
Table 2 and Figure 6 show the results from fitting without a change-point, analogous to Table 1 and Figure 4 for the Twitter data. Figure 7 displays the evolution of the with-in group coefficients for the two groups and the between-group coefficient, in analogy to Figure 5 for the Twitter data. (Similarly, ‘online supplementary material, Figure 2 in the Appendix displays the evolution of edge persistence, in analogy to online supplementary material, Figure 1 in the Appendix.)
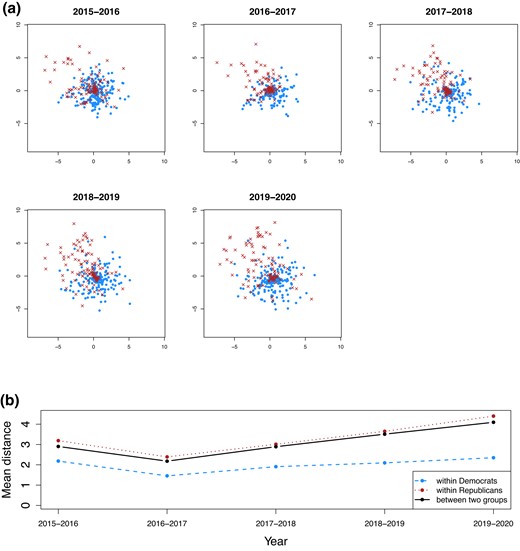
Top: Posterior means of latent positions for Reddit comment networks. Dot-Democrats, Cross-Republicans. The dynamics of the latent positions is consistent with the evolution of within/between party densities seen in the bottom panel of Figure 1. Bottom: Mean latent distances within each group and between groups.
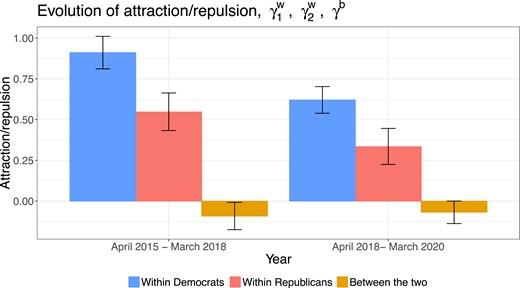
Evolution of posterior means and 95% CI for within-group attraction for Republicans, for Democrats, and between-group attraction/repulsion γb in Reddit comment networks. Polarization across the two sets of Reddit users appeared for both two time periods, and the within-group attraction declined over time for both two groups.
Summary statistics for the posterior distribution of parameters using the whole sequence of Reddit networks from 2015 to 2020
| Mean | 2.521 | 3.079 | 0.937 | 0.748 | 0.401 | −0.128 |
| SD | 0.132 | 0.011 | 0.010 | 0.032 | 0.041 | 0.027 |
| 2.5% Quantile | 2.273 | 3.056 | 0.917 | 0.686 | 0.321 | −0.182 |
| 97.5% Quantile | 2.791 | 3.101 | 0.957 | 0.811 | 0.482 | −0.075 |
| Mean | 2.521 | 3.079 | 0.937 | 0.748 | 0.401 | −0.128 |
| SD | 0.132 | 0.011 | 0.010 | 0.032 | 0.041 | 0.027 |
| 2.5% Quantile | 2.273 | 3.056 | 0.917 | 0.686 | 0.321 | −0.182 |
| 97.5% Quantile | 2.791 | 3.101 | 0.957 | 0.811 | 0.482 | −0.075 |
Notes. 1-Democrats, 2-Republicans. The estimated variance for the initial distribution of latent positions is much smaller than that for the Twitter data due to the initial Reddit network being much denser. This results indicate presence of edge persistence (), higher within-group attraction for Democrats than Republicans ( (mean difference = 0.347, SE = 0.035)), presence of between-group repulsion (), and less magnitude of between-group repulsion than within-group attraction for both Democratic and Republican Reddit users ( (mean difference = −0.620, SE = 0.021)), (mean difference = −0.273, SE = 0.026)).
Some conclusions regarding evolution across the two time periods: (1) edge persistence increased (); (2) between-group repulsion was present, demonstrating polarization across the sets of Democratic and Republican users of Reddit, though with some evidence that such polarization was mitigated (, P(decrease > 0) = 0.668) in the second time period starting in 2018; (3) while the two groups have moved away from one another, both experienced positive partisanship (within-group attraction) and became less concentrated over time, as both groups experienced a decline in within-group attraction in the second time period; and (4) positive partisanship dominated the entire time period for both Democrat and Republican users of Reddit. The latter finding is particularly notable, since it suggests different polarization trends among the public than what we found above among members of Congress. Though they are different social media platforms and we have a shorter time-span on Reddit, the consistent dominance of positive partisanship for both Republicans and Democrats among the public and the dominance of negative partisanship among Republican elites over the same period suggests a disconnect between elites and the public, an early focus of debate in the polarization literature (Abramowitz & Saunders, 2008; Fiorina et al., 2005).
5 Discussion
We develop a two-group CLSNA model for characterizing the dynamics of polarization in social networks. This model incorporates the effects of both attraction and repulsion by specifying appropriate attractor functions to explain the factors driving network interactions. It may be viewed as a type of causal modelling framework (in the spirit of, say, Granger causal modelling Granger, 1969), specifically designed to combine dynamical systems from mathematical modelling with principles of hierarchical statistical modelling. The former allows us to incorporate precise notions of attraction/repulsion relevant to polarization, while the latter permits principled and computationally tractable inferences in the form of statistical estimation, testing and prediction.
While we focus on the context of polarization with the two-group version of CLSNA model, our proposed class of CLSNA models is a flexible framework which may incorporate a variety of attractor functions, making it general and quite broadly applicable to other coevolutionary social dynamics where behaviours and beliefs impact social interactions, and vice versa. One limitation of our model, as implemented here, is that we assume the node set is fixed over time, which restricts our focus on individuals who are active for the entire period of study. Those who come and go and stay active for only a certain period of time, which is common in practice, is not currently accounted for in our model. It is an interesting subject for future research to design dynamic network models allowing for varying set of nodes.
Considering that the current model is defined for binary edges, and there are many other ways of constructing binary networks from Twitter and Reddit data besides the way we choose, it is of interest to assess the robustness of our results to different network constructions. We explore robustness by fitting models to sequences of networks constructed differently, for example, Twitter networks constructed from a static threshold with value 10, and Reddit networks constructed from using yearly averages as thresholds. Details on the robustness analysis are provided in online supplementary material, Section 8 of the Appendix. In general the qualitative conclusions under the whole sequence analysis are quite robust except for two aspects: the qualitative conclusion we have on the dominance of between-group repulsion for Republicans in Twitter and that on the presence of polarization in Reddit seem to be sensitive to the choice of network constructions. This speaks to the other limitation of our model in that it only accounts for binary networks, and some results could vary upon different dichotomizations. It is possible to extend the current model to weighted networks by using a link function to model the mean of the edge weights (Sewell & Chen, 2016). However, this is for future research and beyond the scope of the present work.
Model selection is an important step in the model fitting process, which pertains to choosing the number of dimensions of the latent space and finding the best place for the change-point. In this paper, we choose to use DIC for comparing fitted models due to its simplicity and popularity in the Bayesian community. However, there are a variety of other approaches for model selection, for example, using other information criteria (e.g., AIC, BIC, WAIC), and cross-validation. There is also work done, for example, Vehtari et al. (2017), on accounting for uncertainty in the information criteria. Such alternative criteria could of course be used in our work and we leave the details of the adaptation of such methods to the class of models studied in this paper as future work.
We also note that the networks studied in this paper are not sparse. While this is not a big issue for moderate size latent space models, it would potentially become an issue for other approaches such as exponential random graph models. It would certainly be of interest to incorporate sparseness in our models and study its effect. This is another topic for future research.
In this article, we focus the application of our model on two online longitudinal social networks, one of the political elite via Twitter, and one of the public, via Reddit. Our model has captured, disentangled and quantified two key aspects of polarization, positive and negative partisanship, as well as a concept in social network theory, edge persistence. Our results show that for members of Congress active on Twitter polarization across the two parties appeared throughout the past decade. We also study the time-varying aspects of attraction, repulsion and edge persistence by fitting a change-point version of our model. Results show that for Republican members of Congress, disengagement with the other party began to dominate engagement with their own in 2015, while disengagement with their own party also decreased at this time. Thus, among Republican members of Congress we find that increasing disengagement with the out-group party is not necessarily accompanied by strong in-group attachments. In fact, within-party forces for Republican members of Congress became negative after 2015. In contrast, for Democratic members of Congress positive partisanship was strongest throughout the entire period of study. We also find evidence of polarization among the public on Reddit. However, here positive partisanship dominated the full length of study for both Democrats and Republicans. Thus, the results provide only limited support for the increasing role of negative partisanship in polarization. In all, through the modelling and analyses of social media data of both the public and the political elite in the US, this work provides new insights into the nature and presence of polarization, as well as how positive and negative partisanship play roles and evolve over time.
Acknowledgments
We are very grateful to Luis Carvalho and Herbert Weisberg for their valuable insights and discussions.
Funding
This research was supported by ARO award W911NF1810237, NSF DMS-2107856, and NSF SES-2120115.
Supplementary material
Supplementary material is available online at Journal of the Royal Statistical Society: Series A.
References
Author notes
Conflict of interest: None declared.
