


Abstract
Invasive candidiasis is the most common invasive fungal disease in children and adolescents, but there are limited pediatric-specific antifungal effectiveness data. We compared the effectiveness of echinocandins to triazoles or amphotericin B formulations (triazole/amphotericin B) as initial directed therapy for invasive candidiasis.
This multinational observational cohort study enrolled patients aged >120 days and <18 years with proven invasive candidiasis from January 1, 2014, to November 28, 2017, at 43 International Pediatric Fungal Network sites. Primary exposure was initial directed therapy administered at the time qualifying culture became positive for yeast. Exposure groups were categorized by receipt of an echinocandin vs receipt of triazole/amphotericin B. Primary outcome was global response at 14 days following invasive candidiasis onset, adjudicated by a centralized data review committee. Stratified Mantel-Haenszel analyses estimated risk difference between exposure groups.
Seven-hundred and fifty invasive candidiasis episodes were identified. After exclusions, 541 participants (235 in the echinocandin group and 306 in the triazole/amphotericin B group) remained. Crude failure rates at 14 days for echinocandin and triazole/amphotericin B groups were 9.8% (95% confidence intervals [CI]: 6.0% to 13.6%) and 13.1% (95% CI: 9.3% to 16.8%), respectively. The adjusted 14-day risk difference between echinocandin and triazole/amphotericin B groups was −7.1% points (95% CI: −13.1% to −2.4%), favoring echinocandins. The risk difference was −0.4% (95% CI: −7.5% to 6.7%) at 30 days.
In children with invasive candidiasis, initial directed therapy with an echinocandin was associated with reduced failure rate at 14 days but not 30 days. These results may support echinocandins as initial directed therapy for invasive candidiasis in children and adolescents.
NCT01869829.
Invasive candidiasis is a leading cause of healthcare-associated infections [1, 2]. Optimizing initial treatment is critical, as this infection results in significant morbidity and attributable mortality [3]. Multiple trials in adults have assessed efficacy for invasive candidiasis [4–9]. A patient-level quantitative meta-analysis of clinical trial data in adults found that echinocandins conferred a significant survival benefit compared with triazole or amphotericin B formulation antifungals [10]. This informed the 2016 Infectious Diseases Society of America’s (IDSA) strong recommendation for echinocandins as initial therapy [11]. However, the IDSA recommendations are limited to adult patients as there is a lack of comparative effectiveness data from studies specific to children and adolescents.
There are critical differences between pediatric and adult invasive candidiasis, including different predisposing factors, variability in Candida spp. epidemiology, and variation in outcomes [3, 12, 13]. These differences limit the generalizability of adult data to children and adolescents. A pediatric randomized clinical trial would be ideal, yet expensive and unlikely to be performed. Therefore, the International Pediatric Fungal Network performed a prospective, multinational observational cohort study called PEdiatric Antifungal Comparative Effectiveness (PEACE) to assess the comparative effectiveness of initial antifungal therapy for the treatment of invasive candidiasis in children and adolescents.
METHODS
Study Design
PEACE is a prospective observational cohort study conducted by the International Pediatric Fungal Network [14]. Forty-eight sites (32 United States and 16 international) were included (eTable 1, Supplementary Material 1). Each site obtained institutional review board approval, with informed consent determined locally.
Patients
Eligible children were aged >120 days and <18 years at diagnosis of proven invasive candidiasis, defined according to European Organization for Research and Treatment of Cancer (EORTC)/Mycoses Study Group (MSG) consensus definitions [15]. Proven invasive candidiasis requires isolation of Candida spp. from a sterile site. Enrollment started on January 1, 2014, and continued until 750 invasive candidiasis episodes were identified. Qualifying cultures for each episode were the first Candida sterile specimen. Only the primary episode per patient was analyzed. Based on recommendations from a peer review, patients with a qualifying culture from the central nervous system were excluded as unlikely to be eligible for echinocandin treatment. Patients who died or were discharged prior to culture positivity were excluded.
Exposure Groups
Exposure, initial directed antifungal therapy, was defined as the agent given the day after the qualifying culture was identified as positive for yeast. Patients whose positive culture result was >5 days after the acquisition were excluded.
Primary exposure groups were: (1) patients who received echinocandins (caspofungin, micafungin, or anidulafungin) and (2) patients who received triazoles (fluconazole or voriconazole) or an amphotericin B formulation (amphotericin B deoxycholate, amphotericin B lipid complex, or liposomal amphotericin B). The prespecified decision to combine triazoles and amphotericin B formulations into one group (triazole/amphotericin B) was based on similar failure rates in an adult patient-level quantitative meta-analysis [10]. Patients who did not receive an antifungal or received ≥2 agents as initial directed therapy were excluded.
Outcome
The primary outcome was global response at 14 days after qualifying culture. Patients discharged before day 14 had global response assessed at discharge. Site investigators categorized global response as complete response, partial response, stable response, disease progression, or death; outcomes were dichotomized into “success” (complete and partial response) or “failure” (stable response, disease progression, or death) according to EORTC/MSG criteria (Table 1) [16]. The centralized Data Review Committee (R. L. W., E. C., and Z. D. P.) reviewed all episodes reported as partial response, stable response, or disease progression, and a 5% random selection of complete response episodes. This committee confirmed outcome designation, requested clarification, or, upon majority agreement, changed designation. A secondary outcome, global response at 30 days, used the same methods.
Definitions of Global Outcomes From Mycoses Study Group and European Organization for Research and Treatment of Cancer Consensus Criteria [16]
| Dichotomized Outcome | Score | Clinical Outcome |
|---|---|---|
| Success | 1 | Success-Complete: Survival and resolution of all attributable symptoms and signs of disease PLUS documented clearance of pathogen from the blood PLUS documented clearance of infected sites that are accessible to repeated sampling (eg, CSF). If additional cultures are not feasible, survival and resolution of all attributable symptoms and signs of disease and radiological resolution can be equated with a complete response. |
| 2 | Success-Partial: Survival and improvement of attributable symptoms and signs of disease PLUS documented clearance of blood PLUS documented clearance of infected sites that are accessible to repeated sampling. If additional cultures are not feasible, survival and resolution of attributable symptoms and signs of disease and radiological improvement or stabilization can be equated with a partial response. | |
| Failure | 3 | Failure-Stable: Survival and minor or no improvement in attributable symptoms and signs of disease PLUS persistent isolation of Candida species from blood specimens or specimens from other sterile sites. If additional cultures are not feasible, radiological stabilization can be equated with a stable response. |
| 4 | Failure-Progression: Persistent isolation of Candida species from blood specimens or specimens from other sterile sites in association with worsening clinical symptoms or signs of disease (eg, septic shock and progression of hematogenous cutaneous candidiasis) OR new sites of disease or worsening of preexisting lesions radiologically (eg, those observed in chronic disseminated candidiasis) in association with clinical deterioration. | |
| 5 | Failure-Death |
Covariates
Variables for demographics, comorbidities, clinical and immunologic risk factors, concurrent infections, anti-infective and immunosuppressive agents, and management of central vascular catheters were captured from 14 days prior through 30 days after qualifying culture collection. Antifungal prophylaxis was defined as systemic therapy within 5 days prior to qualifying culture collection. Empirical antifungal therapy was systemic therapy given anytime from the day of qualifying culture collection until the day of culture positivity. Sensitivity analyses were performed to assess hospital location as a potential confounder.
Data Collection
Data were prospectively collected using Research Electronic Data Capture (REDCap) [17]. The coordinating center was Duke University; the analysis center was Children’s Hospital of Philadelphia. Patient data were entered by sites and reviewed by the coordinating center with quarterly automated data checks with queries to sites.
Statistical Analysis
Appendix A in Supplementary Material 2 represents the statistical analytic plan. In brief, anticipated enrollment was 750 episodes, with 300 echinocandin and 450 triazole/amphotericin B recipients. Failure rates using the published definition in a pediatric cohort are not known. Prior adult studies found mortality exceeding by 30% [10]. Assuming a lower failure rate in children, we estimated the failure rate in this cohort at 17.5%. Based on an interim assessment, a May 9, 2017, amendment reduced the estimated overall event rate to 15%. Assuming this revised failure rate, planned cohort size, and employing a Bayesian power calculation that incorporated prior results among adults, estimated that power was adequate (80%) to detect a failure risk difference of 6.6% points at a significance level of 0.05 [18].
Owing to the differences in number of days from culture acquisition to the first evidence of yeast, time from a positive culture result to the prespecified outcome day varied. Therefore, prior to analyses, participants were grouped into 4 strata according to the number of days from qualifying culture collection to positivity (0-1, 2, 3, and 4-5 days) to adjust for differences in follow-up duration.
Primary and Secondary Analyses
The primary analysis used a stratified Mantel-Haenszel approach [19] to estimate risk difference and relative risk with 95% confidence bounds by exposure group across the 4 culture positivity strata. This nonparametric approach avoided assumptions and possible misspecification inherent in regression models [19–21]. For confounding control, we included additional stratification factors to account for imbalanced baseline covariates between the echinocandin and triazole/amphotericin B groups. Combined across strata estimates for relative risk used Mantel-Haenszel weights. Owing to sparse data when stratified, comparable stratified weighted estimates were implemented using Böhning and colleagues [22] approach. Analyses were performed for the 14- and 30-day global response outcomes separately. After primary analysis, E-values were computed to assess the robustness of results to unmeasured confounding [23, 24]. The E-value represents a translation of measures of association and their confidence bounds into measures of robustness to possible confounding.
As a hospital could prefer an initial directed therapy, center-level confounding was possible and 2 sensitivity analyses were performed. The first was limited to hospitals reporting balanced use of echinocandin or triazole/amphotericin B antifungals (40%-–60% of participants received echinocandin or triazole/amphotericin B), and the second compared high-echinocandin hospitals (>60% received echinocandin) to high-triazole/amphotericin B hospitals (>60% received triazole/amphotericin B). In the balanced use analysis, exposure was the initial directed therapy, whereas, in the high-echinocandin to high-triazole/amphotericin B analysis, exposure was the hospital type (high echinocandin or high triazole/amphotericin B). The former compares exposures at hospitals with no clear initial directed therapy preference, whereas the latter assesses the impact of hospital preference on outcomes.
We calculated 95% confidence bounds by resampling at the hospital level with replacement, and then estimating the Mantel-Haenszel for each sample, to ensure that confidence intervals accounted for cross-hospital variation (and within-hospital correlation) of outcomes. Point estimates of risk difference and relative risk were considered statistically significant if the 95% confidence bounds excluded zero and one, respectively. Statistical analyses were performed with SAS version 9.4, (Cary, NC, USA) Stata version 15.1 (College Station, TX, 2018), and R (R Foundation for Statistical Computing, Vienna, Austria. http://www.R-project.org/).
Post Hoc Analyses
Echinocandin exposure was compared with triazole and amphotericin B formulation exposure separately. There was greater covariate imbalance by exposure, and thus a 2-stage, generalized propensity score with additional regression adjustment was implemented [25]. Post hoc analysis of the primary outcome limited to candidemia only was also performed.
RESULTS
Between January 1, 2014, and November 28, 2017, 750 episodes of invasive candidiasis were identified from 698 participants at 43 centers. After excluding 209 episodes (Figure 1), 541 participants (235 in the echinocandin group and 306 in the triazole/amphotericin B group; eTable 2, Supplementary Material 1) at 40 centers remained. Participants in the groups were comparable by sex, race, and ethnicity (Table 2). The echinocandin group had a greater proportion of adolescents and fewer children <2 years of age. Echinocandin-exposed participants more frequently had recent Gram-negative bacteremia, chemotherapy, and high-dose steroids. eTables 3 and 4 (available in Supplementary Material 1) present similar data for balanced use hospitals and high-echinocandin and high-triazole/amphotericin B hospitals, respectively. C. albicans accounted for one-third of episodes; the most common non-albicans species was C. parapsilosis (Table 3). Blood was the source of qualifying culture in 491 (90.8%) episodes (eTable 5, Supplementary Material 1). The median duration of initial directed therapy was 12 days (range: 1-29) in each group; median duration of follow-up for echinocandin and triazole/amphotericin B groups was 30 (range: 4-30) and 30 days (range: 3-30), respectively.
Baseline Characteristics of 541 Participants Diagnosed With Invasive Candidiasis From 2014 to 2017 at 40 Hospitals
| Antifungal Received | |||
|---|---|---|---|
| Baseline Variable | Total (n = 541) | E (n = 235) | TA (n = 306) |
| Age (y), No. (%)c | |||
| 0.3-1 | 147 (27.2) | 52 (22.1) | 95 (31.0) |
| 2-4 | 158 (29.2) | 70 (29.8) | 88 (28.8) |
| 5-12 | 139 (25.7) | 62 (26.4) | 77 (25.2) |
| ≥13 | 97 (17.9) | 51 (21.7) | 46 (15.0) |
| Birth sex, No. (%) | |||
| Male | 308 (56.9) | 135 (57.5) | 173 (56.5) |
| Female | 233 (43.1) | 100 (42.6) | 133 (43.5) |
| Latino/Hispanic | 118 (21.8) | 49 (20.8) | 69 (22.5) |
| Race, No. (%)a | |||
| White/Caucasian | 336 (62.1) | 140 (59.6) | 196 (64.1) |
| Black/African-American | 113 (20.9) | 48 (20.4) | 65 (21.2) |
| Asian | 17 (3.1) | 7 (3.0) | 10 (3.3) |
| American Indian/Alaska Native/Native Hawaiian or Other Pacific Islander | 8 (1.5) | 6 (2.6) | 2 (0.7) |
| Other/multiple unspecified races | 22 (4.1) | 15 (6.4) | 7 (2.3) |
| Race unknown/not reported/refused | 59 (10.9) | 25 (10.6) | 34 (11.1) |
| Underlying condition, No. (%)b | |||
| Gastrointestinal insufficiency | 182 (33.6) | 80 (34.0) | 102 (33.3) |
| Malignancyc | 152 (28.1) | 76 (32.3) | 76 (24.8) |
| Hematological malignancy | 89 (16.5) | 42 (17.9) | 47 (15.4) |
| Solid tumor malignancy | 66 (12.2) | 35 (14.9) | 31 (10.1) |
| Solid organ or hematopoietic stem cell transplant | 76 (14.0) | 35 (14.9) | 41 (13.4) |
| Congenital/genetic/metabolic disorder | 66 (12.2) | 20 (8.5) | 46 (15.0) |
| Trauma requiring surgery | 46 (8.5) | 18 (7.7) | 28 (9.2) |
| Respiratory/cardiac insufficiency | 38 (7.0) | 22 (9.4) | 16 (5.2) |
| Neurological disorder | 28 (5.2) | 9 (3.8) | 19 (6.2) |
| Renal/hepatic insufficiency | 26 (4.8) | 9 (3.8) | 17 (5.6) |
| Inherited immunodeficiency | 20 (3.7) | 7 (3.0) | 13 (4.2) |
| Bone marrow disorder | 19 (3.5) | 8 (3.4) | 11 (3.6) |
| Autoimmune condition | 14 (2.6) | 10 (4.3) | 4 (1.3) |
| Prematurity | 7 (1.3) | 4 (1.7) | 3 (1.0) |
| Endocrine disorder | 6 (1.1) | 1 (0.4) | 5 (1.6) |
| No condition reported | 8 (1.5) | 4 (1.7) | 4 (1.7) |
| Days of ANC < 500 cells/µL from 3 d prior to and including the day of culture result, No. (%) | |||
| 0 | 436 (80.6) | 185 (78.7) | 251 (82.0) |
| 1 | 12 (2.2) | 7 (3.0) | 5 (1.6) |
| 2 | 15 (2.8) | 8 (3.4) | 7 (2.3) |
| 3 | 12 (2.2) | 7 (3.0) | 5 (1.6) |
| 4 | 66 (12.2) | 28 (11.9) | 38 (12.4) |
| Days of therapy of nephrotoxic drugs from 3 d prior to and including the day of culture result, No. (%)d | |||
| 0 | 197 (36.4) | 85 (36.2) | 112 (36.6) |
| 1-2 | 146 (27.0) | 61 (26.0) | 85 (27.8) |
| >2 | 198 (36.6) | 89 (37.9) | 109 (35.6) |
| Any parenteral nutrition on day of culture result, No. (%) | 292 (54.0) | 130 (55.3) | 162 (52.9) |
| Mechanical ventilation at any time from 3 d prior to and including the day of culture result, No. (%) | 111 (20.5) | 48 (20.4) | 63 (20.6) |
| Vasopressor use at any time from 3 d prior to and including the day of culture result, No. (%) | 67 (12.4) | 30 (12.8) | 37 (12.1) |
| Dialysis at any time from 3 d prior to and including the day of culture result, No. (%) | 38 (7.0) | 16 (6.8) | 22 (7.2) |
| Intensive care unit admission at any time from 3 d prior to and including the day of culture result, No. (%) | 167 (30.9) | 74 (31.5) | 93 (30.4) |
| Nonsteroid chemotherapy for hematological or solid tumor malignancy at any time from 2 wk prior to and including the day of culture resultc | |||
| Not applicable—no hematological malignancy or solid tumor | 389 (79.1) | 159 (67.7) | 230 (75.2) |
| No chemotherapy | 45 (8.3) | 17 (7.2) | 28 (9.2) |
| Chemotherapy | 107 (19.8) | 59 (25.1) | 48 (15.7) |
| Bacteremia identified from 5 d prior to and including the day of initial directed therapy, No. (%) | 136 (25.1) | 69 (29.4) | 67 (21.9) |
| Gram-negative bacteremia, No. (%)c | 79 (14.6) | 44 (18.7) | 35 (11.4) |
| Gram-positive bacteremia, No. (%) | 80 (14.8) | 34 (14.5) | 46 (15.0) |
| Any systemic antifungal use during the prophylaxis period, from 5 to 1 d prior to culture collection, No. (%) | 82 (15.2) | 36 (15.8) | 46 (15.0) |
| Any systemic antifungal use during the empirical period, from the day of culture collection to the day of culture result, No. (%) | 510 (94.3) | 220 (93.6) | 290 (94.8) |
| All central catheters removed/replaced between the day of culture collection and day of culture result, No. (%) | |||
| Not applicable (No central catheters on day of culture collection) | 32 (5.9) | 11 (4.7) | 21 (6.9) |
| No | 306 (56.6) | 132 (56.2) | 174 (56.9) |
| Yes | 203 (37.5) | 92 (39.1) | 111 (36.3) |
| At least 1 d of systemic corticosteroids received at any time from 14 d prior to and including the day of culture collection, No. (%)c | |||
| None | 360 (66.5) | 148 (63.0) | 212 (69.3) |
| Low dose (<2 mg/kg prednisone equivalent) | 114 (21.1) | 52 (22.1) | 62 (20.3) |
| High dose (≥2 mg/kg prednisone equivalent) | 67 (12.4) | 35 (14.9) | 32 (10.5) |
Abbreviations: E, echinocandins; TA, triazoles or amphotericin B formulations; ANC, absolute neutrophil count.
aParticipants were allowed to report multiple races as well as unknown. Percentages of all subcategories may not add up to 100.
bParticipants may have more than one underlying condition reported. Percentages of all subcategories may not add up to 100.
cCovariates utilized to build composite variable used in stratified Mantel-Haenszel analysis
dNephrotoxic drugs defined as aminoglycosides, foscarnet, cidofovir, and vancomycin.
Candida Species Identified From Qualifying Culture(s)
| Candida Species Identified | Antifungal Received, No. (%) | ||
|---|---|---|---|
| Total (n = 541) | E (n = 235) | TA (n = 306) | |
| C. albicans identified only, No. (%) | 171 (31.6) | 65 (27.7) | 106 (34.6) |
| Single non-albicans identified, No. (%) | 343 (63.4) | 157 (66.8) | 186 (60.8) |
| C. parapsilosis/orthopsilosis/metapsilosis | 156 (28.9) | 49 (20.9) | 107 (35.0) |
| C. tropicalis | 75 (13.9) | 42 (17.9) | 33 (10.8) |
| C. lusitaniae | 36 (6.7) | 20 (8.5) | 16 (5.2) |
| C. glabrata | 35 (6.5) | 28 (11.9) | 7 (2.3) |
| C. guilliermondii | 16 (3.0) | 6 (2.6) | 10 (3.3) |
| C. krusei | 15 (2.8) | 10 (4.3) | 5 (1.6) |
| C. dubliniensis | 6 (1.1) | 2 (0.9) | 4 (1.3) |
| C. pelliculosa | 4 (0.7) | 0 (0) | 4 (1.3) |
| Multiple Candida species identified, No. (%) | 20 (3.7) | 10 (4.3) | 10 (3.3) |
| Single Candida NOS identified, No. (%) | 7 (1.3) | 3 (1.3) | 4 (1.3) |
Abbreviations: NOS, not otherwise specified; E, echinocandins; TA, triazoles or amphotericin B formulations.
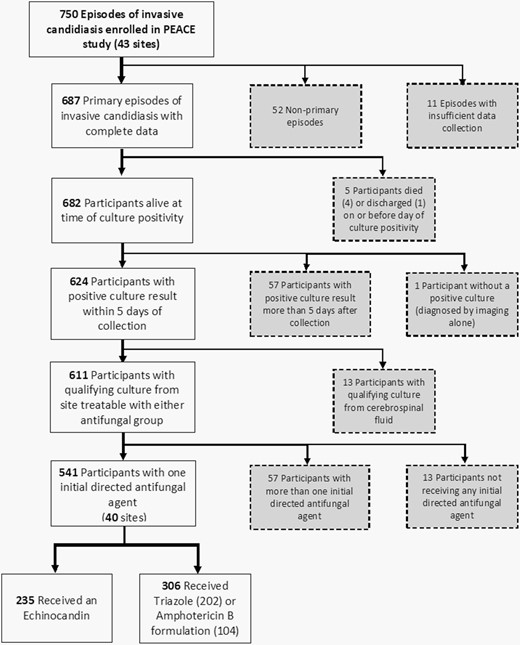
Application of exclusion criteria to determine evaluable episodes for analysis. Patients excluded from analysis appear in gray boxes.
Primary Outcome
Primary Analysis
There were 63 (11.7%) failures (36 stable responses, 6 disease progressions, and 21 deaths) at day 14 (see eTable 6, Supplementary Material 1). Crude failure rates for the echinocandin and triazole/amphotericin B groups were 9.8% (95% confidence intervals [CI]: 6.0% to 13.6%) and 13.1% (95% CI: 9.3% to 16.8%), respectively. The unadjusted risk difference pooled across the 4 strata of initial directed therapy day was −4.0% points (Table 4). After review of baseline covariates between groups (Table 2), the following covariates formed the composite variable for the stratified analysis: hematological/solid tumor malignancy, high-dose corticosteroids within 14 days prior to culture, chemotherapy within 14 days prior to culture, Gram-negative bacteremia between 5 days prior to the day of culture collection and day of initial directed therapy, and age < 2 years (Appendix A section 5.1 in Supplementary Material 2). The adjusted risk difference was −7.1% points (95% CI: −13.1% to −2.4%) and relative risk was 0.64 (95% CI: 0.38 to 0.95).
Comparison of Invasive Candidiasis Failure Rates at 14 days and 30 days of Follow-up Between Exposure Groups for Primary and Sensitivity Analyses
| Unadjusted E Failure Rate | Unadjusted TA Failure Rate | Unadjusted Risk Differencea (95% CI) | Adjusted Risk Differenceb (95% CIc) | Adjusted Relative Risk (95% CIc) | |
|---|---|---|---|---|---|
| Primary analysis – TA = reference group | |||||
| E compared with TA at day 14 | 9.8% | 13.1% | −4.0% (−9.1% to 0.6%) | −7.1% (−13.1% to −2.4%) | 0.64 (0.38 to 0.95) |
| E compared with TA at day 30 | 11.1% | 10.5% | −0.7% (−5.8% to 3.8%) | −0.4% (−7.5% to 6.7%) | 0.90 (0.46 to 1.47) |
| Sensitivity analyses – TA = reference group | |||||
| E compared with TA (balanced hospitalsd) at day 14 | 9.8% | 13.2% | −5.0% (−12.9% to 2.8%) | −4.1% (−18.0% to 3.2%) | 0.62 (0.23 to 1.15) |
| E compared with TA (high E and high TA hospitalsd) at day 14 | 9.8% | 13.0% | −5.8% (−18.6% to 4.4%) | −8.1% (−19.8% to 0.4%) | 0.53 (0.00 to 1.20) |
| E compared with TA (balanced hospitalsd) at day 30 | 13.8% | 9.1% | 2.4% (−6.3% to 9.5%) | 4.0% (−8.0% to 16.0%) | 1.31 (0.28 to 2.83) |
| E compared with TA (high E and high TA hospitalsd) at day 30 | 8.0% | 11.4% | −8.8% (−16.7% to −1.6%) | −8.3% (−18.5% to −1.5%) | 0.28 (0.00 to 0.68) |
Abbreviations: E, echinocandins; TA, triazoles or amphotericin B formulations; CI, confidence intervals.
aStratified Mantel-Haenszel analyses pooled across 4 times to culture result strata.
bStratified Mantel-Haenszel analyses pooled across 24 total strata created from time to culture result (4 strata) and a composite measure of variables, participants aged 0.3-1 y, underlying condition of hematological malignancy or solid tumor malignancy, Gram-negative bacteremia, receipt of high-dose corticosteroids, and receipt of chemotherapy, with levels with small numbers collapsed (6 strata). Sixty-four-level analysis was also performed but not reported due to excessive stratification for the amount of data available. Results from the unreported analysis were similar to the reported results; see text and appendix in Supplementary Material 2 for details.
cCIs resampled using bootstrapping.
dBalanced E/TA and high E/TA use at participating hospitals determined based on the frequency of respective antifungal groups within each hospital; see text and appendix for details.
An E-value assessment determined that an unmeasured confounder would need a relative risk association with initial directed treatment choice and outcome of at least 2.5 to explain away the adjusted relative risk of 0.64. The degree of unmeasured confounding needed to explain away the statistical significance of this adjusted relative risk was 1.3. Finally, an unmeasured confounder would need to have a relative risk of 2.8 to shift the estimated relative risk from 0.64 to 1.1 to suggest echinocandins as inferior.
Secondary Analysis
Among balanced use hospitals, the unadjusted failure rate was 9.8% in the echinocandin group and 13.2% in the triazole/amphotericin B group (Table 4). Among high-echinocandin-use hospitals, the unadjusted failure rate was 9.8%, and at triazole/amphotericin B-use hospitals, the failure rate was 13.0%. Accounting for the same baseline covariates and strata as in the primary analysis, the risk difference between echinocandin and triazole/amphotericin B groups was −4.1% points (95% CI: −18.0% to +3.2%) at balanced hospitals, and the risk difference between high-echinocandin and high-triazole/amphotericin B hospitals was −8.1% points (95% CI: −19.8% to +0.4%).
Post Hoc Analyses
Characteristics of echinocandin, triazole, and amphotericin B groups are shown in eTable 7 available in Supplementary Material 1. Failure rates for the triazole and amphotericin B groups were 9.4% (95% CI: 5.4% to 13.4%) and 20.2% (95% CI: 12.5% to 27.9%), respectively (see eTable 8, Supplementary Material 1). Adjusted risk differences of echinocandin compared with triazole and echinocandin compared with amphotericin B were −3.0% points (95% CI: −11.1% to +4.4%) and −8.5% points (95% CI: −18.6% to −1.5%), respectively (eTable 9, Supplementary Material 1).
The primary analysis was repeated in 491 patients with candidemia only. The adjusted risk difference was −3.0% points (95% CI: −8.0% to 1.6%) and relative risk was 0.81 (95% CI: 0.42 to 1.20).
Secondary Outcome
There were 58 (10.7%) failure events (14 stable responses, 4 disease progressions, and 40 deaths) at day 30 (eTable 6, Supplementary Material 1). Failure rates for echinocandin and triazole/amphotericin B groups were 11.1% (95% CI: 7.1% to 15.1%) and 10.5% (95% CI: 7.0% to 13.9%), respectively. The 30-day outcome analysis yielded a risk difference of −0.4% points (95% CI: −7.5% to +6.7%) and relative risk of 0.90 (95% CI: 0.46 to 1.47) between the echinocandin and triazole/amphotericin B groups (Table 4).
At balanced use hospitals, the unadjusted failure rate was 13.8% in the echinocandin group and 9.1% in the triazole/amphotericin B group. At high-echinocandin or triazole/amphotericin B use hospitals, the unadjusted failure rate was 8.0% in the echinocandin group and 11.4% in the triazole/amphotericin B group. The 30-day adjusted risk difference between the echinocandin and triazole/amphotericin B groups for balanced use hospitals was +4.0% points (95% CI: −8.0% to +16.0%), and the 30-day adjusted risk difference between participants at high-echinocandin and high-triazole/amphotericin B hospitals use was −8.3% points (95% CI: −18.5% to −1.5%)(Table 4).
DISCUSSION
In this pediatric prospective, multinational observational study, initial directed antifungal therapy with an echinocandin for proven invasive candidiasis reduced the risk for failure at 14 days after culture collection when compared with a triazole or amphotericin B formulation. The estimated risk difference in balanced use hospitals was in the same direction as the estimated risk difference from the primary analysis, suggesting that the results may be robust to potential confounding arising from unequal echinocandin usage rates across hospitals.
Prior comparative pediatric data were limited to a randomized trial of micafungin and liposomal amphotericin B in 106 children [26] and a retrospective single-institution study comparing fungicidal (echinocandin or amphotericin B formulation) to fungistatic (triazole) agents [27]. Neither study found a difference; however, they were small cohorts. A pooled patient-level quantitative analysis of multiple trials in adults [4–9] found 30-day echinocandin-exposed participants to have a relative risk reduction of 0.75 and absolute risk reduction of 9% points [10]. Our adjusted relative risk reduction at 14 days was similar at 0.64, suggesting that echinocandins have a comparable relative impact in children. The estimated absolute risk reduction (7.1% points) is less than that reported in adults. Nonetheless, this translates into a potentially clinically relevant reduction. In a post hoc analysis limited to candidemia only, the estimated absolute risk reduction was less (3.0% points). This suggests that the benefit of echinocandins may be realized in children with more complicated invasive candidiasis where the risk of failure may be greater.
Echinocandins did not significantly reduce 30-day failure rates. Assessment of the change in the proportion of failure subcategories from 14 to 30 days (eTable 6, Supplementary Material 1, and Appendix B Section B.2, Supplementary Material 2) revealed that the most frequent transition from failure to success for the triazole/amphotericin B group was in participants who moved from stable response at 14 days to success at 30 days. A similar shift was not seen in echinocandin participants. This raises the possibility that any benefit in initial directed therapy with an echinocandin is realized early in treatment. Notably, the majority of failure events between 14 and 30 days were deaths, and the proportion of deaths in this time period was similar in the 2 exposure groups. This suggests that the extended follow-up period may capture deaths unrelated to invasive candidiasis.
Secondary and post hoc analyses identified adjusted risk difference point estimates generally in the direction of protective effect of echinocandins. While these results are limited by smaller sample sizes, they support the protective effect of echinocandins as initial directed therapy. Of note, not all point estimates at 30-day follow-up were in the direction of echinocandin benefit, as the adjusted risk difference point estimate at balanced hospitals was in the direction of benefit from triazole/amphotericin B therapy.
This study has several limitations. First, despite 750 proven invasive candidiasis episodes, a larger proportion than anticipated was excluded from analyses. Additionally, the cohort failure rate was less than the anticipated 15%. Despite these factors, a large enough cohort with variation in initial directed therapy remained to allow for planned comparative analyses. Second, there is potential for residual confounding by indication or hospital. An E-value assessment demonstrates that an unmeasured patient-level covariate would have to be strongly related to exposure and outcome and in the opposite direction of measured confounding to explain away the primary findings. As pediatricians are aware of adult guidelines that favor echinocandins, it seems unlikely that unmeasured confounding would be toward the null. Incidentally, preference for an echinocandin in sicker patients may explain the increased proportion of deaths at 14 days in that exposure group (5.1% vs 2.8%). Results from a sensitivity analysis limiting to episodes from hospitals with balanced exposure argue against confounding by hospital. Third, site investigators designated outcomes, raising the possibility for outcome misclassification by center. The central data review committee only changed 12 (4.5%) outcome designations, and none changed were initially declared complete response by the site. Fourth, initial directed therapy was defined at the time of first culture positivity for yeast. As such, the distribution of Candida spp. by exposure group was not considered in adjusted analyses. Candida spp. distribution (Table 3) does reveal variation by exposure group. If there is a differential virulence across species, an imbalance of species by treatment group may explain differences in outcomes. Fifth, it was decided a priori to group triazole- and amphotericin B-exposed participants based on adult data. However, post hoc evaluation found that the failure event proportion was higher in amphotericin B-exposed participants. If this difference in failure rate is due to differential effect of amphotericin B, then combining groups is a limitation. However, this difference in failure may result from confounding by indication (ie, amphotericin B participants are sicker at baseline than azole participants). Sixth, this study characterized exposure as the initial directed therapy, without regard to treatment duration and switching or other time-varying covariates, such as central vascular catheter removal. The proportion of central vascular catheters removed by initial therapy start was similar between groups, but subsequent central vascular catheter removal could have varied. Therefore, the results only inform the initial directed therapy choice and not step-down therapy decisions. Finally, dosage data for initial directed therapy were not complete and thus could not be considered. It is possible that the dosing of echinocandins was more consistent and this led to improved effectiveness.
In children and adolescents with invasive candidiasis, initial directed therapy with an echinocandin was associated with a reduced failure rate at 14 days. If confirmed, these results might support the choice of echinocandins as initial directed therapy for invasive candidiasis in children and adolescents.
Notes
Acknowledgments. We would like to thank Despoina Galetaki, MD, from the Children’s Hospital of Philadelphia for her efforts in preparing figures and tables and in editing the manuscript. We thank Yuan-Shung Wang, MS, from the Children’s Hospital of Philadelphia for her assistance with data organization and cleaning. We thank Sydney Shuster, MPH, from the Children’s Hospital of Philadelphia for her contributions to study coordination as well as her efforts for data entry and data cleaning. We would also like to thank Jhoanna Zaida Aquino, BS, from Duke University for her study coordination efforts and Jeff Hawley, BS, from Duke University for his efforts in database creation and management. Finally, we thank the clinical research assistants at all participating institutions for their commitment to patient screening and chart abstraction. All were compensated for their contributions. Written permission to include the named individuals in this section was obtained. All named individuals and all research assistants received compensation for their work.
Financial support. This work was supported by the National Institute of Allergy and Infectious Diseases at the National Institutes of Health [5R01AI103315] to T. E. Z. and W. J. S.
Role of the funder/sponsor. The National Institute for Allergy and Infectious Diseases was the study sponsor. The study sponsor did not have a role in the conduct of the study; collection, management, analysis, or interpretation of the data; preparation, review, or approval of the manuscript; or decision to submit the manuscript for publication.
Potential conflicts of interest. Please note the following author disclosures and potential conflicts of interest for this manuscript. B. T. F. receives research funding from Pfizer and Merck and serves as Chair of a Data Safety Monitoring Board for Astellas; T. E. Z. provides consultant services for T2 Biosystems and Nabriva Therapeutics; D. L. P. serves on a Data Safety Monitoring Board for Pfizer and receives royalties from UpToDate; L. D. I. received support from Astellas, Merck, Ansun Biopharma, and Shire; M. A. R. receives support from Merck; D. E. Y.’s institution receives funding from Merck, Pfizer, Astellas, Marion Merrel Dow Fund, Viracor-Eurofins, and Chimerix; G. M. receives funding from Astellas; E. R. receives funding from Merck, Pfizer, and Gilead; P. S. P. receives support from Pfizer, Grifols SA, CSL Behring, Shire, and Gilead; W. J. M. receives support from Astellas; N. H. is a consultant for Moderna and receives funding from NIH, CDC, and Sanofi; A. R. H. has patent 10 160 974; M. I. A. receives funding from NIH:NIAID and payments from Imedex and Shire; W. J. S. receives funding from Astellas. All other authors have nothing to disclose. All authors have submitted the ICMJE Form for Potential Conflicts of Interest. Conflicts that the editors consider relevant to the content of the manuscript have been disclosed.
