


Abstract
Natural killer (NK) cells are important for early tumor immune surveillance. In patients with hematological cancers, NK cells are generally functional deficient and display dysregulations in their receptor repertoires. Acute leukemia is the most common cancer in children, and we here performed a comparative phenotypic profiling of NK cells from B-cell precursor acute lymphoblastic leukemia (BCP-ALL) patients to identify aberrant NK cell phenotypes. NK cell phenotypes, maturation, and function were analyzed in matched bone marrow and blood NK cells from BCP-ALL patients at diagnosis, during treatment, and at end of treatment and compared with age-matched pediatric control subjects. Expression of several markers were skewed in patients, but with large interindividual variations. Undertaking a multiparameter approach, we found that high expression levels of NKG2A was the single predominant marker distinguishing NK cells in BCP-ALL patients compared with healthy control subjects. Moreover, naïve CD57−NKG2A NK cells dominated in BCP-ALL patients at diagnosis. Further, we found dysregulated expression of the activating receptor DNAM-1 in resident bone marrow CXCR6+ NK cells. CXCR6+ NK cells lacking DNAM-1 expressed NKG2A and had a tendency for lower degranulation activity. In conclusion, high expression of NKG2A dominates NK cell phenotypes from pediatric BCP-ALL patients, indicating that NKG2A could be targeted in therapies for this patient group.
1. Introduction
Acute lymphoblastic leukemia (ALL) is the most common childhood cancer. Improved risk-adapted treatment protocols aimed at reducing toxicity in low-risk patients while providing more aggressive therapy in high-risk patients have led to 5-year overall survival above 90% for non–high-risk pediatric precursor–B cell acute lymphoblastic leukemia (BCP-ALL).1 Within the BCP-ALL group, around 10% to 15% of children achieving remission will relapse, which may occur despite beneficial scores of residual disease during treatment.
Natural killer (NK) cell functional defects are reported in patients with hematological cancers such as ALL, acute myeloid leukemia (AML) and chronic myeloid leukemia (CML), and myelodysplastic syndrome,2–6 and have been correlated to increased risk of relapse.6,7 NK cells target malignant cells when signals through activating receptors overrides inhibition through inhibitory receptors engaging major histocompatibility complex class I. Low expression of activating receptors on NK cells at diagnosis correlate to the observed low NK cell activity in patients with AML and ALL.2,4–8 In terms of acute leukemia, the activating receptors DNAM-1, NKp46, and NKp30 are suggested to mediate NK cell recognition of blasts. In context of acute leukemia, expression of activating receptors are reduced on NK cells at diagnosis in both adult AML patients and in pediatric BCP-ALL patients, which is linked to ligand-induced downregulation of the receptors.9–14 Low surface expression of activating receptors at diagnosis further correlate to low NK cell activity and increased risk of relapse.4–8 In contrast, the inhibitory NKG2A receptor is expressed at higher levels in NK cells of both adult AML and pediatric BCP-ALL5,15 and is linked to increased risk of remission failure in adult AML patients.5 Understanding the role of endogenous NK cells in controlling leukemia is important to design therapeutic protocols aimed at increasing NK cell–tumor activity. While allogeneic NK cells have been successfully used in therapy, there is also a potential for exploiting the patient's own NK cells to more efficiently target the blasts. We have previously shown that it is possible to sensitize autologous NK cells to resistant ALL blasts.2
There are 2 major populations of circulating NK cells, CD56bright and CD56dim subsets, in which the latter is considered the most differentiated form. Within the CD56dim subset, populations at varying maturational stages exist, in which maturation follows a path of gradual loss of the inhibitory receptor NKG2A and increased expression of CD57 and KIR.16,17 Increased proportions of naïve CD57− NKG2A+KIR− NK cells at diagnosis have been correlated to lower overall survival in adult AML patients.18 In contrast, a predominant naïve CD57−NKG2A+ phenotype in recipients after hematopoietic stem cell transplantation is associated with increased overall survival.19
Bone marrow (BM) additionally contains a distinct population of resident NK cells that uniquely expresses CD69 and the chemokine receptor CXCR6, both markers absent on circulating NK cells.20 CD69 is important for tissue retention of lymphocytes by preventing sphingosine-1-phosphate receptor–dependent egress into blood.21 CXCR6+CD69+ NK cells are also found in spleen and lymph nodes and resemble tissue resident NK cells recently defined in multiple nonlymphoid tissues such as liver, lung, uterus, and nasal cavity.22–28 How this subset is affected by an acute leukemia is currently unknown.
In this study, we analyzed NK cell phenotypes, maturation markers, and cellular function in pediatric BCP-ALL patients at diagnosis and throughout treatment. Matched BM and blood NK cells were compared with gain insights into putative differences between circulating NK cells and NK cells present in the leukemic niche. We found that high expression levels of NKG2A was the most consistent marker of NK cells at diagnosis. Our study indicates that NKG2A represents a target for therapeutic intervention in pediatric acute leukemia.
2. Methods
2.1 Patients and healthy control subjects
Peripheral venous blood (5 mL) and BM aspirates (1 mL) were collected from pediatric BCP-ALL patients (Table 1) admitted between January 2014 and November 2017 at Oslo University Hospital (Oslo, Norway) during routine diagnostic procedures. Peripheral venous blood (n = 57) and BM aspirates (n = 10) were collected from healthy age-matched children undergoing elective procedures at Oslo University Hospital in the period January 2014 to April 2018 (Table 1). All samples were obtained after informed, written parental consent according to the Declaration of Helsinki and the study approved by the South-Eastern Norway Regional Ethical Committee. Patients were treated according to risk-adapted NOPHO (Nordic Society of Paediatric Haematology and Oncology)–ALL 2008 protocol.29 ALL patients were grouped as non–high risk (non-HR) or high risk (HR) at diagnosis based on the white blood cell count and immunophenotype and were further grouped into standard risk (SR), intermediate risk (IR), or HR based on cytogenetics and minimal residual disease after induction therapy on treatment day 29.30 Blood and BM were consecutively collected from patients at diagnosis (n = 47) and end of treatment (after 130 wk, n = 18). Also, samples were collected during treatment; for BCP-ALL on day 79 following induction and consolidation therapy (n = 42). The samples were immediately processed to isolate mononuclear cells by density gradient centrifugation using Lymphoprep (Axis-Shield), and cells were viably cryopreserved in 20% dimethyl sulfoxide and 80% fetal bovine serum (FBS).
Characteristics of healthy control subjects and patients.
| Control subjects | BCP-ALL | Risk groups BCP-ALLa | |||
|---|---|---|---|---|---|
| SR | IR | HR | |||
| No. | 57 | 47 | 31 (66%) | 13 (28%) | 3 (6%) |
| Age at diagnosis, y | 5.0 (0–16) | 4.0 (1–16) | 3.0 (1–16) | 10.0 (2–16) | 2.0 (2–6) |
| Male:female ratio | 2 | 1.23 | 1.21 | 1.6 | 0.5 |
| WBC (×109/L) | — | 7.9 (0.9–167) | 7.2 (0.9–92.5) | 15.3 (1.1–110) | 19.6 (5.6–167) |
| CMV (IgG positive) | — | 18 (38%) | 10 (32%) | 7 (53%) | 1 (33%) |
| Cytogenetics BCP-ALL | |||||
| SRb | — | 15/47 | 14 | 1 | — |
| IRc | — | 1/47 | — | 1 | — |
| HRd | — | 2/47 | — | — | 2 |
| ETV6/RUNX1 | — | 16/47 | 10 | 6 | |
| Trisomy 21 | — | 2/47 | — | 2 | — |
| Others (including CN) | — | 11/47 | 7 | 3 | 1 |
Abbreviations: ALL = acute lymphoblastic leukemia; BCP-ALL = pre–B cell acute lymphoblastic leukemia; CMV = cytomegalovirus; CN = cytogenetics negative; HR = high risk; Ig = immunoglobulin; IR = intermediate risk; MLL = mixed lineage leukemia ; NOPHO = Nordic Society of Paediatric Haematology and Oncology; SR = standard risk; WBC = white blood cell count.
aDay 29 in NOPHO ALL 2008 treatment protocol.
bCytogenetics: hyperdiploidy.
cCytogenetics: dic(9; 20), t(1; 19), Ic21amp = AML1.
dCytogenetics: MLL (11q23), hypodiploidy.
2.2 Antibodies and flow cytometry
Antibodies (all anti-human) used were from BD Biosciences, anti-CD8 (SK1-FITC), anti-CD56 (B159-AF647), anti-CD158e1 (DX9-PE), and anti-CD16 (3G8-FITC); from Thermo Fisher Scientific, anti-CD3 (OKT3-AF700), anti-CD14 (M5E2-PerCP-Cy5.5), anti-CD19 (1D3-PerCP-Cy5.5), and anti-NKG2D (A10-biotin), and anti-NKp30 (AF294D12-Pe-Cy7); from R&D Systems, anti-NKG2C (#134591-AF488); from BioLegend, anti-NKp46 (9E2-BV650), anti-DNAM-1 (11.A8-PE), anti-CD4 (RM4-5-PE/Cy7), anti-CD57 (HNK-1-FITC), anti-CXCR3 (G025H7-BV650), anti-CXCR4 (12G5-BV421), and anti-CXCR6 (K041E5-PerCP-Cy5.5); from LifeSpan Biosciences, anti-CD161 (B199.2-biotin); from Beckman Coulter, anti-NKG2A (Z199-PE-Cy7), anti-CD158a, h (EB6-PE), anti-CD158b1/b2, j (GL183-PE), anti-CD158e1/e2 (Z27.3.7-PE), and CD158i (FES172-PE). Streptavidin-QDot605 was purchased from Thermo Fisher Scientific. Cells were labeled with relevant antibodies and analyzed by Fortessa (BD Biosciences). Frozen samples were thawed and rested overnight in complete culture medium (cRPMI) (RPMI supplemented with 10% FBS, 2-mercaptoethanol, sodium pyruvate, and penicillin/streptomycin) prior to analysis. Dead cells were excluded from analysis using the Fixable Viability Dye eFluor780 (eBiosciences). Lymphocytes (singlets) were gated by forward- and side-scatter characteristics, and human NK cells were gated as live CD56+CD3−CD14−CD19− cells. Data were analyzed using FlowJo version 10.4.1 (TreeStar).
2.3 Degranulation and IFN-γ production
Degranulation by human NK cells were measured by incubating 100 µL peripheral blood mononuclear cells (2 × 10⁶ cells/mL) with 100 µL K562 target cells (2 × 10⁶ cells/mL) in the presence of anti-human CD107a-BV510 (BD Biosciences) for 6 h, with Brefeldin A (Sigma-Aldrich) added at 5 µg/mL for the last 5 h. Cells were fixed with 4% paraformaldehyde for 10 min and permeabilized with 0.5% saponin in phosphate-buffered saline and 2% FBS for 20 min and stained with anti-IFN-γ (BD Biosciences) for 30 min in permeabilization buffer. The human chronic myeloid leukemia cell line K562 (ATCC CCL-243) was maintained in cRPMI.
2.4 Statistical analysis
The data were analyzed using GraphPad Prism (GraphPad Prism 9 Software), R (R Foundation for Statistical Computing, version 4.2.2), and Python (Python Software Foundation, version 3.6.4). Data depicted in graphs are presented as the mean ± SEM. Comparisons within an experimental group of data were performed with 1-way analysis of variance, and with the Mann-Whitney U test to compare data within an experimental group. Unsupervised hierarchical clustering was generated using Euclidean distance. Clustering of markers was performed using the “complete linkage” algorithm using either the R function “hclust”31 or Cluster 3.0 software (ENCODE). Heatmaps were visualized using either the R package NFM.32 Markers with more than 10% missing values were excluded from the analysis, and remaining missing values were imputed using the R package mice.33
3. Results
3.1 Reductions in NK cell degranulation and IFN-γ production at diagnosis and throughout treatment
NK cell effector functions are reportedly reduced in pediatric and adult acute leukemias. We show here that when separately assessing SR and IR patients, NK cell degranulation against sensitive K562 tumor targets was significantly reduced only for the IR group as compared with healthy control subjects and the SR group at diagnosis (Fig. 1A). However, at day 79 degranulation was low for both groups and remained low at the end of treatment. Similarly, IFN-γ production was reduced in NK cells from the IR group at the time of diagnosis (Fig. 1B) but not in the SR patient group. The data thus indicate more functional repression in the IR group. The IR group did not present higher number of blasts at diagnosis than the SR group (Table 1), indicating that the functional suppression may operate through other mechanisms. Only 2 HR group patients were tested, demonstrating low degranulation (average 7% CD107+ NK cells) and low percentage of IFN-γ+ NK cells (average 4.37%) (data not shown).
![Reduced NK cell effector functions in intermediate risk BCP-ALL patients. Peripheral blood mononuclear cells from patients or healthy control subjects (healthy donors [HDs]) were co-incubated with K562 target cells in the presence of anti-CD107a monoclonal antibody for 6 h. NK cells were gated as live CD14/CD19−CD3−CD56dim cells. (A) Degranulation was measured as percentage CD107a+ NK cells. (B) Intracellular IFN-γ production was measured as percentage of CD56dim NK cells. The SR group and IR group were analyzed separately. The box boundaries indicates the 25th and 75th percentile, the bars indicate the 90th and 10th percentiles, while the line within the boxes indicates the median. Data are presented as percentage ± SEM. Statistical significance was calculated using the nonparametrical Mann-Whitney test. *P < 0.05, **P < 0.01.](https://oup.silverchair-cdn.com/oup/backfile/Content_public/Journal/jleukbio/115/2/10.1093_jleuko_qiad112/1/m_qiad112f1.jpeg?Expires=1748285813&Signature=OpLhmpNkSMgn9kIwwGuQyn55PEAPWX3FaqAVOF4XNIy4MYbinE1jSuFo4EL5KSsLGdjOwVJI6lMOvA5ltYbqAPq9nnccxzBopknQ38gjLylUIOPLOAwaucQs-TQ7q3jRlvujYOKZgGM2WzUS1eOjqRKy9IxLfSAhY1EUfpKAa2K9HwDj86lJRQJOan9o0P4WdOPMnk5L2xZ7~mBAmMQuktfTc6npKfeUXTnTMD8m-VzRL4TFszygfmDedijyX2FKcO5WYUxud3FnTDAK2AA3ragDgSIof1tJY2Ax1MEWHn2tKJ-j7a9E4SyL6DD2EdbuQ1bNQ6AGvqlsW5VQA6OaHw__&Key-Pair-Id=APKAIE5G5CRDK6RD3PGA)
Reduced NK cell effector functions in intermediate risk BCP-ALL patients. Peripheral blood mononuclear cells from patients or healthy control subjects (healthy donors [HDs]) were co-incubated with K562 target cells in the presence of anti-CD107a monoclonal antibody for 6 h. NK cells were gated as live CD14/CD19−CD3−CD56dim cells. (A) Degranulation was measured as percentage CD107a+ NK cells. (B) Intracellular IFN-γ production was measured as percentage of CD56dim NK cells. The SR group and IR group were analyzed separately. The box boundaries indicates the 25th and 75th percentile, the bars indicate the 90th and 10th percentiles, while the line within the boxes indicates the median. Data are presented as percentage ± SEM. Statistical significance was calculated using the nonparametrical Mann-Whitney test. *P < 0.05, **P < 0.01.
3.2 Reductions in NKG2D and DNAM-1 expression levels at diagnosis were further exacerbated throughout treatment
Next, expression of activating and inhibitory NK cell receptors was assessed in matched blood and BM samples at the time of diagnosis, during treatment, and at the end of treatment compared with blood and BM from age-matched healthy pediatric control subjects. The frequency of DNAM-1+ NK cells was high on both BM and blood NK cells at diagnosis and comparable to control subjects (Fig. 2A), but the expression levels were greatly reduced on CD56bright and CD56dim NK cells in both SR and IR groups compared with control subjects (Fig. 2B). While normalizing in blood at end of treatment, the frequencies of DNAM-1 remained low in BM. As only 3 HR group patients were included in the study, the phenotypic data were not shown, but tended to accentuate the phenotype of the IR group for all tested markers (data not shown).
![Reduced expression levels of DNAM-1 and NKG2D and increased levels of NKp30 at diagnosis. Box plots showing frequencies or expression levels (relative fluorescence intensity [RFI], median fluorescence intensity of marker/median fluorescence intensity of negative control) of DNAM-1 (A, B), NKG2D (C, D), and NKp30 (E, F) by BM or blood CD56bright (top row) or CD56dim (bottom row) NK cells in BCP-ALL patients compared with healthy pediatric control subjects (healthy donors [HDs]). The SR group and the IR group was analysed separately . The box boundaries indicates the 25th and 75th percentile, the bars indicate the 90th and 10th percentiles, and the line within the boxes indicates the median. Statistical significance was calculated by parametrical 1-way analysis of variance. *P < 0.05, **P < 0.01, ***P < 0.001.](https://oup.silverchair-cdn.com/oup/backfile/Content_public/Journal/jleukbio/115/2/10.1093_jleuko_qiad112/1/m_qiad112f2.jpeg?Expires=1748285813&Signature=wjAgldUQ7ypmJoOc2nIqqI2ugOmFUbfipJLE4s~VpJpiqPxIEtTaa8Slq8zyeK8uc0tVgesPUg18yIwTvqgYdByDaRHgICJeuKmxTQsy4E-51uqKR04SRMMfSm-y8BbrVmHUrahkSBL6EbpXpAegsH1FAqNLIQNqywhmrtpLjnQZ9ZuzbNSnhWatiUkE8JdJEUNJWZUD0Ef-E85jly1VTWqd-rANlk2ymCSMerCobA3FifOQAXXICb6GuFCr4okEmPYkvjlXovDqbGhcm1B8J0txMC~FfNeDJtGagA74hVsUwY~HBaqDgkTbhy8bEwfi91YbwKkBlzQBOljCVgjUWA__&Key-Pair-Id=APKAIE5G5CRDK6RD3PGA)
Reduced expression levels of DNAM-1 and NKG2D and increased levels of NKp30 at diagnosis. Box plots showing frequencies or expression levels (relative fluorescence intensity [RFI], median fluorescence intensity of marker/median fluorescence intensity of negative control) of DNAM-1 (A, B), NKG2D (C, D), and NKp30 (E, F) by BM or blood CD56bright (top row) or CD56dim (bottom row) NK cells in BCP-ALL patients compared with healthy pediatric control subjects (healthy donors [HDs]). The SR group and the IR group was analysed separately . The box boundaries indicates the 25th and 75th percentile, the bars indicate the 90th and 10th percentiles, and the line within the boxes indicates the median. Statistical significance was calculated by parametrical 1-way analysis of variance. *P < 0.05, **P < 0.01, ***P < 0.001.
We observed no major changes in the frequencies of NKG2D+ NK cells at the time of diagnosis in neither BM nor blood, except a tendency for lower frequencies at end of treatment (Fig. 2C). However, like DNAM-1, NKG2D expression levels were reduced at diagnosis in CD56bright and CD56dim NK cells (Fig. 2D) and remained low in the IR group at the end of treatment on both BM and blood NK cells.
We observed highly variable frequencies of NKp30+ NK cells, but NKp30 frequencies were increased as compared with control subjects for CD56bright BM and blood NK cells at the time of diagnosis (Fig. 2E). Also, NKp30 expression levels were increased at the time of diagnosis in both CD56bright and CD56dim blood NK cells (Fig. 2F). The expression levels of NKp30 tended to stay elevated within the IR group. The expression levels and frequencies of CD16 and NKp46 were not significantly altered in NK cells in any of the patient groups at the time of diagnosis, but fell sharply by the end of treatment (data not shown).
3.3 High NKG2A expression levels at diagnosis remain high throughout treatment
The frequencies of NKG2A+ NK cells were largely comparable to healthy control subjects at the time of diagnosis, with a reduction in blood for the IR group at diagnosis (Fig. 3A). At end of treatment, we observed higher frequencies of NKG2A+ CD56dim BM and blood NK cells within the IR group. At diagnosis, the NKG2A expression levels were increased at the time of diagnosis in blood CD56bright and CD56dim NK cells, as well as in BM CD56dim NK cells for the IR group (Fig. 3B). The NKG2A expression levels generally remained elevated throughout treatment.
![Increased expression levels of NKG2A in BCP-ALL patients at diagnosis and throughout treatment. Box plots showing frequencies or expression levels (relative fluorescence intensity [RFI], median fluorescence intensity of marker/median fluorescence intensity of negative control) of NKG2A (A, B) or CD161 (C, D) by BM or blood CD56bright (top row) or CD56dim (bottom row) NK cells. The SR group and the IR group was analysed separately. The box boundaries indicates the 25th and 75th percentile, the bars indicate the 90th and 10th percentiles, while the line within the boxes indicates the median. Statistical significance was calculated by parametrical 1-way analysis of variance. *P < 0.05, **P < 0.01, ***P < 0.001. HD = healthy donor.](https://oup.silverchair-cdn.com/oup/backfile/Content_public/Journal/jleukbio/115/2/10.1093_jleuko_qiad112/1/m_qiad112f3.jpeg?Expires=1748285813&Signature=Q0UdPRhjz3SK0q38GiC-rf31MqCr1gw~5feQ-RKrIiGwd1MLUO7IyrO8KkhLXRRr1IVx~bIDiABYdve7LHtUCDMaoYPzgcvsY3RGHtUsHBY-Ygr0yRadeJ4vGSeGFMgMjd3FqVzX4ijwVACM7Nolag4ZWwrh66wvSyw5MC7k19HiFzlGNxeVK6P7yoDAr6iZIc1etIQmYIz0Ils1~VAokmIe17w-AK5QGFxNP~FNgyzoALe3OBt1CdsJ1jYcSA82Eo2eDxF6w9ESse06G0vgORnrCS1HFJbK8Mu~Xo2qCaco3ROjadXBaq1ZjNq9CpgO7Ejb26pXcXWGWz2L3t8WQg__&Key-Pair-Id=APKAIE5G5CRDK6RD3PGA)
Increased expression levels of NKG2A in BCP-ALL patients at diagnosis and throughout treatment. Box plots showing frequencies or expression levels (relative fluorescence intensity [RFI], median fluorescence intensity of marker/median fluorescence intensity of negative control) of NKG2A (A, B) or CD161 (C, D) by BM or blood CD56bright (top row) or CD56dim (bottom row) NK cells. The SR group and the IR group was analysed separately. The box boundaries indicates the 25th and 75th percentile, the bars indicate the 90th and 10th percentiles, while the line within the boxes indicates the median. Statistical significance was calculated by parametrical 1-way analysis of variance. *P < 0.05, **P < 0.01, ***P < 0.001. HD = healthy donor.
CD161 (NKR-P1A) was not significantly altered at diagnosis, with the exception of higher frequencies by CD56bright BM and blood NK cells within the IR group (Fig. 3C). Sharp reductions of CD161 frequencies were observed for both BM and blood NK cells at end of treatment. No significant changes in the expression levels of CD161 were observed (Fig. 3D).
3.4 High expression levels of NKG2A discriminates NK cells in patients from healthy control subjects
Substantial interindividual variations were observed in receptor frequencies and expression levels. Nonetheless, the data indicated an overall skewing toward decreased expression levels of activating receptors and increased expression levels of NKG2A. We performed an unsupervised hierarchical cluster analysis of 11 surface markers and of intracellular perforin to identify potential aberrant phenotypic signatures at the time of diagnosis. NKp30 and CD16 was excluded from this analysis due to more than 10% missing values. Two main clusters were observed, with healthy control subjects (in green) generally clustering away from patients (in blue) for CD56dim blood NK cells (Fig. 4A). The partitioning was driven by a skewing of individuals with very high expression levels of NKG2A compared with individuals with high frequencies of NKp46, NKG2D, DNAM-1, CD161, and perforin. Moreover, there was an enrichment of IR group patients within the NKG2Ahigh cluster, as well as 3 of 4 patients that had relapsed within the time frame of our study. No clustering with regard to cytogenetics was observed (data not shown). For this analysis, the HR patients were included, and it was clear that these 3 patients had a quite divergent profile with respect to NKG2A and activating receptor expression levels. In the BM, a similar segregation of patients was observed, but the number of healthy control BM samples was too low for meaningful comparison (data not shown).
![High expression levels of NKG2A discriminates NK cells in patients from healthy control subjects (healthy donors [HDs]). (A) Heatmaps showing unsupervised hierarchical clustering of phenotypic markers on CD56dim blood NK cells. Columns represents individual healthy control subjects or patients. Rows represent normalized levels of expression for an indicated phenotypic parameter. Risk categories are indicated for each individual patient. (B) Frequencies of NKG2A/CD57 subsets within healthy pediatric control subjects or BCP-ALL patients at diagnosis. Statistical significance was calculated using the nonparametrical Mann-Whitney test. NA= not applicable.](https://oup.silverchair-cdn.com/oup/backfile/Content_public/Journal/jleukbio/115/2/10.1093_jleuko_qiad112/1/m_qiad112f4.jpeg?Expires=1748285813&Signature=ttc~diufbOgAIoX7RSta26Zl8ldG4k5ey~-GCP6C5ASRgFd7cz38h67sP1YuX~n-7-sbMa2les6EOAuS2OCRdOPm9BoB1pJB5yYWoWDmWeSs5MYBybOnhQod7KCQ2u1Px5z~Dh-~6Nkw-FpzqHJW5rhTsx2w4v~zOzdeEBbjGVJd74cCoWQlR~sOp9OfKAua91SarUgd7Fk8T9EfOFhnFM4k-5ltbB8RULRrpJPLr085~6WLh7Y7usm4AjBVHhlQB8OhehEV3TMWhcaj90wM1di8GNEDXxsgiw4UzdpmGdlo8n225XT2ge8P97qWDpy~yXV6sx1Q4piOj-bNgLBBkw__&Key-Pair-Id=APKAIE5G5CRDK6RD3PGA)
High expression levels of NKG2A discriminates NK cells in patients from healthy control subjects (healthy donors [HDs]). (A) Heatmaps showing unsupervised hierarchical clustering of phenotypic markers on CD56dim blood NK cells. Columns represents individual healthy control subjects or patients. Rows represent normalized levels of expression for an indicated phenotypic parameter. Risk categories are indicated for each individual patient. (B) Frequencies of NKG2A/CD57 subsets within healthy pediatric control subjects or BCP-ALL patients at diagnosis. Statistical significance was calculated using the nonparametrical Mann-Whitney test. NA= not applicable.
To further assess NKG2A expression, we next assessed the maturation stage of NK cells in blood at the time of diagnosis. The least mature CD57−NKG2A+ CD56dim NK cells was the most dominant subset observed in both healthy children and patients (Fig. 4B). For patients, we observed a heterogeneity of maturational stages in BM and blood NK cells during treatment, but by end of treatment NK cells had a predominant naïve CD57−NKG2A+/− phenotype (data not shown).
3.5 Higher fractions of hypofunctional CXCR6+DNAM-1negNKG2A+ NK cells in leukemia patients
Finally, we tested whether the leukemia would affect tissue-resident NK cells of the BM. The BM contains a distinct population of resident NK cells that uniquely expresses CD69 and the chemokine receptor CXCR6, with both markers largely absent on circulating NK cells.20 We show here that CXCR6+ BM NK cells are found in similar frequencies in healthy control subjects and BCP-ALL patients (Fig. 5A and B). The CXCR6+ NK cells are hypofunctional compared with CD56dim NK cells, as measured as degranulation against K562 targets (Fig. 5C). A proportion of CXCR6+ NK cells lack DNAM-1 expression, and the lack of DNAM-1 is further accentuated in patients (Fig. 5D and E). The reduced frequency of DNAM-1 by CXCR6+ NK cells in the patients may contribute to further loss of cytotoxic capacity by this subset, although this was not significant with the small number of samples tested (Fig. 5F). Further, we show that the DNAM-1 negative fraction of CXCR6+ NK cells express proportionally more NKG2A in patients compared with healthy control subjects (Fig. 5G and H).
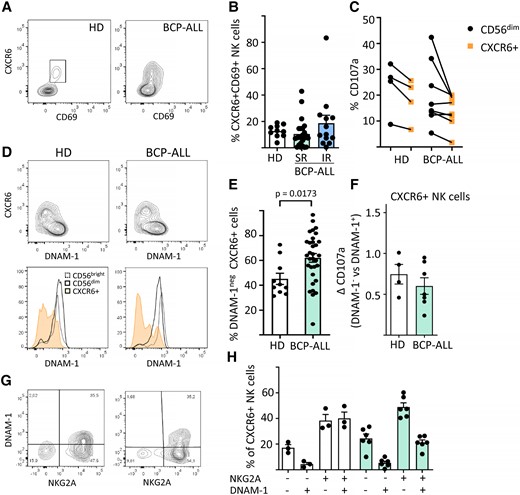
Higher frequencies of CXCR6+DNAM-1negNKG2A+ BM NK cells in BCP-ALL patients. (A) Representative flow cytometry plots showing of CXCR6 + CD69+ BM NK cells in healthy donors (HDs) or BCP-ALL patients. (B) Frequencies of CXCR6+CD69+ BM NK cells in HDs (n = 10) or BCP-ALL patients at diagnosis according to their risk status: SR (n = 25), IR (n = 13). Data are presented as percentage ± SEM. (C) Degranulation of CD56dim or CXCR6+ BM NK cells after co-incubation of BM mononuclear cells with K562 target cells for 4 h. (D) DNAM-1 expression by BM NK cell subsets in HDs or BCP-ALL patients. (E) Frequencies of DNAM-1neg CXCR6+ NK cells in HDs (n = 10) vs BCP-ALL patients (n = 38). (F) Degranulation of DNAM-1posCXCR6+ vs DNAM-1negCXCR6+ BM NK cells in HDs (n = 4) vs BCP-ALL patients (n = 7). (G, H) Frequencies of DNAM-1/NKG2A subsets in HDs (n = 3) vs BCP-ALL patients (n = 6). Data presented as percentage ± SEM, statistical significance was calculated using the nonparametrical Mann-Whitney test.
4. Discussion
In this study, we performed a comparative profiling of BM and blood NK cells from pediatric BCP-ALL patients compared with heathy pediatric control subjects. Our data demonstrate large variations in receptor expression between individuals, in both control subjects and patients. The variations were age independent (data not shown), in line with a previous study.34 By integrating hierarchical clustering of the phenotypic markers tested in our study, we show that patients and healthy control subjects segregate mainly due to disparately high expression of NKG2A vs lower expression of NKp46, DNAM-1, NKG2D, and CD161 in patients.
In line with previous reports,15,35 we observed generally suppressed features of NK cells at diagnosis with skewing toward less expression of activating NK cell receptors and low effector functions that remained throughout treatment. In particular, surface expression of the activating receptors DNAM-1 and NKG2D were reduced on the NK cells in patients. Reduced surface expression of receptors may occur via ligand-induced receptor downregulation. We did not systematically test ligand expression by the leukemic blasts, but BCP-ALL have previously been shown to express the DNAM-1 ligand CD112 and NKG2D ligands,9,36 which could explain the findings. In contrast to previous studies,8,15 we found no changes in NKp46 expression at diagnosis, but NKp46 expression levels were very variable between individuals.
In contrast to DNAM-1 and NKG2D, we observed a general upregulation of NKp30 expression levels at diagnosis. Low NKp30 levels were in a previous study correlated to increased relapse risk for adult AML.37 For BCP-ALL, a previous study found no changes in NKp30 expression by NK cells.15 High expression levels of NKp30 may seem counterintuitive, but recent research indicates that 3 isoforms exist for NKp30. While NKp30a/b induces NK cell activation, the NKp30 isoform mediates NK cell inhibitory effects through secretion of interleukin-10.38 We speculate that the patients potentially could overexpress the NKp30c isoform at diagnosis, but this remains to be tested.
The majority of patients had NK cells with high levels of NKG2A at diagnosis compared with healthy control subjects. This finding is in line with a previous study reporting increased expression levels of NKG2A by NK cells in pediatric ALL patients at diagnosis.15 Increased levels of NKG2A may inhibit NK cells through interactions with HLA-E. Several cancers overexpress HLA-E, including hematological cancers.39,40 HLA-E is expressed at low levels in pediatric ALL blasts, and it has been suggested that the downmodulation is the result of active immunosurveillance by NKG2A+ NK cells.41 Blocking NKG2A with the humanized anti-NKG2A antibody monalizumab has shown promise as a means to prevent NKG2A inhibitory signaling, has been shown to improve NK cell–mediated killing of HLA-E+ chronic lymphocytic leukemia in vitro, and has improved response rates of colorectal cancer and head and neck cancer.40,42,43 Other approaches to target NKG2A include blockers designed to prevent surface expression of NKG2A, which yields NK cells with heightened activity.44 With regard to BCP-ALL, NKG2A blockade may still unleash NK cell cytotoxicity despite the low HLA-E levels, as there may still be a functional interaction.
We observed low NK cell functional activity in the IR group at diagnosis. It has been suggested that low HLA-E expression levels could lead to failure of NK cell education, driving NK cells into a hyporesponsive state,41 which potentially could explain the observed low functionality of NK cells. Alternatively, it was previously proposed that the low NK cell activity present at diagnosis results from the suppressive activity of transforming growth factor β released from the blasts.15 In this respect, we observed a weak correlation of lower NK cell activity with higher blast counts (data not shown). The latter could represent an explanation for the normal functional activity in the SR group at diagnosis, and the fact that we did not observe major differences in NK cell receptor expression between the SR and IR groups.
Expression levels of the inhibitory receptor CD161 were decreased throughout treatment. While we found no alterations in CD161 in the patient group as a whole, we did find low levels of CD161 in NK cells that concomitantly expressed high levels of NKG2A. The functional role of CD161 on NK cells is still unclear, and it is even suggested to have an activating function in T cells.45 It is unclear whether human CD161 is implicated in targeting of leukemic blasts via its ligand LLT1, but the inhibitory NKR-P1B receptor and its ligand Clr-b have been implicated in tumor immune surveillance in mice.46
The chemotherapy regimens are likely a contributor to observed changes in receptor expression throughout treatment as well as to the reduced NK cell activity observed at day 79, when the presence of blasts is minimal. We observed drops in frequencies of NKG2D+, DNAM-1+, and NKp46+ NK cells from day 79 onward, which was not evident at diagnosis. Several clinical studies have documented decreased NK cell activity or changes in activating receptors in conjunction with different chemotherapies. Relevant for our study, corticosteroid treatment of pediatric patients was shown to reduce surface expression of NKG2D, NKp30, and NKp46 and lower the activity of NK cells.47,48 It is thus difficult to conclude whether the phenotypic changes observed at day 79 are due to intrinsic defects in the NK cells or to an effect of the chemotherapeutic regimen. By the end of treatment, we observed a higher abundance of NKG2A+CD57−KIR− immature NK cells (data not shown), indicating that newly developed NK cells may dominate the circulating pool of NK cells at this point.
We found changes in the proportions of mature vs naïve NK cells in patients compared with control subjects at diagnosis, with more naïve NKG2A+CD57− NK cells in patients, suggesting that the leukemia affects NK cell differentiation, directly or indirectly, and may impair development of cytolytically competent NK cells. Our data align with a recent study on a cohort of Mexican BCP-ALL patients in which similar findings were made.35 Cytomegalovirus infection leads to imprinting of the NK cell receptor repertoire,49 linked to the generation of adaptive CD56dimCD57+NKG2C+ NK cells, and there is evidence for a more efficient antileukemic effect with these cells.50 However, a patient with high fractions of putative adaptive NK cells (data not shown) at end of treatment in our cohort relapsed shortly after.
CXCR6+ tissue-resident NK cells are reportedly hypofunctional and express lower levels of granzyme B and perforin.20 We also found that CXCR6+ NK cells have lower capacity for degranulation compared with CD56dim NK cells. Moreover, we found that a large fraction of CXCR6+ NK cells in patients lack expression of the activating receptor DNAM-1. DNAM-1 is generally expressed by all circulating NK cells, while expressed in a bimodal fashion on BM CXCR6+ NK cells.20 The DNAM-1–negative fraction was larger in patients than in healthy control subjects, irrespective of risk groups, indicating that this phenotype is a general feature of NK cells from BCP-ALL patients. Moreover, the DNAM-1neg fraction in patients had lower degranulation capacity compared with the DNAM-1pos fraction. The lower expression of DNAM-1 by CXCR6+ NK cells in patients may be related to ligand-induced receptor downregulation. The DNAM-1 ligands CD155 and CD112 are variably expressed in hematological malignancies and are directly linked to receptor downregulation.3,12 However, this does not fully explain the existence of DNAM-1neg cells, as around 40% of CXCR6+ NK cells of healthy individuals also lack DNAM-1. Possibly, DNAM-1negCXCR6+ NK cells could represent a separate subset with distinct functions (i.e. expanded in patients irrespective of DNAM-1 ligands). The BM of ALL patients are also reported to harbor a suppressive CD56bright NK cell subset producing transforming growth factor β and interleukin-10 that could contribute to pathology.51 These cells expressed lower levels of activating receptors reminiscent to the CD56bright NK cells profiled in our study.
Conclusions
Our study highlights that multiparameter analyses of NK cells is necessary to reveal the full phenotypic dimensional space of NK cells in patients due to large interindividual variations in phenotypes. We identified a profile dominated by high expression levels of NKG2A that marked a patient group with a more suppressed phenotype and suggest that NKG2A could be targeted in therapies of pediatric acute leukemia.
Acknowledgments
The authors thank the children, donors, and parents involved in this study. This work was supported by the South-Eastern Regional Health Authority under grant 2013068, Fondsstiftelsen at Oslo University Hospital, and UNIFOR-FRIMED.
Author contributions
A.U., A.G.B., and M.I. conceptualized and designed the study; A.U. and M.I. wrote the manuscript; A.U. and M.I. conducted experiments; A.U., M.I., V.G., and A.G.B. analyzed and interpreted the data; all authors read, edited and approved the final manuscript.
References
Author notes
Conflict of interest statement. The authors declare no conflict of interest.
