


Abstract
Small birth size and increased postnatal growth have been associated with earlier timing of adrenarche and puberty, but it is not well known whether these factors alone or together lead to earlier maturation.
This work aimed to search for different growth trajectories using a clustering approach to analyze the effects of birth size and postnatal growth on adrenarchal and pubertal development.
Altogether 351 children (48% girls) were examined prospectively at ages 6 to 9 and 9 to 11 years. Birth and early-growth data were collected retrospectively. Main outcome measures included clinical signs of adrenarche and puberty, and serum androgen concentrations (dehydroepiandrosterone, dehydroepiandrosterone sulfate, androstenedione, testosterone).
We detected 4 clusters with different birth sizes and postnatal growth trajectories: 1) children with average birth size and increased postnatal growth (AI), 2) children with small birth size and increased postnatal growth (SI), 3) children with average birth size and postnatal growth (AA), and 4) children with small birth size and average postnatal growth (SA). Thelarche at age 9 to 11 was most common and serum androgens at ages 6 to 9 and 9 to 11 years were highest in girls belonging to the AI and SI groups. Similar patterns in the onset of puberty and in androgen levels were not seen in the SA group.
Increased early growth and weight gain predict higher serum androgen concentrations and earlier onset of puberty in girls. Adrenarche and puberty do not appear to be shifted earlier in children with small birth size who do not have catch-up growth.
Human growth comprises prenatal (intrauterine) and postnatal growth. Prenatal growth is regulated by many maternal, placental, and fetal factors during pregnancy, and newborns can be classified as being born small (SGA), appropriate (AGA), or large (LGA) for gestational age in terms of their birth weight and length [1]. After birth, postnatal growth consists of several phases, including early infancy (0-6 months), late infancy (6-24 months), early childhood (2-5 years), mid-childhood (6-10 years), and adolescence (10-18 years). In these phases, there are different hormonal milieus and growth rates [2]. Early infancy is characterized by high sex hormone activity (ie, minipuberty) and rapid linear growth, whereas in late infancy hormonal activity and growth rate begin to decline to the stable phase of early childhood with low sex hormone activity and consistent growth. During adrenarche in mid-childhood and central puberty in early adolescence, sex-hormone production and activity increase again. Finally, an increase in growth velocity can be observed during puberty.
Adrenarche and central puberty are two distinct developmental processes with different regulatory mechanisms [3, 4]. Adrenarche, occurring typically between ages 6 and 8 years, is characterized by the maturation of the inner adrenocortical zone (zona reticularis) and increasing production of adrenal androgens, mainly dehydroepiandrosterone (DHEA), dehydroepiandrosterone sulfate (DHEAS), androstenedione (A4), and 11β-hydroxyandrostenedione (11OHA4) [3]. In central puberty, activation of the hypothalamic-pituitary-gonadal axis initiates the gonads to secrete their sex steroids, mainly testosterone from testicles in boys and estradiol from ovaries in girls, leading to secondary sexual characteristics and the onset of reproductive function [4]. The onset of puberty typically occurs between the ages of 8 and 13 years in girls and 9 and 14 in boys. While adrenarche and puberty are separate processes, they are both important for the development and maturation of the body. The clinical signs of adrenarche comprise the development of adult-type body odor, oily skin, acne, and axillary and pubic hair, whereas the first clinical sign of central puberty is the development of breasts in girls and testicular growth in boys.
More than 30 years ago, a British epidemiologist, David Barker (1938-2013), hypothesized that prenatal environment modulates the risk of later diseases in adults [5, 6]. This hypothesis was originally based on findings from epidemiological studies that maternal undernutrition during pregnancy, resulting in low birth weight of a newborn, was associated with an increased risk of cardiovascular disease in adulthood [7]. Barker's hypothesis was later expanded to a broader concept of Developmental Origins of Health and Disease (DOHaD). In the DOHaD concept, origins of later diseases are formed at fertilization and embryonic, fetal, and neonatal stages by the interrelation between genes and environmental factors such as nutrition, stress, and chemicals [8]. As the endocrine system is also sensitive to these factors, the DOHaD concept is interesting not only in terms of later diseases but also regarding growth and sexual maturation.
To date, there is some evidence that the timing and tempo of sexual development differ in children with different birth sizes and early growth and weight gain trajectories. For example, earlier onset or rapid progression of adrenarche and puberty have been associated with being born SGA or preterm, accelerated childhood linear growth and weight gain, as well as with childhood obesity [9-16]. A very recent review article summarized that the combination of being born SGA and postnatal catch-up growth is associated with an increased risk of earlier timing of adrenarche and puberty, and later unfavorable metabolic consequences [17]. However, it is not well known whether children born AGA followed by accelerated growth have similar health risks or whether small birth size or accelerated postnatal growth or weight gain trajectory alone, or only in combination, are major factors determining the timing and tempo of sexual maturation and later health risks.
Using the data of children participating in the Finnish Physical Activity and Nutrition in Children (PANIC) study, we tested the DOHaD concept in this study. We hypothesized that the timing and tempo of adrenarche and puberty are associated with different trajectories of early-life linear growth and weight gain. We performed a machine learning–based clustering analysis to find 4 specific groups of children with different birth sizes and early-growth trajectories and compared clinical and biochemical markers of sexual maturation across these 4 groups.
Materials and Methods
Participants and Design
We investigated a cohort of children who participated in the Finnish PANIC study. The PANIC study is a nonrandomized controlled trial to investigate the effects of a combined physical activity and dietary intervention on cardiometabolic risk factors and other health outcomes in a general population of children from the city of Kuopio, Finland [18]. The study protocol has been approved by the research ethics committee of the Hospital District of Northern Savo (statement 69/2006), and the study has been carried out in accordance with the principles of the Declaration of Helsinki. The parents or caregivers of children provided their written consent, and the children gave their assent to participation. The PANIC study has been registered at www.clinicaltrials.gov (NCT01803776).
A total of 736 children who started the first grade in 16 primary schools in the city of Kuopio between 2007 and 2009 were invited to participate, and altogether 504 children accepted the invitation, participated in the baseline examination at age 6 to 9 years, and were included in the PANIC study between October 2007 and December 2009. The participants did not differ in sex, age, height SD score (SDS), or body mass index (BMI) SDS from all children who started the first grade in the city of Kuopio between 2007 and 2009.
From these 504 children, we included 368 children (176 girls, 192 boys) in this study because they had appropriate early growth records available. Of these children, 351 (168 girls, 183 boys) also participated in the 2-year follow-up visit at age 9 to 11 years.
Collection of Family History and Prenatal, Birth, and Early-Life Data
Family history and parental data were collected either using questionnaires or from the local registry of Kuopio University Hospital. Prenatal and birth data were collected retrospectively from the national medical birth registry and the local registry of Kuopio University Hospital. Preterm birth was defined as a child born at less than 37.0 weeks of gestational age. Birth weight SDS and birth length SDS were calculated using Finnish national references [19]. Being born SGA or LGA was defined as birth weight and/or birth length less than or equal to −2 SDS or greater than or equal to +2 SDS, respectively. Data on infant feeding were collected using questionnaires.
Anthropometric Measurements
Anthropometric measurements were performed in the morning after a 12-hour fast. Height was measured thrice using a calibrated wall-mounted stadiometer to an accuracy of 0.1 cm with the children standing in the Frankfurt plane, and the average of the 2 closest values was used in the analyses. Weight was measured twice using a weight scale integrated into the InBody 720 bioelectrical impedance device (BioSpace) to an accuracy of 0.1 kg with the children having emptied the bladder and wearing light underwear, and the mean of 2 values was used in the analyses. Waist circumference was measured 3 times at mid-distance between the bottom of the rib cage and the top of the iliac crest after expiration, and the mean of the closest 2 values was used in the analyses. BMI was calculated as body weight (kg) divided by body height (m) squared. Growth velocity (cm/year) was calculated using age and height values approximately at age 5 years and at the baseline examination (6-9 years), or at the baseline and 2-year follow-up (9-11 years) examinations. Age- and sex- standardized height SDS and BMI SDS were calculated using the Finnish national references [20]. Body fat percentage was measured using the Lunar dual-energy x-ray absorptiometry device (GE Medical Systems).
Assessment of Adrenarchal and Pubertal Status
A trained research physician (A.M.) assessed pubertal status according to the Tanner staging method [21, 22]. Breast development in girls was assessed by inspection and palpation and scored as Tanner B1-5. Genital development in boys was assessed by Tanner method and scored as Tanner G1-5 [21, 22]; testicular volumes were measured by an orchidometer [23]. The development of pubic hair was assessed by inspection and scored as Tanner P1-5. Pubertal onset was defined as Tanner B greater than or equal to 2 for girls, and as Tanner G greater than or equal to 2 and testicular volume greater than or equal to 4 mL for boys. Pubarche was defined as Tanner P greater than or equal to 2.
A trained research physician (A.M.) assessed also clinical signs of androgen effects such as adult-type body odor, greasiness of the hair and skin, comedones or acne, and development of axillary or pubic hair. Adult-type body odor and greasiness of the hair and skin were assessed also by asking the parents. Clinical adrenarche was defined as having one or more of these clinical signs.
Biochemical Analyses
All blood samples were collected in the morning after a 12-hour fast, and the serum samples were stored at −80 °C until used for biochemical analyses.
Serum DHEAS concentrations were measured using an enzyme-linked immunosorbent assay (ELISA) kit (catalog No. 1950, RRID:AB_2819763, Alpha Diagnostic International). The intra-assay and interassay coefficients of variation for this assay were 7.5% to 11.5% and 7.0% to 11.0%, respectively. The detection limit of the DHEAS immunoassay was 0.014 µmol/L. Biochemical adrenarche was defined as serum DHEAS concentration greater than or equal to 1 µmol/L (37 µg/dL).
Serum concentrations of other androgens than DHEAS (DHEA, A4, T) were measured using liquid chromatography—tandem mass spectrometry (LC-MS/MS), as described previously [24]. At the time of measuring serum androgen concentrations, our in-house LC-MS/MS method did not include androgens in the so-called 11-oxygenated androgen pathway [25]. Therefore, only androgens belonging to the classic pathway are used in the present study.
In girls, serum luteinizing hormone (LH) concentrations were measured using an electrochemiluminescence immunoassay (catalog No. 11732234, RRID:AB_2800498, Roche Diagnostics GmbH) with an interassay and intra-assay coefficient of variation of 1.6% to 1.9% and 1.4%, respectively. Biochemical evidence for pubertal onset was defined as serum LH concentration greater than or equal to 0.3 U/L [26].
Growth Data for Clustering Analyses
To cluster children in this cohort based on their birth size and postnatal growth, closest weight and length or height SDS values at birth and at ages 6 months, 2 years, and 5 years were collected. These time points were selected because most growth measurements were available closest to these ages, and because the interval between these time points includes important stages in early childhood growth with different hormonal milieus and tempos: 1) early infancy (ie, minipuberty; from birth until age 6 months), 2) late infancy (from age 6 months to 2 years), and 3) early childhood (from age 2 to 5 years). These growth values (both weight and length or height SDS) were normalized to follow a parametric distribution with a range of −1 to +1 using the following formula: [(“value” − “mean of all values”)/“SD of all values”]. The normalized values were used in clustering analyses using the Python language, the Scikit-Learn module, and an unsupervised K-means algorithm (see an example of Python script in Supplementary Fig. S1A and 1B [27]).
Statistical Analyses
The unsupervised K-means clustering analyses were performed, and figures were constructed using the Python language in the Jupyter notebooks together with appropriate modules (mainly Pandas, Numpy, Matplotlib, Seaborn, and Scikit-Learn).
The unsupervised K-means clustering algorithm classifies individuals into predefined number of groups so that individuals within the same group are as similar as possible, while those in different groups are as different as possible [28]. This similarity is estimated using the Euclidean distance [29], so that if 2 individuals have very different values for a variable, the distance will be high, and vice versa. Each group is represented by its centroid, which corresponds to the mean of all individuals in that group, and the initial centroids are selected by the algorithm. In the K-means algorithm, both grouping variables (values that are presented to the model) and the number of clusters need to be defined, from which the latter can be analyzed using Silhouette scores and/or Inertia values.
All statistical analyses were performed using the IBM SPSS statistics software, version 25.0 (IBM Corp). A P value less than .05 was used to indicate statistical significance. The one-way analysis of variance was used to analyze differences in continuous variables between the clusters. For categorical variables, we used the Pearson chi-square test. Associations between early growth and adrenarche or puberty were also analyzed using logistic regression models that were tested to meet assumptions of normality, linearity, homoscedasticity, and absence of multicollinearity.
Results
Clustering Analyses for Early-Growth Trajectories
The unsupervised K-means clustering algorithm was used in Python to investigate if different patterns of birth size and postnatal growth trajectories could be found within this data set (example script in Supplementary Fig. S1A and 1B [27]). No single and optimal number of clusters were detected with Silhouette scores and Inertia values in our dataset (Supplementary Fig. S2 [27]), most likely due to overlapping of underlying growth data. Therefore, we visually analyzed linear growth and weight gain curves from birth to age 5 years in range of 2 to 5 predicted clusters (Supplementary Figs. 3 and 4 [27]). Grouping children into 4 clusters was detected to be the best classification method regarding the research questions of this study (Fig. 1). These 4 clusters included groups of children with average or relatively small birth sizes together with average or increased postnatal growth rates: Cluster 1 included children with average birth size and increased postnatal growth (group “AI”), cluster 2 children with small birth size and (increased) postnatal catch-up growth (group “SI”), cluster 3 children with average birth size and average postnatal growth (group “AA”), and cluster 4 children with small birth size and without postnatal catch-up growth (group “SA”).
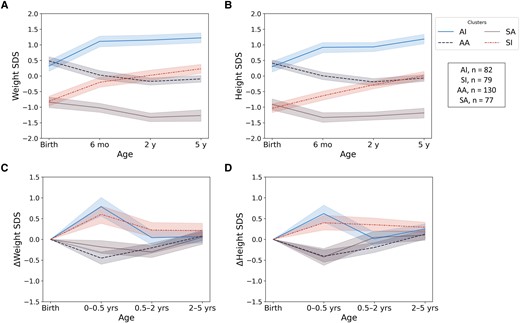
Mean weight and length or height SD scores from birth to age 5 years among children in 4 clusters from unsupervised K-means clustering analyses: children with average birth size and increased postnatal growth (AI), children with small birth size and postnatal catch-up growth (SI), children with average birth size and postnatal growth (AA), and children with small birth size with average postnatal growth (SA). Weight SD scores are shown in panel A, length or height SD scores in panel B, and change (Δ) in weight and length/height SD scores in panels C and D, respectively.
Characteristics
The characteristics of all children and the children in the 4 clusters are presented in Table 1. Maternal age at birth, maternal smoking during pregnancy, and being born SGA were different between the clusters. Maternal age at birth was highest in the SI group and lowest in the SA group. Maternal smoking during pregnancy and being born SGA were most common in children with the smallest birth sizes (in SI and SA groups). There were no other statistically significant differences in background characteristics between the 4 clusters.
Characteristics of all children and groups clustered by birth size and postnatal growth (0-5 years)
| Groups based on early growth clustering analyses (K-means) | ||||||
|---|---|---|---|---|---|---|
| All | AI: Average BS and increased PG | SI: Small BS and increased PG | AA: Average BS and average PG | SA: Small BS and average PG | Pa | |
| Age at baseline examination, y | 7.6 (0.4) | 7.6 (0.4) | 7.7 (0.4) | 7.6 (0.4) | 7.6 (0.4) | .580 |
| n at baseline | 368 | 82 | 79 | 130 | 77 | |
| Age at 2-y follow-up examination, y | 9.8 (0.4) | 9.7 (0.4) | 9.8 (0.5) | 9.8 (0.4) | 9.7 (0.4) | .405 |
| n at 2-y follow-up examination | 351 | 79 | 76 | 125 | 71 | |
| Lifestyle intervention groupb, yes % | 61 | 67 | 56 | 65 | 56 | .288 |
| Girl, yes % | 48 | 46 | 48 | 49 | 48 | .992 |
| Healthy at baseline examination, yes % | 87 | 87 | 89 | 85 | 87 | .919 |
| Continuous medication at baseline examination, yes % | 13 | 11 | 12 | 15 | 13 | .880 |
| Family history and parental data | ||||||
| Household income, % in class, €/y | .077 | |||||
| <30 000 | 19 | 24 | 22 | 14 | 18 | |
| 30 000-60 000 | 43 | 30 | 37 | 51 | 43 | |
| >60 000 | 38 | 46 | 41 | 35 | 38 | |
| Parents in marriage, yes % | 58 | 59 | 53 | 58 | 59 | .868 |
| Parental education (after primary school), % in class | .620 | |||||
| Vocational school or less | 18 | 13 | 23 | 18 | 17 | |
| Polytechnic | 45 | 45 | 41 | 50 | 43 | |
| University | 37 | 42 | 37 | 33 | 40 | |
| Maternal age at birth, y | 29.7 (5.1) | 29.0 (5.2) | 31.1 (4.7) | 29.9 (5.3) | 28.6 (4.9) | .011 |
| Maternal chronic illness, yes % | 10 | 8 | 11 | 10 | 12 | .915 |
| Maternal BMI at beginning of pregnancy | 23.5 (4.6) | 24.1 (5.1) | 23.0 (3.6) | 23.9 (5.1) | 22.6 (4.1) | .354 |
| Maternal relative (as %) weight gain during pregnancy | 20.2 (7.8) | 20.4 (7.9) | 19.0 (8.4) | 19.4 (8.2) | 22.4 (6.3) | .131 |
| Maternal smoking before pregnancy, yes % | 17 | 19 | 17 | 11 | 23 | .244 |
| Maternal smoking during pregnancy, yes % | 7 | 7 | 14 | 2 | 9 | .041 |
| Maternal alcohol consumption before pregnancy, yes % | 45 | 41 | 50 | 38 | 57 | .067 |
| Maternal alcohol consumption during pregnancy, yes % | 5 | 6 | 6 | 3 | 3 | .658 |
| Paternal smoking before pregnancy, yes % | 23 | 22 | 25 | 24 | 22 | .862 |
| Paternal smoking during pregnancy, yes % | 21 | 22 | 19 | 20 | 22 | .846 |
| Paternal alcohol consumption before pregnancy, yes % | 45 | 40 | 53 | 39 | 53 | .281 |
| Paternal alcohol consumption during pregnancy, yes % | 43 | 35 | 51 | 39 | 49 | .342 |
| Birth and early postnatal data | ||||||
| Mother’s first child, yes % | 42 | 52 | 43 | 39 | 34 | .089 |
| Multiparous pregnancy, yes % | 1 | 1 | 0 | 2 | 1 | .759 |
| Preeclampsia during pregnancy, yes % | 4 | 4 | 4 | 2 | 5 | .755 |
| Gestational diabetes, yes % | 8 | 9 | 5 | 12 | 4 | .166 |
| Cesarean delivery, yes % | 19 | 19 | 20 | 18 | 18 | .991 |
| Gestational age, wk | 39.9 (1.5) | 40.1 (1.4) | 39.6 (1.7) | 40.0 (1.4) | 39.6 (1.5) | .063 |
| Born small for gestational age, yes %c | 6 | 0 | 13 | 0 | 17 | <.001 |
| Born large for gestational age, yes %d | 3 | 5 | 0 | 5 | 0 | .056 |
| Born preterm, yes %e | 4 | 2 | 6 | 2 | 7 | .244 |
| Born post term, yes %f | 1 | 2 | 0 | 1 | 2 | .779 |
| Apgar points, 1 min | 8.7 (1.0) | 8.8 (0.5) | 8.7 (0.8) | 8.6 (1.2) | 8.7 (1.1) | .653 |
| Apgar points, 5 min | 9.0 (0.7) | 9.0 (0.4) | 8.9 (0.7) | 9.0 (0.4) | 8.9 (0.7) | .577 |
| A child was solely breastfed until, mo | 2.9 (1.7) | 2.6 (1.7) | 2.9 (1.6) | 3.2 (1.7) | 2.7 (1.9) | .176 |
| Age of starting solid foods, mo | 3.9 (0.9) | 3.7 (0.8) | 3.8 (0.8) | 4.1 (1.0) | 3.9 (0.9) | .297 |
Continuous variables are expressed as means (SDs) and categorical variables as proportions in percentages. P values of less than .05 indicating statistically significant differences between groups are shown in bold.
Abbreviations: AA, children with average birth size and postnatal growth; AI, children with average birth size and increased postnatal growth; BMI, body mass index; BS, birth size; PG, postnatal growth; SA, children with small birth size and average postnatal growth; SI, children with small birth size and increased postnatal growth.
aP values for overall differences between groups from analysis of variance for continuous variables and from the Pearson chi-square test for categorical variables.
bThe PANIC study included combined physical activity and dietary interventions, and participants were allocated to intervention and control groups.
cBirth length or weight less than or equal to −2 SD.
dBirth length or weight greater than or equal to +2 SD.
eGestational age less than 37.0 weeks.
fGestational age greater than 42.0 weeks.
Early linear growth and weight gain as well as body size and composition at ages 6 to 9 years and 9 to 11 years in all children are shown in Table 2 and Fig. 1 (see also Supplementary Table S1 for data separately in girls and boys [27]). As the children were clustered based on their early-growth trajectories, there were statistically significant differences in all these anthropometric measures at ages 6 to 9 years and 9 to 11 years. A major difference between girls and boys was that fat percentage from ages 6 to 9 to ages 9 to 11 increased in girls but decreased in boys (mean fat percentage at ages 6-9 and ages 9-11 was 22.6% and 30.3% in girls and 22.2% and 17.3% in boys, respectively; Supplementary Table S1 [27]).
Anthropometric data in all children and in the groups clustered by birth size and postnatal growth (0-5 years)
| Groups based on K-means clustering analyses | ||||||
|---|---|---|---|---|---|---|
| All | AI: Average BS and increased PG | SI: Small BS and increased PG | AA: Average BS and average PG | SA: Small BS and average PG | Pa | |
| Anthropometrics (0-5 y) | ||||||
| Birth weight SDS | −0.11 (0.96) | 0.32 (0.81) | −0.81 (0.68) | 0.48 (0.69) | −0.84 (0.78) | <.001 |
| Weight SDS at age 0.5 y | −0.04 (1.03) | 1.05 (0.81) | −0.23 (0.76) | −0.02 (0.77) | −0.99 (0.63) | <.001 |
| Weight SDS at age 2 y | −0.08 (1.08) | 1.15 (0.78) | 0.03 (0.77) | −0.17 (0.64) | −1.38 (0.60) | <.001 |
| Weight SDS at age 5 y | 0.01 (1.10) | 1.23 (0.79) | 0.21 (0.67) | −0.09 (0.65) | −1.27 (0.80) | <.001 |
| ΔWeight SDS from birth to age 5 y | 0.11 (1.22) | 0.90 (1.09) | 0.99 (0.97) | −0.57 (0.89) | −0.43 (1.01) | <.001 |
| Birth length SDS | −0.20 (0.96) | 0.30 (0.79) | −1.04 (0.61) | 0.41 (0.60) | −0.91 (0.82) | <.001 |
| Length SDS at age 0.5 y | −0.27 (1.01) | 0.89 (0.77) | −0.70 (0.73) | −0.05 (0.73) | −1.36 (0.72) | <.001 |
| Height SDS at age 2 y | −0.18 (0.96) | 0.94 (0.68) | −0.33 (0.59) | −0.19 (0.69) | −1.25 (0.54) | <.001 |
| Height SDS at age 5 y | −0.01 (1.01) | 1.18 (0.67) | 0.01 (0.60) | −0.07 (0.60) | −1.19 (0.69) | <.001 |
| ΔLength or height SDS from birth to age 5 y | 0.18 (1.14) | 0.89 (0.95) | 1.01 (0.90) | −0.48 (0.87) | −0.28 (0.97) | <.001 |
| At baseline examination (6-9 y) | ||||||
| Weight SDS | −0.03 (1.03) | 0.90 (0.79) | 0.22 (0.81) | −0.13 (0.75) | −1.11 (0.83) | <.001 |
| Height SDS | 0.17 (0.99) | 1.24 (0.78) | 0.22 (0.67) | 0.11 (0.63) | −0.94 (0.67) | <.001 |
| BMI SDS | −0.17 (1.11) | 0.47 (1.00) | 0.08 (1.16) | −0.32 (0.96) | −0.88 (0.95) | <.001 |
| Waist-to-height percentage | 44.0 (3.9) | 45.3 (4.5) | 44.7 (4.3) | 43.4 (3.2) | 43.1 (3.0) | <.001 |
| Fat percentageb | 19.8 (8.5) | 23.8 (9.2) | 22.0 (9.1) | 18.4 (7.1) | 15.6 (6.3) | <.001 |
| Growth velocity, cm/yc | 6.72 (0.8) | 6.89 (0.69) | 6.79 (0.59) | 6.73 (0.62) | 6.47 (1.31) | .014 |
| At follow-up examination (9-11 y) | ||||||
| Weight SDS | −0.05 (1.01) | 0.77 (0.80) | 0.21 (0.84) | −0.17 (0.79) | −1.01 (0.87) | <.001 |
| Height SDS | 0.12 (0.97) | 1.13 (0.83) | 0.19 (0.66) | 0.03 (0.67) | −0.93 (0.65) | <.001 |
| BMI SDS | −0.15 (1.06) | 0.40 (0.95) | 0.10 (1.08) | −0.28 (0.93) | −0.79 (1.00) | <.001 |
| Waist-to-height percentage | 43.5 (4.4) | 44.7 (0.05) | 44.5 (0.05) | 42.8 (3.3) | 42.4 (0.04) | <.001 |
| Fat percentageb | 24.3 (9.8) | 28.2 (9.7) | 26.9 (10.5) | 22.9 (9.0) | 19.5 (8.1) | <.001 |
| Growth velocity, cm/yd | 5.46 (0.65) | 5.69 (0.69) | 5.56 (0.63) | 5.39 (0.66) | 5.20 (0.51) | <.001 |
Values are expressed as means (SD). P values of less than .05 indicating statistically significant differences between groups are shown in bold.
Abbreviations: Δ, change between 2 time points; AA, children with average birth size and postnatal growth; AI, children with average birth size and increased postnatal growth; BMI, body mass index; BS, birth size; PG, postnatal growth; SA, children with small birth size and average postnatal growth; SDS, SD score; SI, children with small birth size and increased postnatal growth.
aP value for overall differences between groups from analysis of variance for continuous variables.
bExcluding head and measured by dual x-ray absorptiometry.
cCalculated using age and height values at age 5 years and at baseline examination (years).
dCalculated using age and height values at baseline (6-9 years) and at follow-up examination (9-11 years).
Associations Between Early-Growth Trajectories and Adrenarchal Development
Associations between early-growth trajectories and markers of adrenarche are presented in Table 3 and Figs. 2 and 3 (see also Supplementary Tables S2 and 3 for all data on clinical and biochemical measures [27]).
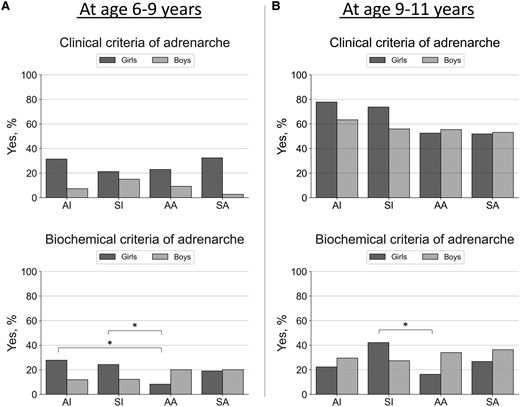
Proportions (as %, y-axis) of having adrenarche in girls and boys by clinical (any clinical sign of androgen action including adult-type body odor, oily skin, comedones or acne, axillary or pubic hair) or biochemical (serum DHEAS concentration ≥1 µmol/L) criteria at baseline (panel A, 6-9 years) and at follow-up (panel B, 9-11 years). Only prepubertal children were included in these analyses (n = 355 at age 6-9 years; n = 289 at age 9-11 years). Groups (x-axis) were predicted using unsupervised K-means clustering algorithm with birth weight and length SD scores and postnatal weight and length or height SD scores (at age 0.5, 2, and 5 years) included the following: Cluster AI represents children with average birth size and increased postnatal growth (n = 78 at age 6-9 years; n = 55 at age 9-11 years), cluster SI children with small birth size and postnatal catch-up growth (n = 74 at age 6-9 years; n = 58 at age 9-11 years), cluster AA children with average birth size and postnatal growth (n = 126 at age 6-9 years; n = 107 at age 9-11 years), and cluster SA children with small birth size with average postnatal growth (n = 77 at age 6-9 years; n = 69 at age 9-11 years). Differences between groups were analyzed using the chi-square test and significant differences at the level of P less than .05 are indicated with an asterisk.
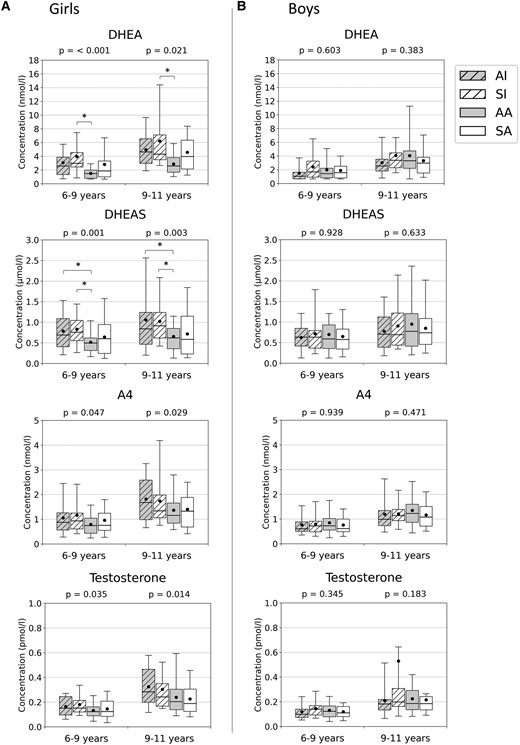
Serum dehydroepiandrosterone (DHEA; nmol/L), dehydroepiandrosterone sulfate (DHEAS; µmol/L), androstenedione (A4; nmol/L), and testosterone (nmol/L) concentrations at ages 6 to 9 and 9 to 11 years in A, girls, and in B, boys. Groups (x-axis) were predicted using unsupervised K-means clustering algorithm with birth weight and length SD scores and postnatal weight and length/height SD scores (at age 0.5, 2, and 5 years) included the following: Cluster AI represents children with average birth size and increased postnatal growth (n = 82), cluster SI children with small birth size and postnatal catch-up growth (n = 79), cluster AA children with average birth size and postnatal growth (n = 130), and cluster SA children with small birth size with average postnatal growth (n = 77). Medians (horizontal line), means (black dot), interquartile range (box), and 5th to 95th percentile range (whiskers) are provided in box plots. Differences between all clusters were analyzed using the one-way analysis of variance, and P values are presented above each plot. *Significant difference between the 2 groups at the level of P less than .05 (Bonferroni method).
Logistic regression models with body weight measures (0-5 years) as predictors of having clinical or biochemical signs of adrenarche or puberty in mid-childhood or in early adolescence
| Girls (n = 176) | Boys (n = 192) | |||||
|---|---|---|---|---|---|---|
| OR | 95% CI | P | OR | 95% CI | P | |
| Any clinical sign of androgen action at age 6-9 ya | ||||||
| Birth weight SDS | 1.16 | 0.68-2.00 | .585 | 1.24 | 0.51-3.01 | .632 |
| ΔWeight SDS (0-0.5 y) | 1.18 | 0.66-2.12 | .586 | 1.44 | 0.61-3.36 | .405 |
| ΔWeight SDS (0.5-2 y) | 1.28 | 0.73-2.24 | .389 | 2.18 | 0.72-6.64 | .169 |
| ΔWeight SDS (2-5 y) | 1.81 | 0.92-3.56 | .086 | 2.05 | 0.65-6.42 | .221 |
| Serum DHEAS ≥ 1 µmol/L at age 6-9 ya | ||||||
| Birth weight SDS | 1.05 | 0.56-1.96 | .879 | 0.95 | 0.53-1.71 | .872 |
| ΔWeight SDS (0-0.5 y) | 2.43 | 1.27-4.80 | .011 | 0.88 | 0.48-1.60 | .663 |
| ΔWeight SDS (0.5-2 y) | 2.83 | 1.46-5.51 | .002 | 1.60 | 0.77-3.34 | .211 |
| ΔWeight SDS (2-5 y) | 2.67 | 1.26-5.65 | .010 | 1.36 | 0.64-2.91 | .863 |
| Pubarche (Tanner P ≥ 2) at age 9-11 yb | ||||||
| Birth weight SDS | 1.88 | 0.91-3.88 | .090 | 3.12 | 0.73-13.3 | .123 |
| ΔWeight SDS (0-0.5 y) | 2.20 | 1.06-4.60 | .035 | 0.47 | 0.10-2.27 | .466 |
| ΔWeight SDS (0.5-2 y) | 3.15 | 1.50-6.62 | .003 | 0.75 | 0.10-6.10 | .785 |
| ΔWeight SDS (2-5 y) | 3.21 | 1.42-7.26 | .005 | 0.04 | 0.00-0.70 | .028 |
| Pubertal onset at age 9-11 yb | ||||||
| Birth weight SDS | 1.60 | 0.90-2.86 | .108 | 1.76 | 0.88-3.55 | .113 |
| ΔWeight SDS (0-0.5 y) | 2.10 | 1.13-2.89 | .019 | 2.04 | 1.02-4.10 | .045 |
| ΔWeight SDS (0.5-2 y) | 2.57 | 1.32-5.00 | .006 | 2.32 | 0.95-5.71 | .066 |
| ΔWeight SDS (2-5 y) | 2.47 | 1.17-5.24 | .018 | 1.29 | 0.51-3.27 | .594 |
| Serum LH ≥ 0.3 U/L at age 9-11 yb | ||||||
| Birth weight SDS | 1.80 | 0.92-3.54 | .089 | 1.15 | 0.56-2.36 | .695 |
| ΔWeight SDS (0-0.5 y) | 2.86 | 1.40-5.82 | .004 | 0.85 | 0.42-1.70 | .642 |
| ΔWeight SDS (0.5-2 y) | 2.04 | 1.01-4.09 | .046 | 0.97 | 0.40-2.36 | .954 |
| ΔWeight SDS (2-5 y) | 1.66 | 0.79-3.51 | .185 | 1.09 | 0.45-2.66 | .845 |
P values at the level of less than .05, indicating statistical significance, are shown in bold. Pubertal onset was defined as Tanner B greater than or equal to 2 for girls and Tanner G greater than or equal to 2 together with testicular volume greater than or equal to 4 mL in boys.
Abbreviations: Δ, change between 2 time points; LH, luteinizing hormone; OR, odds ratio; SDS, SD score.
aAdjusted with fat percentage (excluding head and measured by dual x-ray absorptiometry) at age 6 to 9 years.
bAdjusted with fat percentage (excluding head and measured by dual x-ray absorptiometry) at age 9 to 11 years.
There were no statistically significant differences in clinical signs of adrenarche between the clusters at ages 6 to 9 or 9 to 11 years, although they tended to be more often present in children with increased postnatal growth (AI and SI groups) at ages 9 to 11 (see Fig. 2). Larger increases in weight SDS between ages 0 to 0.5, 0.5 to 2, and 2 to 5 years were statistically significant predictors of having pubarche at age 9 to 11 years in girls but not in boys (see Table 3; see also Supplementary Table S4 for similar regression models with length or height values as predictors [27]).
There was a statistically significant difference in biochemical adrenarche (serum DHEAS ≥ 1 µmol/L) between the clusters AI/SI and AA at ages 6 to 9 and 9 to 11 in girls but not in boys (see Fig. 2). Serum DHEA and DHEAS concentrations were highest in girls with increased postnatal growth (AI and SI groups) at ages 6 to 9 and 9 to 11 years (see Fig. 3). Larger increases in weight SDS between ages 0 to 0.5, 0.5 to 2, and 2 to 5 years were statistically significant predictors of having serum DHEAS concentration greater than or equal to 1 µmol/L at age 6 to 9 years in girls but not in boys (see Table 3; see also Supplementary Table S4 for similar regression models with length or height values as predictors [27]).
Associations Between Early-Growth Trajectories and Pubertal Development
There was a statistically significant difference in having pubertal onset at age 9 to 11 years between the clusters in girls but not in boys. Again, pubertal onset at this age was most common in groups with increased postnatal growth (groups AI and SI; see Fig. 4; see also Supplementary Table S2 for all data on clinical measures [27]). Larger increases in weight SDS between ages 0 to 0.5, 0.5 to 2, and 2 to 5 years in girls and between ages 0 to 0.5 in boys were statistically significant predictors of having pubertal onset at age 9 to 11 years (see Table 3; see also Supplementary Table S4 for similar regression models with length or height SDS values as predictors [27]). Larger increases in weight SDS between ages 0 to 0.5 and 0.5 to 2 years were also statistically significant predictors of having serum LH concentrations greater than or equal to 0.3 U/L at age 9 to 11 years in girls but not in boys (see Table 3).
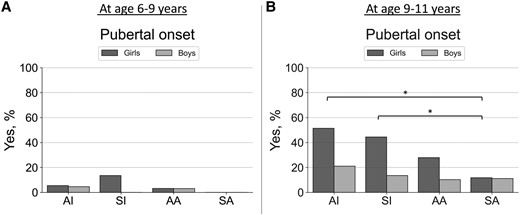
Proportions (as %, y-axis) of having pubertal onset (Tanner B ≥ 2 in girls; Tanner G ≥ 2 and testicular volume ≥4 mL in boys) at A, ages 6 to 9, and B, 9 to 11 years. Groups (x-axis) were predicted using unsupervised K-means clustering algorithm with birth weight and length SD scores and postnatal weight and length/height SD scores (at age 0.5, 2, and 5 years) included the following: cluster AI represents children with average birth size and increased postnatal growth (n = 82), cluster SI children with small birth size and postnatal catch-up growth (n = 79), cluster AA children with average birth size and postnatal growth (n = 130), and cluster SA children with small birth size with average postnatal growth (n = 77). Differences between groups were analyzed using the chi-square test and significant differences at the level of P less than .05 are indicated with an asterisk.
Discussion
In this study, we investigated a cohort of 368 children participating in the Finnish PANIC study and used their retrospectively collected birth size and growth data between birth and age 5 years in an unsupervised machine learning–based clustering analysis to find specific early-growth trajectories. We detected 4 clusters with different birth sizes (average and relatively small) and postnatal growth rates (average and increased). Girls with increased postnatal growth had the highest serum DHEA and DHEAS levels at age 6 to 11 years and were more likely to show signs of adrenarche and puberty by age 11 years compared to girls with average postnatal growth. There were no similar differences in boys, but this could be because the follow-up age was too early for boys. This suggests that increased postnatal growth in girls born AGA or SGA is an important predictor of earlier timing of sexual development, and being born SGA without catch-up growth does not have a similar effect.
Being born preterm or SGA, accelerated early linear growth and weight gain, as well as childhood overweight or obesity [9-13, 30-33] have been associated with premature adrenarche and higher serum DHEAS concentration in mid-childhood. In a Finnish cohort of girls born mostly AGA, linear growth and weight gain were increased in early life in those who tended to be overweight or obese and had premature adrenarche in mid-childhood [10, 11]. Interestingly, in another Finnish cohort, serum DHEAS concentrations at age 6 years were positively associated not only with early growth from birth to age 1 year but also with serum DHEAS concentrations that were measured already at age 1 year [33]. In the study by Neville and Walker [9], premature pubarche was associated with being born SGA or preterm in children who also had increased postnatal weight gain. Similar associations between higher serum DHEAS concentration and being born preterm or SGA or being born SGA together with higher weight gain from birth to age 2 years have been seen in other studies [31, 32]. Ong et al [12] reported higher adrenal androgen concentrations in small infants who gained weight rapidly in early postnatal life. These findings are in line with the results of our study, resembling mostly our 2 groups of children with small or average birth size together with increased postnatal growth (AI and SI groups). A Dutch group found similar serum DHEAS concentrations in mid-childhood among AGA children and SGA-born children without catch-up growth, corresponding to the SA and AA groups in our study [34]. This is also consistent with the findings in our study, and suggests that being born SGA without postnatal catch-up growth does not lead to similar effects on later adrenal androgen secretion as seen in children with increased postnatal linear growth and weight gain.
Like with adrenarche, the timing of central puberty has also been associated with smaller birth size, increased early childhood linear growth and weight gain, and childhood obesity [14-17, 35, 36]. Being born SGA has been associated with earlier timing or rapid progression of puberty in girls, but evidence is more contradictory in boys [14]. In a UK cohort, a combination of being born relatively small and having rapid postnatal growth from birth to age 2 years was linked to earlier timing of puberty [16]. Rapid postnatal weight gain might lead to childhood obesity, also a factor that has been associated with earlier timing of puberty in girls and boys [15, 17, 35, 36]. In one of these studies, a large cohort of almost 7500 US children (with both small and average birth size included) was studied and faster gains in weight, length, height, and BMI in early life were all associated with earlier pubertal development [36]. These findings are in line with the results of our study in that the timing of puberty tends to be earlier in girls with increased postnatal growth and weight gain, regardless of birth size.
We observed associations of early increased postnatal growth with the development of earlier adrenarche and puberty in girls but not in boys. A major difference between girls and boys in our cohort was that fat percentage increased from ages 6 to 9 to ages 9 to 11 years in girls but decreased in boys. This corresponds with the well-known physiologic sexual dimorphism caused by the sex hormones, estrogens and androgens, affecting body composition (eg, fat, muscle, and bone mass) differently. Accordingly, a sexual dimorphic effect between fat and sex steroid metabolism was also suggested when sex-specific characteristics of adrenarche between boys and girls were investigated in a previous study [37]. Of note, boys have their pubertal onset later than girls, and it is possible that similar associations as seen in girls could have been detected if boys were investigated at an older age.
Specific factors and mechanisms that cause catch-up growth and earlier timing of sexual maturation remain unclear. Interestingly, the biggest increase in growth rate was observed in children of our study during the first 6 months of life. This is the time frame when minipuberty occurs, and it has been reported that postnatal gonadal activation and circulating T concentrations during minipuberty are positively associated with growth velocity in early infancy among girls and boys [38]. Thus, minipuberty and later growth and sexual development seem to be linked. Some data indicate that the underlying common mechanisms involve insulin resistance and insulin-like growth factors (IGFs) [3, 10, 11, 16, 39]. The UK Avon Longitudinal Study of Parents and Children study showed that rapid infancy weight gain increased the risk of premature adrenarche and obesity at ages 5 to 8 years, with evidence of insulin resistance and low circulating sex hormone-binding globulin levels. The authors speculated that IGF-1 and low sex hormone-binding globulin may increase circulating free androgen levels and thereby stimulate the gonadotropin-releasing hormone pulse generator [16]. Consistent with this speculation, children with premature adrenarche tend to be overweight or obese, have higher circulating IGF-1 and insulin concentrations, and often have advanced pubertal development [3, 10, 11, 39]. Other factors that might modulate early growth and later development include nutrition, stress, and endocrine-disrupting chemicals. We and others have shown that some dietary factors, such as protein intake, can modulate circulating androgens and the growth hormone–IGF-axis in childhood [40-42].
Although we saw a difference in maternal smoking during pregnancy between our groups, being highest in children with small birth size and especially in the SI group, we cannot conclude much about the underlying factors behind different growth trajectories. One interesting and a more novel approach to study the relationship between birth size and early growth is through the analysis of small noncoding RNAs. In 2 studies, microRNAs were analyzed from umbilical cord in infants born SGA to identify specific profiles and biomarkers associated with catch-up growth [43], or from blood to compare expression profiles between AGA and SGA children with and without obesity [44]. However, more studies are needed to have a better understanding of factors that are regulating the trajectories of growth and development from prenatal life to adolescence.
The strengths of our study include the relatively large general population of initially prepubertal and mostly normal-weight children examined, the modern machine learning–based method used in clustering analyses, the sensitive LC-MS/MS method used to measure serum concentrations of androgens, and the comprehensive assessments of clinical androgenic and pubertal signs. Serum DHEAS was not measured by the LC-MS/MS method, but it was well measurable by an immunoassay already in mid-childhood. Body size and composition in our cohort were comparable to those of the national reference population [20], making it possible to generalize the results to other children of the same age in Finland.
A limitation of the study is that we used retrospective data in our growth clustering analyses. Results should be interpreted with caution and as associations, and we cannot conclude any causal effects from early postnatal life to adolescence. Due to the nature of the cohort and applied clustering method in 4 groups across the whole range of included individuals, this study compares children in the lower range of normal variation in birth size and their postnatal growth patterns (and not typical SGA children by standard definition as in most studies) to children in the upper range. This can be considered a limitation, but it is also an opportunity to observe changes that occur within the lower and upper end of the defined normality. This might better reflect real-world growth patterns and underlying mechanisms as these effects occur rather continuously and not suddenly at a defined threshold qualifying for being SGA. Although the study does not allow us to draw any conclusions concerning boys, we believe that similar associations as seen in girls may also exist in boys and could be seen if studied at an older age. It should be noted that the PANIC study was an intervention study, and some of the children received physical activity and dietary intervention between baseline and follow-up visits, which have an effect on androgen levels and sexual maturation [45, 46]. However, we did not find differences in being in the intervention group between the 4 clusters compared. One may question the reliability of the clinical assessment of adult-type body odor and greasiness of hair and skin. Although our experience indicates that these signs of androgen action are well detectable in clinical examinations and that parents usually recognize the onset of these signs, we do agree that they are weak indicators of clinical adrenarche. We also agree that a definition of biochemical adrenarche selected for this study (serum DHEAS concentration of ≥1 µmol/L) has its limitations because serum DHEAS concentration is sexually dimorphic and does not necessarily correlate directly with clinical signs of androgen action [37, 47]. It would have been interesting to analyze 11-oxygenated androgen levels but, unfortunately, our in-house method did not cover these androgens at the time of measurements. The relatively wide range of androgen levels observed in the study may reflect the variation in the age of our study participants on the one hand, and the relatively small number of participants on the other.
In summary, previous studies have not necessarily been able to separate the role of small birth size and early postnatal growth in pubertal development. Our study was able to do so and found that at least in girls accelerated early growth and weight gain are more important predictors of higher serum androgen concentrations and earlier timing of adrenarche and puberty than small birth size. By contrast, the timing of these events is not shifted earlier in children with small birth size who do not have catch-up growth. Our findings emphasize that there is sexual dimorphism of growth and developmental trajectories, and an early window of opportunity in the first 6 months of life when the programming of growth and development may already be apparent. Thus, investigating early-life factors that lead to different trajectories of linear growth and weight gain is important to find regulators that could be targeted to modulate later development and adverse health outcomes.
Acknowledgments
We are grateful to all the children and their parents and caregivers who have participated in the PANIC study. We are also indebted to all members of the PANIC research team for their invaluable contribution in the acquisition of the data throughout the study. We also want to thank Biocenter Finland and Biocenter Kuopio for supporting their core LC-MS laboratory facility.
Funding
The PANIC study has been supported financially by grants from the Ministry of Education and Culture of Finland, Academy of Finland, Ministry of Social Affairs and Health of Finland, Research Committee of the Kuopio University Hospital Catchment Area (State Research Funding), Finnish Innovation Fund Sitra, Social Insurance Institution of Finland, Finnish Cultural Foundation, Foundation for Pediatric Research, Diabetes Research Foundation in Finland, Finnish Foundation for Cardiovascular Research, Juho Vainio Foundation, Paavo Nurmi Foundation, Yrjö Jahnsson Foundation, and the city of Kuopio. This work was also supported by the Sigrid Jusélius Foundation, and the Foundation for Pediatric Research (both from Helsinki, Finland; Research Fellowship grants to J.L.). The funding sources have not been involved in the design and conduct of the study; the collection, management, analysis, or interpretation of data; review or approval of the manuscript; or the decision to submit the manuscript for publication.
Author Contributions
T.A.L. and J.J. designed the PANIC study. T.A.L. and A.M. conducted the study. Steroid profiling with the LC-MS/MS method was performed by M.R.H., S.A., J.J., R.V., and T.A.L. J.L. planned and performed the statistical analyses. J.L., C.E.F., J.J., and T.A.L. interpreted the results. J.L. drafted the manuscript. All authors critically revised the manuscript for its intellectual content and approved the final version of the manuscript. T.A.L. is the principal investigator of the PANIC study.
Disclosures
The authors have nothing to disclose.
Data Availability
Information about the PANIC study and the data used in the present report are available at www.panicstudy.fi/en/etusivu. The data are not publicly available for research ethical reasons and because the owner of the data is the University of Eastern Finland and not the research group. However, the corresponding author can provide further information on the PANIC study and the PANIC data on a reasonable request.
Clinical Trial Information
Registration number NCT01803776 (www.clinicaltrials.gov) (registered March 4, 2013).
References
Abbreviations
- A4
androstenedione
- AA
children with average birth size and postnatal growth
- AGA
appropriate for gestational age
- AI
children with average birth size and increased postnatal growth
- BMI
body mass index
- BS
birth size
- DHEA
dehydroepiandrosterone
- DHEAS
dehydroepiandrosterone sulfate
- DOHaD
Developmental Origins of Health and Disease
- IGF
insulin-like growth factor
- LC-MS/MS
liquid chromatography—tandem mass spectrometry
- LGA
large for gestational age
- LH
luteinizing hormone
- PANIC
Finnish Physical Activity and Nutrition in Children
- PG
postnatal growth
- SA
children with small birth size and average postnatal growth
- SDS
SD score
- SGA
small for gestational age
- SI
children with small birth size and increased postnatal growth
- T
testosterone
- 11OHA4
11β-hydroxyandrostenedione
