


Abstract
Turner syndrome (TS) is a rare genetic syndrome with an increased mortality, mainly attributed to cardiovascular disease.
This work aimed to investigate and correlate the lipid profile in adult women with TS to clinical characteristics.
A 12-year prospective cohort study, including 4 study visits, was conducted at a specialist hospital. A total of 102 women with TS qualified for inclusion. Excluding missing variables and participants lost to follow-up, 86 women (mean age 38.1 years; range, 18.4-62.1 years) were included in this study. Fifty-three women completed the study. Repeated-measurement analysis was performed, using total cholesterol (Total-C), low-density lipoprotein (LDL), triglycerides (TGs), and high-density lipoprotein (HDL) as outcome variables and age, karyotype, body mass index (BMI), treatment with statins, antidiabetics, and hormone replacement therapy as explanatory variables. Principal component analysis (PCA) and partial least squares (PLS) analysis were performed at the first study visit.
Hyperlipidemia was present in 30% of the TS cohort. Total-C increased with age (0.12 mmol/L/y; P = .016). LDL (P = .08), TGs (P = .14), and HDL (P = .24) were not associated with age. BMI significantly increased total-C (0.19 mmol/L/kg/m2; P = .006), LDL (0.63 mmol/L/kg/m2; P < .001), and TGs (0.80 mmol/L/kg/m2; P < .001) and decreased HDL (−0.59 mmol/L/kg/m2; P < .001). PCA and PLS analysis found correlations between weight and BMI and total-C, LDL, and TGs.
Hyperlipidemia is more prevalent in adult women with TS across adulthood compared to the background population. Total-C, LDL, TGs, and HDL were significantly associated with BMI characterizing the atherogenic profile in adult women with TS.
Turner syndrome (TS) is a rare genetic syndrome resulting from monosomy of structural abnormality in the X chromosome [1]. TS is associated with perturbed endocrine homeostasis, which plays a known or presumed role in the higher risk of endocrine, metabolic, and cardiovascular disorders [1]. Women with TS have a 3-fold increased mortality compared to the background population, mainly attributed to cardiovascular disease [2].
Adipose tissue is an active paracrine and endocrine organ that receives afferent and expresses efferent signals to both the circulating hormone system, the nervous system, and the neuroendocrine system [3-5]. Adipose tissue expresses hormone receptors, including receptors for growth hormone (GH) and estrogen, that influence adipocyte differentiation and function through modulation of adipokines such as increased leptin production and decreased lipoprotein lipase activity [3, 6]. Most women with TS are estrogen deficient and are treated with estrogen replacement therapy (ERT) until natural menopause. They also receive GH treatment to increase final height through puberty despite not being formally GH deficient. Women with TS may suffer from androgen deficiency [7, 8]. GH, androgens, and ERT influences the cardiometabolic profile [1, 9].
Whether alterations in lipid levels in TS are present remains debated, since both normal and elevated levels have been reported [9-15]. Severe hypercholesterolemia is rarely reported but some degree of hypercholesterolemia occurs in 37% to 50% of adult women with TS. Others have reported normal lipid levels in TS alongside elevations in lipoprotein Lp(a) [10, 16-18]. Whether elevated or normal, the lipid metabolism in TS may be more atherogenic compared to 46, XX women with premature ovarian failure, and could manifest in early childhood [15, 19, 20]. Moreover, increased levels of low-density lipoprotein (LDL) and triglycerides (TGs) are associated with a reduced particle size of LDL and high-density lipoprotein (HDL) in TS, possibly increasing the harmful effects of hyperlipidemia [19, 21]. A syndrome-specific atherogenic profile with increased lipids in childhood contributing to the development of metabolic syndrome, type 2 diabetes, and cardiovascular and liver disease may be an important factor for increased morbidity and mortality in TS [12].
Bicuspid aortic valves and proximal aortic dilation is frequent in TS and are often associated [1]. A recent study among patients referred for aortic valve surgery showed that higher HDL and lower total cholesterol (Total-C) was related to smaller aortic diameters [22]. Furthermore, the subset of participants with bicuspid aortic valves who were treated with statins and had HDL levels within the target range had lower proximal aortic diameters [22]. We therefore speculate that also in patients with TS, who often have bicuspid aortic valves and increased ascending aortic diameters, lipid levels could be related to aortic diameters.
Thus, we aimed to describe the longitudinal changes in lipid metabolism in adult women with TS and its association with clinical characteristics.
Materials and Methods
Participants
The study cohort consists of 102 women with TS. The cohort was established in 2002 as a pragmatic interventional trial with follow-up extending 12 years across 4 study visits, as previously described [23]. Data from all 4 study visits were included in this study. In the repeated-measurement analysis, we included data from all 4 study visits, resulting in more than 12 years of follow-up.
In this cohort, measurement methodology, cardiac anomaly categorization, and observer variability have been described [24, 25].
Clinical Examinations and Anthropometry
Clinical examinations have previously been described [8]. Briefly, weight, height, and calculated body mass index (BMI) were collected at each visit. Medical history, karyotype, prescriptions, and comorbidities were obtained using medical records. Notably, none of the participants were prescribed insulin.
Biomarkers
Blood tests were performed after an overnight fast. Plasma lipids and TGs were measured using an automated commercially available system (Aeroset, Abbott Diagnostics). Glycated hemoglobin A1c (HbA1c) was measured by high-performance liquid chromatography. Creatinine, homocysteine, leukocyte count, thrombocyte count, and blood glucose were measured using standard methods. Androstenedione, total testosterone, free androgen index, dehydroepiandrosterone sulfate, 17β-estradiol, estrone, estrone sulfate, dihydrotestosterone, and 17OH-progesterone were measured by liquid chromatography–mass spectrometry using an accredited method. Luteinizing hormone and follicle-stimulating hormone were quantified separately on the Kryptor immunoassay analyzer (Brahms). Sex hormone–binding globulin (SHBG) was quantified using a solid-phase, 2-site fluoroimmunometric assay on the autoDELFIA 1235 immunoassay analyzer (PerkinElmer) [7]. Free androgen index is calculated as described by Bartsch [26]. Sex hormones were analyzed by standard procedures at Statens Serum Institut, Copenhagen, Denmark.
Blood Pressure
The methodology has previously been described and published [23]. Ambulatory blood pressure readings were recorded over 24 hours with oscillometric measurements every 20 minutes (SpaceLabs 91207). The cuff was positioned on the left arm, and cuff size was adjusted to the upper arm circumference.
Cardiovascular Magnetic Resonance Imaging
The methods have been described in detail previously [24, 27]. All studies were performed on the same 1.5 T whole-body scanner (ACS-NT, Philips Medical Systems; maximum gradient performance 30 Tesla per meter amplitude, slew rate 150 T/m/sec), using a 5-element cardiac coil. A contrast-free, nearly isotropic (voxel size: 1.4 1.4 3.0 mm), fat-saturated, 3-dimensional (3D) balanced steady-state free precession and electrocardiogram-triggered (diastolic) gradient echo sequence with a respiratory navigator was used. A standardized protocol acquired a 3D data stack of the thoracic aorta. Two experienced observers (including K.H.M.)—blinded to the clinical data and previous measurements—measured maximum and inner edge-to-inner edge diameters using multiplanar and double oblique reformatting. Perpendicular maximum diameters were measured for (1) aortic sinuses (measuring cusp-to-opposing-cusp diameter); (2) sinotubular junction; (3) mid-ascending aorta; (4) distal ascending aorta; (5) proximal aortic arch (between the brachiocephalic and left common carotid arteries); (6) distal aortic arch (proximal to the left subclavian artery); (7) aortic isthmus; (8) proximal descending aorta; and (9) distal descending aorta. Structural anomalies, including coarctation of the aorta and elongation of the transverse arch, were identified from the 3D data sets.
Statistics
Missing values
Individuals with incomplete blood pressure measurements and/or sex hormone blood samples were excluded (n = 16). Examining variables with the highest number of missing entries, we then excluded 3 variables: measurement position 5 in the aorta, which is often difficult to measure, HbA1c, and fasting blood glucose. This left 86 participants, with 53 variables available that only had few missing data corresponding to 2% of all data. We imputed the missing data using the R package imputeMFA. In the repeated-measurement analysis, the same participants and variables were included without imputation.
Repeated-measurement analyses
All 4 study visits were included in this model. Four continuous outcomes: Total-C, HDL cholesterol (HDL), LDL cholesterol (LDL), and TGs were analyzed in turn in a repeated-measurement analysis with a compound symmetry in the balanced study design. Loss to follow-up was unbiased and data were scrutinized to ensure that it did not contradict the assumption that participants were missing at random. In the compound symmetry model, the correlations are equal between each study visit. This correlation structure model was found to be superior to both a continuous autoregressive process correlation structure depending on time (age) and an unstructured correlation structure based on model fit statistics, diagnostic plots of the residuals, and the magnitude of their SDs. Furthermore, the diagnostic plots of the residuals for each outcome indicated a better fit when the outcome was transformed using the natural logarithm. In all, this model was found to be superior in a time-varying setting with some missing clinical data and repeated measurements to describe the development of lipids during the study. The covariates included 2 continuous variables: age and BMI, and 4 categorical variables: karyotype, ERT, statin use, and antidiabetic medication use. Karyotype 45, X was used as a reference against other karyotypes, while no treatment was used as reference against ERT, statin treatment, and antidiabetic medication. Reference values were coded as 0 against 1. The 4 outcomes and the 2 continuous predictor variables (BMI and age) were transformed using the natural logarithm. After back-transforming with the exponential function, the regression coefficients for age and BMI correspond to exponents in power functions (eg, ageb) while the coefficients for the categorical variables will correspond to relative changes compared to the references, which in turn can be expressed as the percentage changes from the reference levels. After back transformation the model reads
Where f(x) is either Total-C, LDL, TGs, or HDL in mmol/L. Back transformation of the intercept results in the constant “C,” which is dependent on each outcome variable. All regression coefficients are shown in Table 1.
Repeated-measurement analysis
| Total cholesterol, mmol/L | LDL cholesterol, mmol/L | Triglycerides, mmol/L | HDL cholesterol, mmol/L | |
|---|---|---|---|---|
| Age, y | 0.12 (0.02 to 0.22) P = .0160 | 0.13 (−0.02 to 0.28) P = .08 | 0.19 (−0.06 to 0.44) P = .14 | −0.08 (−0.21 to 0.06) P = .24 |
| BMI | 0.19 (0.05 to 0.0.32) P = .0063 | 0.63 (0.44 to 0.83) P ≤ .0001 | 0.80 (0.47 to 1.13) P ≤ .0001 | −0.59 (−0.77 to −0.41) P ≤ .0001 |
| Karyotype, 45, X or other | 3.3% (−3.5% to 10.6%) P = .34 | 2.8% (−7.1% to 13.7%) P = .59 | 8.8% (−8.5% to 29.4%) P = .33 | 4.1% (−6.9% to 16.4%) P = .47 |
| ERT, Y/N | 0.4% (−6.0% to 7.2%) P = .90 | −1.6% (−10.5% to 8.2%) P = .74 | 2.4% (−13.1% to 20.7%) P = .77 | 0.6% (−7.4% to 9.3%) P = .88 |
| Statin, Y/N | −12.0% (−18.2% to −5.3%) P = .0007 | −24.9% (−32.3% to −16.6%) P ≤ .0001 | −4.3% (−20.2% to 14.8%) P = .63 | 5.0% (−4.0% to 14.8%) P = .28 |
| Antidiabetic medication, Y/N | −13.3% (−19.5% to −6.6%) P = .0002 | −19.2% (−27.3% to −10.2%) P ≤ .0001 | −0.8% (−16.1% to 21.2%) P = .92 | −5.7% (−13.9% to 3.4%) P = .21 |
Coefficients for repeated-measurement analysis on visit 1 to 4. Estimates are followed by 95% CI in parentheses and P values. P values less than .05 appear in bold. Age and BMI are exponential, for example, ageb while karyotype, ERT, statin, and antidiabetic medication are in percentage changes. For karyotype 45, X is reference to non-45, X. For ERT, statin, and antidiabetic medication, no treatment is reference to treatment, that is, the estimates are the effect of the specific treatment.
Abbreviations: BMI, body mass index; ERT, estrogen replacement therapy; HDL, high-density lipoprotein; LDL, low-density lipoprotein; N, no; Y, yes.
Principal component analysis and partial least squares analyses
The principal component analysis (PCA) and partial least squares (PLS) analysis are based on data from the first study visit. Four continuous variables—Total-C, HDL, LDL, and TGs—were included in this analysis. To examine correlations between these variables, we used 2 data reduction techniques (shrinkage methods): PCA and PLS. To exploit these data-reduction techniques, we chose an unbiased approach by including all possible variables from the data set in this analysis without considering any modes of causality. This increases the chance of discovering unknown correlations, but also increases the risk of type I errors. However, by reporting the first dimensions, we have minimized this risk [28].
PCA condenses the variables of a data set by transforming these variables into a new smaller set of variables termed principal components. These principal components correspond to a combination of all input variables, which explains the variance in a data set. Using this information, PCA extracts hidden patterns within the data set. We used Total-C, HDL, LDL, and TGs to explain the variation and then projected the other variables to the dimensions specified by the lipids.
PLS minimizes prediction error in both the response and predictor variables with emphasis on the variation in the response variables. This is an advantage when handling multiple response variables that may be highly correlated. Where ordinary linear prediction models minimize sample response error, PLS balances the variation in the response and prediction variables, that is, it seeks to describe as much as possible of the covariance between X and Y, instead of concentrating on the variance of X. Leave-one-out validation was used to account for outlier influence. However, modeling using cross-validation did not alter the results. Total-C, HDL, LDL, and TGs were grouped in a single group and used as a single predictor variable using the total variation within the lipid variables. We then compiled similar variables into 7 groups, representing different clinical traits, and used them as explanatory variables to explain the variation within the lipid group. The similarity in the 7 groups enabled us to investigate whether any variation within the lipids could explain the variation in a certain clinical trait. The 7 explanatory groups were (1) systolic blood pressure, (2) diastolic blood pressure, (3) pulse, (4) anthropometrics, (5) biochemistry, (6) magnetic resonance imaging (MRI) measurements, and (7) sex hormones. The variables contained within each of these 7 groups are shown in Table 2.
Overview of groups for partial least squares analysis
| Group | Variables | |
|---|---|---|
| 1 | Systolic blood pressure | Averages of day and night measurements from a 24-h blood pressure measurement (mm Hg) |
| 2 | Diastolic blood pressure | Averages of day and night measurements from a 24-h blood pressure measurement (mm Hg) |
| 3 | Pulse | Averages of day and night measurements from a 24-h blood pressure measurement (bpm) |
| 4 | Anthropometrics | Height (cm) and BMI |
| 5 | Biochemistry | Creatinine (mmol/L), homocysteine (mmol/L), leukocyte count (109/L), and thrombocyte count (109/L) |
| 6 | MRI measurements | Perpendicular maximum diameters: (1) aortic sinuses (measuring cusp-to-opposing-cusp diameter); (2) sinotubular junction; (3) mid-ascending aorta; (4) distal ascending aorta; (5) distal aortic arch (proximal to the left subclavian artery); (6) aortic isthmus; (7) proximal descending aorta; and (8) distal descending aorta |
| 7 | Sex hormones | LH (IE/L), FSH (IE/L), testosterone (nmol/L), free testosterone (nmol/L), estradiol (pmol/L), SHBG (nmol/L) |
Overview of groups for partial least squares analysis on visit 1.
Abbreviations: BMI, body mass index; FSH, follicle-stimulating hormone; LH, luteinizing hormone; MRI, magnetic resonance imaging; SHBG, sex hormone–binding globulin.
All statistics were calculated using R 4.1.2 and RStudio 2022.02.02 (Build 485), R packages: nlme, FactoMineR and pls [29-32].
Ethics
Informed consent was obtained from each participant, and the study protocol adhered to the 1975 Declaration of Helsinki as reflected in a prior approval by Aarhus County Ethical Scientific Committee (Denmark) (No. 20010248). The study is on ClinicalTrials.gov (NCT01678274).
Results
Descriptive Statistics
Eighty-six women with TS were included in this 12-year follow-up study. Loss to follow-up was due to death (n = 7), emigration (n = 1), and loss of contact (n = 25). Sensitivity analysis based on loss to follow-up did not alter results (data not shown), indicating missing at random as also found previously [23].
Baseline characteristics are shown in Table 3. Fig. 1 indicates that participants with high LDL also had high TGs and Total-C levels. The figure shows that participants with high HDL had low TGs and LDL levels, and those with high HDL levels also had high Total-C levels.
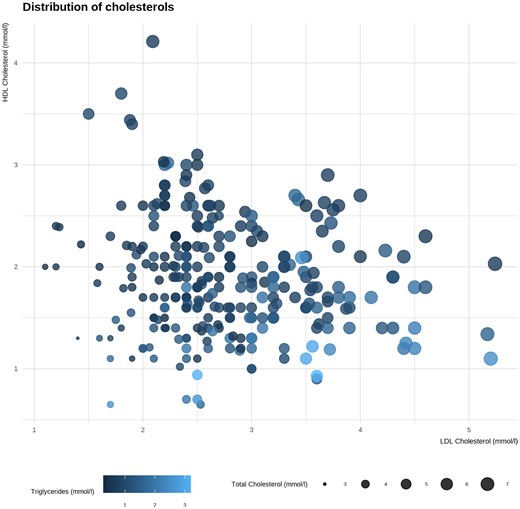
Lipid measurements at first study visit. X-axis: low-density lipoprotein (LDL) cholesterol. Y-axis: high-density lipoprotein (HDL) cholesterol. Sizes: determined by total cholesterol. Color: determined by level of triglycerides.
Descriptive statistics
| Anthropometrics, lipids, and prescriptions during study | ||||
|---|---|---|---|---|
| Visit | 1 (n = 86) | 2 (n = 78) | 3 (n = 73) | 4 (n = 53) |
| Age, mean (range), y | 38.1 (18.4-62.1) | 41.1 (21-64) | 45.6 (23.9-66.6) | 48.0 (30.2-66.2) |
| Karyotype (45, X; n %) | 52 (60.5%) | 49 (62.8%) | 46 (63.0%) | 37 (69.8%) |
| Height, mean (range), cm | 147.4 (134-171.3) | 147.3 (133-170) | 146.9 (135.6-170.6) | 147.3 (135.5-160.8) |
| Weight, mean (range), kg | 57.9 (38.5-103.5) | 58.0 (37.1-104.0) | 59.8 (35.5-104.0) | 62.3 (37.6-92.7) |
| BMI, mean (range) | 26.6 (18.4-43.6) | 26.7 (17.6-45.9) | 27.7 (19.0-48.1) | 28.6 (18.8-42.8) |
| 24-h systolic blood pressure, mean, (range), mm Hg | 122 (99-192 | 119 (98-159) | 118 (92-160) | 118 (89-148) |
| 24-h diastolic blood pressure, (range), mm Hg | 77 (56-134) | 76 (55-96) | 75 (55-95) | 74 (52-102 |
| HbA1c, mean (range), mmol/mol | 38 (19-86) | 37 (18-84) | 38 (26-70) | 39 (28-70) |
| Total cholesterol, mean (range), mmol/L | 5.2 (3.7-7.6) | 5.0 (3.0-7.2) | 5.3 (3.3-7.4) | 4.9 (3.3-7.0) |
| HDL cholesterol, mean (range), mmol/L | 2.0 (0.7-4.2) | 1.9 (0.7-3.4) | 1.8 (0.7-3.7) | 1.8 (0.7-3.5) |
| LDL cholesterol, mean (range), mmol/L | 2.8 (1.2-5.2) | 2.7 (1.2-4.6) | 3.0 (1.1-5.2) | 2.6 (1.2-4.6) |
| Triglycerides, mean (range), mmol/L | 1.0 (0.3-3.0) | 1.0 (0.3-3.0) | 1.1 (0.5-2.6) | 1.1 (0.3-3.2) |
| Prescribed ERT, n, % | 73 (84.9%) | 65 (83.3%) | 59 (80.8%) | 38 (71.7%) |
| Prescribed statin, n, % | 6 (7.0%) | 8 (10.3%) | 11 (15.1%) | 15 (28.3%) |
| Prescribed antidiabetics, n, % | 7 (8.1%) | 10 (12.8%) | 12 (16.4%) | 14 (26.4%) |
Baseline characteristics, anthropometrics, and lipids during the study period.
Abbreviations: BMI, body mass index; ERT, estrogen replacement therapy; HbA1c, glycated hemoglobin A1c; HDL, high-density lipoprotein; LDL, low-density lipoprotein.
Using a cutoff point of LDL above 3.0 mmol/L for participants not prescribed antidiabetic medicine, 23 participants (30.7%) had hypercholesterolemia at baseline, whereas 52 participants (69.3%) had normal LDL (Table 4). Using a cutoff point of 2.6 mmol/L for LDL for participants prescribed antidiabetic medicine, only 1 participant had hypercholesterolemia and 6 had LDL below 2.6 mmol/L. Changes in these proportions across the follow-up are shown in Table 4. Hypercholesterolemia was present in 24 (29%) at baseline, and only 6 participants were treated with statins at this time point, of whom 1 had hyperlipidemia, and the remaining 5 had normocholesterolemia.
Lipid status at each visit
| Lipid status at each visit | ||||
|---|---|---|---|---|
| Not receiving antidiabetic medicine | ||||
| Visit | 1 | 2 | 3 | 4 |
| LDL cholesterol < 3.0 mmol/L, n (%) | 52 (69.3%) | 50 (72.5%) | 36 (59.0%) | 28 (66.7%) |
| LDL cholesterol > 3.0 mmol/L, n (%) | 23 (30.7%) | 19 (27.5%) | 25 (41.0%) | 14 (33.3%) |
| Missing, n | 4 | 7 | 13 | 30 |
| Receiving antidiabetic medicine | ||||
|---|---|---|---|---|
| Visit | 1 | 2 | 3 | 4 |
| LDL cholesterol < 2.6 mmol/L, n (%) | 6 (85.7%) | 7 (87.5%) | 5 (50.0%) | 8 (80.0%) |
| LDL cholesterol > 2.6 mmol/L, n (%) | 1 (14.3%) | 1 (12.5%) | 5 (50.0%) | 2 (20.0%) |
| Missing, n | 0 | 2 | 2 | 4 |
| Receiving antidiabetic medicine | ||||
|---|---|---|---|---|
| Visit | 1 | 2 | 3 | 4 |
| LDL cholesterol < 2.6 mmol/L, n (%) | 6 (85.7%) | 7 (87.5%) | 5 (50.0%) | 8 (80.0%) |
| LDL cholesterol > 2.6 mmol/L, n (%) | 1 (14.3%) | 1 (12.5%) | 5 (50.0%) | 2 (20.0%) |
| Missing, n | 0 | 2 | 2 | 4 |
| Summary | ||||
|---|---|---|---|---|
| Visit | 1 | 2 | 3 | 4 |
| Normocholesterolemia, n (%) | 58 (70.7%) | 57 (74.0%) | 41 (57.7%) | 36 (69.2%) |
| Hypercholesterolemia, n (%) | 24 (29.3%) | 20 (26.0%) | 30 (42.3%) | 16 (30.8%) |
| Missing, n | 4 | 9 | 15 | 34 |
| Summary | ||||
|---|---|---|---|---|
| Visit | 1 | 2 | 3 | 4 |
| Normocholesterolemia, n (%) | 58 (70.7%) | 57 (74.0%) | 41 (57.7%) | 36 (69.2%) |
| Hypercholesterolemia, n (%) | 24 (29.3%) | 20 (26.0%) | 30 (42.3%) | 16 (30.8%) |
| Missing, n | 4 | 9 | 15 | 34 |
Lipid status at visit 1 to 4. For women without diabetes, LDL cholesterol above 3.0 mmol/L is considered as hypercholesterolemia. For women with diabetes, LDL cholesterol above 2.6 mmol/L is considered as hypercholesterolemia. Cutoff limits were based on current clinical treatment guidelines.
Abbreviation: LDL, low-density lipoprotein.
Repeated-Measurement Analysis
Repeated-measurement analyses showed that only total-C increased significantly with increasing age, although LDL and TGs showed a similar trend (see Table 1). BMI was the only variable that significantly influenced lipid levels, increasing Total-C, LDL, and TGs, and decreasing HDL. Treatment with statins and antidiabetic medications decreased Total-C and LDL, with estimated changes in LDL equal to −24.9% and −19.2% respectively during the study period. Treatment with statins and antidiabetic medications was not associated with changes in TGs or HDL. The measured levels of lipids during the study period for each participant is shown in Fig. 2, along with the predicted developments of the lipids. Karyotype and ERT were not associated with changes in Total-C, LDL, TGs, or HDL.
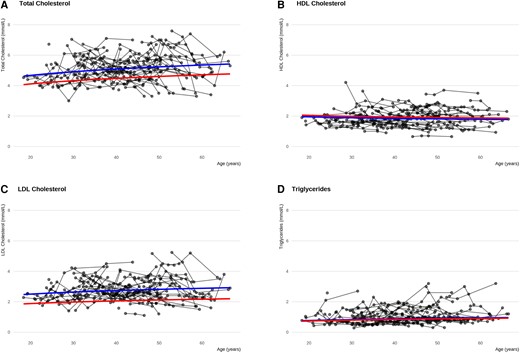
Changes in cholesterols and triglyceride levels in women with Turner syndrome (TS) across adulthood. The lines illustrate the predicted development in cholesterols and triglycerides for women with TS not receiving neither ERT, statin or antidiabetic medications and women with TS receiving statin treatment across age. Women with TS taking statins at study entry are included in the latter group. Blue lines: predicted development for a women with TS, 45, X, body mass index of 25, and receiving neither ERT, statin, or antidiabetic treatment. Red lines: Effect of statin treatment to the conditions of the blue line. Participants taking statins entering the study are included in this group, explaining the different starting points of the curves. Black lines: connected actual individual measurements during the study. A, total cholesterol. B, high-density lipoprotein (HDL) cholesterol. C, low-density lipoprotein cholesterol. D, triglycerides. ERT, estrogen replacement therapy.
Principal Component Analysis and Partial Least Squares
PCA analysis showed that Total-C, LDL, and TGs were associated in the first dimension, and HDL was associated in the second dimension, indicating a slight association with Total-C (Fig. 3, Table 5). Age and height trended toward an association with the lipid parameters in dimension 1. Dimension 2 suggested associations between TGs, weight, and BMI. HDL, testosterone, and SHBG hinted at a very slight association in the opposite direction. No categorical variables clearly distinguished the participants in the first 2 dimensions. Statin use, karyotype, and elongated aortic arch were statistically significant in dimension 3, but it may be coincidental as that dimension described only 14% of the variation (data not shown). Too few participants were taking statins (n = 6) or antidiabetics to be incorporated into the PCA.
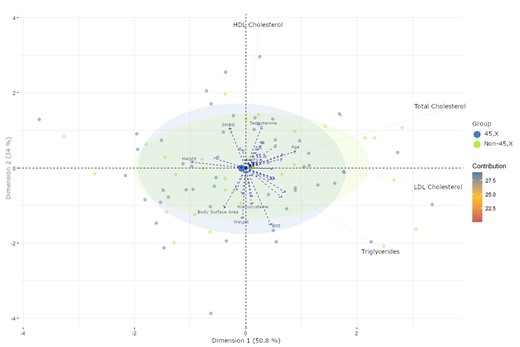
PCA analysis using total-, HDL-, LDL cholesterol, and triglycerides as explanatory variables to restrict the dimensions. All other variables are projected onto these dimensions. Variable contributions in the determination of a given principal component are (in percentage): (cos2(variable) × 100)/(total cos2 of the component). Participants are presented as dots based on karyotype. Blue dots: 45, X. Green dots: non-45, X. Variables are presented as arrows. PCA, principal component analysis; HDL, high-density lipoprotein; LDL, low-density lipoprotein; SHBG, sex hormone–binding globulin.
Principal component analysis of the first study visit using lipids as explanatory variables
| PCA analysis | |||
|---|---|---|---|
| Variables | Correlation | P | |
| Dimension 1 | Total cholesterol, mmol/L | 0.91 | <.0001 |
| LDL cholesterol, mmol/L | 0.90 | <.0001 | |
| Triglycerides, mmol/L | 0.62 | <.0001 | |
| Age, y | 0.23 | .031 | |
| Height, cm | −0.25 | .018 | |
| Dimension 2 | HDL cholesterol, mmol/ | 0.96 | <.0001 |
| Total cholesterol, mmol/L) | 0.40 | <.0002 | |
| Testosterone, mmol/L | 0.29 | .007 | |
| SHBG, mmol/L | 0.28 | .010 | |
| Homocysteine, mmol/L | −0.26 | .016 | |
| Body surface area, m2 | −0.28 | .009 | |
| Weight, kg | −0.36 | .0008 | |
| BMI | −0.40 | .0001 | |
| Triglycerides, mmol/L | −0.54 | <.0001 | |
PCA analysis on the first study visit: total cholesterol, LDL cholesterol, HDL cholesterol, and triglycerides were used to explain the variation. All other variables are projected to these dimensions. No categorical variables were significantly associated with these dimensions.
Abbreviations: BMI, body mass index; HDL, high-density lipoprotein; LDL, low-density lipoprotein; PCA, principal component analysis; SHBG, sex hormone–binding globulin.
PLS analysis suggested that lipids had a modest association with anthropometrics, as they accounted for a maximum of 22% of the variation within the anthropometrics group (Table 6). This association was also found in the PCA analysis, as TGs, and to some degree LDL, were found in dimension 2 alongside weight and BMI. Thus, the PCA and PLS models suggested that lipids, mainly TG levels, were associated with weight and BMI. Lipids did explain 12% of the variation in the biochemistry group; however, the corresponding model diagnostics plots deemed the model unreliable. The PLS analysis did not depict clinically relevant associations between lipids and the remaining clinical parameters.
Partial least squares
| Variance explained per component | |||||
|---|---|---|---|---|---|
| Model | Groups | 1 | 2 | 3 | 4 |
| 1 | Lipids (X) | 47.7% | 66.5% | 99.0% | 100% |
| Systolic blood pressure (Y) | 2.0% | 2.7% | 2.7% | 3.2% | |
| 2 | Lipids (X) | 49.1% | 74.0% | 99.3% | 100% |
| Diastolic blood pressure (Y) | 1.4% | 1.5% | 1.6% | 1.7% | |
| 3 | Lipids (X) | 33.4% | 49.7% | 98.8% | 100% |
| Pulse (Y) | 4.2% | 4.6% | 4.6% | 5.0% | |
| 4 | Lipids (X) | 33.7% | 59.2% | 99.4% | 100% |
| Anthropometrics (Y) | 19.4% | 21.2% | 21.4% | 21.5% | |
| 5 | Lipids (X) | 41.4% | 83.6% | 99.3% | 100% |
| Biochemistry (Y) | 12.1% | 12.7% | 12.8% | 12.9% | |
| 6 | Lipids (X) | 42.6% | 84.5% | 93.2% | 100% |
| MRI measurements (Y) | 3.9% | 4.2% | 5.8% | 7.5% | |
| 7 | Lipids (X) | 38.1% | 84.9% | 87.0% | 100% |
| Sex hormones (Y) | 2.9% | 3.0% | 4.4% | 4.6% | |
Partial least squares analysis, visit 1. Lipids were used as independent variables against each group in turn. All data were ln-transformed.
Abbreviation: MRI, magnetic resonance imaging.
Discussion
Hyperlipidemia is highly prevalent in TS, and is mainly unaffected by age, with only Total-C increasing significantly with age. Anthropometrics in TS are indicated to be associated with changes in Total-C, LDL, TGs, and HDL, especially as BMI significantly influenced all lipid parameters over time. Short stature and increased weight are phenotypical traits often seen in TS, which may therefore also be associated with a syndrome-specific atherogenic profile increasing the risk of cardiovascular and metabolic diseases.
Approximately 30% of the participants had hyperlipidemia, which is higher than the background population and comparable to other studies of TS [4, 33, 34]. As only Total-C increased with age in this cohort, the onset of increased levels of cholesterols and TGs could have occurred before entry in our study. Dyslipidemia in TS has been found in children with TS as early as in the first decade of life, so even before treatments with estrogen or GH, and then increases up to 50% in adults [16, 20].
Higher BMI was associated with increased Total-C, LDL, and TG levels, whereas the inverse was the case for BMI and HDL, corroborating previous studies [16, 20]. This was evident on repeated-measurement analysis and PCA analysis depicted similar associations, where LDL and TGs were positively associated with weight and BMI, whereas HDL was negatively associated with the anthropometric indices. There was not a statistically significant interaction between age and BMI, thus this effect seemed to be independent of BMI change with age. Theoretically, the effect of BMI could plateau at some value; however, the data did not allow for estimation of a cutoff value for the effect of BMI. This would be interesting to include in future studies. Despite being readily available, BMI is a poor indicator of body composition in women with TS [35]. Future studies should use a dual-energy x-ray absorptiometry scan, a whole-body MRI, or similar and more optimal methods to estimate body composition in TS.
Karyotype was not predictive of levels of Total-C, LDL, TGs, or HDL. It could be hypothesized that karyotypical differences affect lipid metabolism early in life and thus is difficult to detect in this study design. Whether increased level of lipids is caused by monosomy of the X chromosome or side effects such as deficient endocrine activity of the ovaries is still debated [16, 36, 37]. More than half of girls with TS show signs of ovarian failure during infancy and less than 6% with nonmosaic TS undergo spontaneous puberty, suggesting a different pathogenesis of lipid metabolism in TS [5]. Obesity also affects the ovarian steroidogenesis, and free fatty acids may induce toxic effects and low-grade inflammation on a cellular level if these systems are affected already during infancy [5]. Importantly, more than 50% of women with TS have a karyotype other than 45, X [38], indicating that the causative mechanism is most likely multifactorial [39]. Conclusively, genetic factors causing an altered hormonal and metabolic homeostasis between estrogen, GH, thyroid hormones, and adipose tissue can affect the lipid profile in TS [16, 20].
Lipid levels did not increase after the age of natural menopause (51-53 years), when supplementation with ERT in TS is usually terminated in the outpatient clinic. This could be due to the age of the study participants or caused by unknown intrinsic factors specific for TS. Physiological menopause is characterized by an abrupt decline in estrogen levels, leading to an increase in visceral fat and redistribution of white adipose tissue from a gynecoid to an android distribution [6, 34]. Likewise, ERT did not seem to affect Total-C, LDL, TGs, or HDL, although this may relate to the fact that more than 70% of the study cohort was receiving ERT.
Interestingly, HDL was indicated to have a slight association with testosterone and SHBG. TS is associated with androgen deficiency, perhaps further exacerbated by an ERT-induced increase in SHBG levels and subsequent reduction in free testosterone [7, 8]. Fifty percent of testosterone is produced by the ovaries of healthy premenopausal women and the other half is produced by the adrenals, and this proportion seems stable throughout and after the menopausal decline [40-42]. Failure of the endocrine functions of the ovaries, caused by intrinsic factors in TS, leads to androgen deficiency [40]. Importantly, it seems that treatment with low-dose testosterone does not adversely affect cardiometabolic markers [43].
We saw an increase in the percentage of participants developing type 2 diabetes and thus receiving antidiabetic medicine from 8% to 26% during the study period. Antidiabetic treatment was significantly associated with a reduction in Total-C and LDL in the repeated-measurement analysis. This effect could be caused by initiation of antidiabetic treatment including statins, and/or closer follow-up. A major contributing factor to the lipid abnormalities found in TS may be increased insulin resistance possibly affecting TGs as this is correlated with glucose levels [20].
Strengths and Limitations
We have examined a large cohort of 102 women with TS who have been thoroughly investigated with clinical examination resulting in abundant data for investigating correlations between clinical traits in TS. Loss to follow-up and missing values are clear limitations in this study, and these are inherent challenges in prospective cohort studies. A previous analysis of this cohort concluded that participants were most likely missing at random, and we were able to make a sound imputation excluding very few participants [23]. Also, it has been hypothesized that hyperlipidemia in TS might manifest already during childhood, while the mean age of the participants in this study was 38 years at inclusion, which could reduce the observed age effect in this study. Mortality is increased in TS, most prominently early in life, and relatively mortality decreases with increasing age in TS compared with the background female population, possible due to phenotype bias, and therefore it could be that lipids play a more important role through infancy and puberty as a part of more severe phenotypic expressions of TS [44]. Importantly, no information was recorded on the participants between the 4 study visits. This could account for some of the variation in the measured lipid values if these were measured close to receiving a diabetes diagnosis and/or the initiation of antidiabetic, statin, or antihypertensive treatments. We are unable to estimate how this might have affected the results. Thus, specific information on ERT, antidiabetic, and antihypertensive medications, including type, duration, and dosage are lacking and should optimally be included in future studies. Approximately 30% to 50% of adult women with TS are prescribed antihypertensive medications [23]. Each class of antihypertensive medications influences the lipid profile in a distinct way [45, 46]. Data did not support an investigation of the effect of antihypertensive medications on the lipid profile in this study. We estimate that it is unlikely that the effect of antihypertensive medications on the lipid profile significantly alters the results. Likewise, inclusion of anthropometric measurements and information on physical activity in future studies would provide valuable information, because women with TS are prone to a more sedentary lifestyle [1]. Several parameters are not included in this study such as liver enzymes throughout the study, and measurements of distinct adipose tissue compartments (visceral and subcutaneous). Missing data in specific variables, such as HbA1c and glucose, may have led to an underestimation of the importance of insulin resistance. Likewise, we did not perform MRI of the liver and adipose tissue or measure liver enzymes during the entire study period. Inclusion of lipoprotein size could contribute valuable information to the atherogenic profile in TS. Linking the atherogenic profile to morbidity or mortality and investigating the endocrinological properties of adipose tissue in TS could be interesting factors to include in future research. As we were not able to find a specific effect of ERT, contrasting with previous studies in TS [47], future studies should investigate this in more detail.
Conclusion
Adult women with TS seem to have a more atherogenic profile, and hyperlipidemia may be more prevalent across adulthood compared to the background population. The levels of Total-C, LDL, TGs, and HDL were significantly associated with BMI. All these factors may contribute to the morbidity and mortality associated with TS. The cardiometabolic profile in TS needs further studies to elucidate its effects in TS.
Acknowledgments
Lone Kvist, Eva Schriver, and Susanne Sørensen are thanked for their expert technical help.
Funding
This work was supported by grants from the Lundbeck Foundation, the Danish Heart Foundation, the Augustinus Foundation, the Toyota Foundation, the Aase og Ejnar Danielsen Foundation, the Novo Nordisk Foundation (NNF13OC0003234 and NNF15OC0016474), the Foundation for the Advancement of Medical Science under The A.P. Møller and Chastine Mc-Kinney Møller Foundation, and the Family Hede Nielsen Foundation. None of these sources had any influence on any part of this manuscript.
Disclosures
The authors have nothing to disclose.
Data Availability
Restrictions apply to the availability of some or all data generated or analyzed during this study to preserve patient confidentiality or because they were used under license. The corresponding author will on request detail the restrictions and any conditions under which access to some data may be provided.
References
Abbreviations
- 3D
3-dimensional
- BMI
body mass index
- ERT
estrogen replacement therapy
- GH
growth hormone
- HbA1c
glycated hemoglobin A1c
- HDL
high-density lipoprotein
- LDL
low-density lipoprotein
- MRI
magnetic resonance imaging
- PCA
principal component analysis
- PLS
partial least squares
- SHBG
sex hormone–binding globulin
- TGs
triglycerides
- Total-C
total cholesterol
- TS
Turner syndrome
