


Abstract
Obesity and inactivity are risk factors for developing impaired glucose tolerance characterized by insulin resistance and reduced beta-cell function. The stimulatory effect of glucagon-like peptide 1 (GLP-1) on insulin secretion is also impaired in obese, inactive individuals. The aim of this study was to investigate whether endurance training influences beta-cell sensitivity to GLP-1.
Twenty-four female participants, age 46 ± 2 years, body mass index 32.4 ± 0.9 kg/m2, and maximal oxygen consumption 24.7 ± 0.8 mL/kg/min participated in a 10-week exercise training study.
Beta-cell sensitivity to GLP-1 was assessed in a subset of participants (n = 6) during a 120-minute hyperglycemic glucose clamp (8.5 mM) including a 1-hour GLP-1 (7-36 amide) infusion (0.4 pmol/kg/min). Changes in glucose tolerance, body composition, and cardiorespiratory fitness were assessed by oral glucose tolerance tests (OGTTs), dual-energy X-ray absorptiometry scans, magnetic resonance scans, and maximal oxygen consumption (VO2max) tests, respectively.
The c-peptide response to infusion of GLP-1 increased 28 ± 3% (P < 0.05) toward the end of the hyperglycemic clamp. The insulin response remained unchanged. Training improved glucose tolerance and reduced GLP-1, insulin, and glucagon levels during the OGTTs. Training increased VO2max (from 24.7 ± 0.8 to 27.0 ± 0.7 mL/kg/min; P < 0.05) and reduced visceral fat volume (from 4176 ± 265 to 3888 ± 266 cm3; P < 0.01).
Along with improved glycemic control, endurance training improved beta-cell sensitivity to GLP-1 in overweight women. The study was deemed not to constitute a clinical trial and was not registered as such.
Obesity and physical inactivity are risk factors for developing impaired glucose tolerance, a prestage to diabetes [1-3]. The prediabetic state is characterized by peripheral insulin resistance, impaired beta-cell function [4], and an inability to maintain normal plasma glucose [5-7]. Insulin resistance is an important component in the development of prediabetes [8], yet it is beta-cell function that determines if an individual develops impaired glucose tolerance or maintains glucose tolerance [9]. Among the characteristics of the dysfunctional beta cell in type 2 diabetes and prediabetes is an attenuated incretin effect [10-14]. The incretin effect, defined as the increased insulin secretion induced by oral compared with IV administration of glucose, is mediated by the 2 incretins, glucagon-like peptide 1 (GLP-1) and glucose-dependent insulinotropic polypeptide (GIP). GLP-1 and GIP are released from enteroendocrine cells in response to nutrients and potentiate glucose-induced insulin secretion via activation of their specific receptors on the pancreatic beta cells [15-18]. A reduced incretin effect may thus be due to impaired nutrient-stimulated secretion of GLP-1 and/or GIP [5, 19] or be a consequence of an impaired potency of the incretins to stimulate insulin secretion [20] (ie, a reduced incretin sensitivity at the level of the beta cell).
Physical activity, exercise training, and diet-induced weight loss are cornerstones in the treatment of impaired glucose tolerance and type 2 diabetes. Although exercise training can improve peripheral insulin sensitivity [21, 22] and beta-cell function [23-25], less is known about the effects of exercise training on the secretory capacity of enteroendocrine L cells (secreting GLP-1) and K cells (secreting GIP). Nevertheless, increased physical activity has been associated with greater glucose-induced GLP-1 responses [26] and both short- [27] and long-term [28] exercise training have been found to improve glucose-induced GLP-1 secretion, although others have reported no effect [29]. Importantly, very little is known about the effect of exercise training on beta-cell sensitivity to incretins. We hypothesized that endurance training improves beta-cell sensitivity to GLP-1 and here we investigate the effect of endurance training on both beta-cell sensitivity to GLP-1 and the incretin response to oral glucose in obese individuals.
Materials and Methods
Study Design and Participants
This exercise training study included 26 obese, untrained female participants with varying degree of glucose tolerance. The study was conducted at the Centre of Inflammation and Metabolism and was designed to compare the effect of intermittent versus continuous exercise on glucose tolerance and the secretion of incretins and pancreatic hormones. Thus, study participants were randomized into 2 groups performing either intermittent or continuous exercise. However, as the responses to both training modalities were not significantly different, we decided to combine the data from the intermittent and continuous groups. Furthermore, all participants were asked if they were interested in participating in a substudy including 2 additional study days. Six participants agreed (4 from the intermittent training group and 2 from the continuous training group). In this substudy, the effect of endurance training on beta-cell sensitivity to GLP-1 was assessed.
Female participants were eligible if they were 30 to 65 years of age, were overweight (BMI > 25 kg/m2) and had a low maximal oxygen consumption (VO2max) for their age [30]. Key exclusion criteria were diabetes, impaired fasting glucose, blood pressure > 140/90 mmHg, smoking, and any systemic disease.
All participants provided written informed consent and the study was approved by the ethical committee of the Capital Region of Denmark and was conducted in accordance with the Declaration of Helsinki.
Study Assessment
All participants went through a screening visit, which was followed by either 2 or 4 study visits. All participants completed study days 1 and 3. All participants were asked to participate in study day 2 and 4 and 6 participants volunteered to take part in the 2 additional study days. Study days 2 and 4 were performed 2 to 4 days after study days 1 and 3.
Study days 1 and 3
The study day started at 8 am after an overnight fast. Participants refrained from drinking coffee, tea, soft drinks, and alcohol for 24 hours before study days. Participants also refrained from doing any rigorous physical exercise for 72 hours before study days. We measured body weight and height to the nearest 0.1 kg and 0.5 cm, respectively. Blood pressure was measured twice in the supine position, with 10 minutes of rest preceding each measurement, using an automatic sphygmomanometer (greenlight 300, A.C. Cossor + Son Accoson Works, London, England) placed on the left arm. Participants were then subjected to a 3-hour 75-g oral glucose tolerance test (OGTT). A catheter was placed in an antecubital vein and blood was drawn before glucose ingestion at time point 0 minutes and after glucose ingestion at time points 10, 20, 30, 60, 90, 120, and 180 minutes. The blood was immediately centrifuged for 15 minutes at 2400g and 4°C and stored at -80°C until further analysis. Samples were assessed for glucose, insulin, c-peptide, GIP, GLP-1, and glucagon.
Following the OGTT, participants were scanned in a dual-energy X-ray absorptiometry scanner (GE Medical Systems lunar, Prodigy Advance) to estimate whole body fat percentage. VO2max was measured during an incremental exercise test on a cycle ergometer (Monark 839E, Monark Ltd, Varberg, Sweden) using an indirect calorimetry system (Quark b2, CosMed, Rome, Italy). The VO2max test was considered valid when the respiratory exchange ratio was > 1.1, or when a plateau in oxygen uptake was reached or when the heart rate had reached the estimated maximal heart rate ± 10 heart beats.
On the same day participants presented at the radiology section of the hospital for an magnetic resonance (MR) scan (3-Tesla MR scanner Siemens Magnetom Total imaging matrix magnetic resonance scanner, Erlangen, Germany) to determine visceral fat content. Four participants had metal prosthetics and could therefore not be MR scanned. After 10 weeks of exercise training, participants repeated this study day (study day 3) with at least 72 hours between the last training session and the study day.
Study days 2 and 4
Six participants took part in 2 additional study days (study days 2 and 4) where a 120-minute hyperglycemic glucose clamp with infusion of exogenous synthetic GLP-1 (7-36 amide) was performed. The clamp experiment was performed in the morning after an overnight fast. Throughout the study day, participants rested in a half-supine position in a hospital bed. A flexible catheter was placed in an antecubital vein in each arm. One catheter was used for blood drawing and the other for infusion of GLP-1 (7-36 amide) and a 20% glucose solution (Sygehus Apotekerne, Copenhagen, Denmark). A third catheter was inserted into a dorsal hand vein wrapped in a heating blanket to obtain arterialized blood.
After a basal blood sample was drawn at time point 0 minutes, a hyperglycemic glucose clamp was started and glucose was infused to increase blood glucose concentration to ~8.5 mmol/L during the first 15 minutes [31]. In brief, the initial glucose infusion rate (GIR) was 16 mg/kg/min and was decreased from 16 to 2 mg/kg/min over the following 14 minutes in a stepwise fashion. Thereafter, the GIR was adjusted based on the concentration of blood glucose with the aim to maintain blood glucose levels at 8.5 mmol/L. Every 5 minutes, blood was collected into preheparinized syringes (80 IU dry electrolyte-balanced heparin, Pico 50; Radiometer, Copenhagen, Denmark) from a heated hand vein and analyzed for glucose using an ABL 700 (Radiometer Copenhagen, Brønshøj, Denmark) or an EML 105 (Radiometer Copenhagen). Every 15 minutes, blood was sampled from an antecubital venous catheter for measurements of GLP-1, c-peptide, insulin, and glucagon. Blood was immediately centrifuged at 4°C for 10 minutes at 2400g and the plasma was stored at -80°C until analysis. From time point 60 to 120 minutes of the clamp, 0.4 pmol GLP-1 (7-36 amide) kg/min was infused using a Harvard pump (Alaris, Medical Systems, San Diego, CA). This dose was chosen because it results in plasma concentrations of GLP-1 similar to those observed during an OGTT [32]. Synthetic human GLP-1 (7-36) amide (lot number 1012265) with a purity of 98.7% and a net peptide content of 99% was purchased from Bachem Distribution Service (Weil am Rhein, Germany). GLP-1 was dissolved in sterile water containing 2% human serum albumin (CSL Behring 5% lot-number 4303000012, Bern, Switzerland).
Exercise Training
The training period lasted 10 weeks and all training sessions were supervised and performed at our research center. Participants trained 3 times weekly and depending on which training group they were allocated to, performed either 27 minutes of intermittent training or 40 minutes of continuous training. The intermittent training consisted of a 5-minute warm-up at a workload of 50% of VO2max, followed by alternations between workloads of 90% and 50% of VO2max every 2 minutes and 45 seconds. The continuous training consisted of 40-minute training sessions at a workload corresponding to 50% of VO2max. The intermittent and continuous exercise sessions were matched for total energy expenditure. To maintain training intensity throughout the 10-week training period, participants performed an incremental exercise test to volitional fatigue every 2 weeks and workload was adjusted accordingly. The adherence to the training regimen was ≥ 95%.
Analysis of Plasma Samples
Plasma glucose concentrations during the OGTT were measured at the department of Clinical Biochemistry at Rigshospitalet, Copenhagen, Denmark, using an ultraviolet test (Roche/Hitachi MODULAR P, Cobas, Roche, Basel, Switzerland). MSD kits were used to analyze insulin, leptin, and TNF-α concentrations in plasma (Adipokine Comb 1 hu, catalog no. K15276) and plasma glucagon concentrations were measured using radioimmunoassay kits (Millipore Cat# GL-32K, RRID:AB_2757819). Plasma concentrations of intact GIP and total GLP-1 were analyzed after extraction in 70% ethanol (vol/vol; final concentration). Intact, biologically active GIP was measured using antiserum code no. 98171 [33]. Plasma concentration of GLP-1 was measured against standards of synthetic GLP-1 7-36 amide using antiserum code no. 89390 in a final dilution of 1:200 000 and a tracer of I125-labeled GLP-1 (7-36 amide) as described in detail previously [34]. This antiserum is specific for the amidated COOH-terminus of GLP-1 and therefore mainly reacts with amidated GLP-1 of intestinal origin [34]. The assay reacts equally with intact GLP-1 and with the primary metabolite GLP-1 (9-36 amide) [34]. Plasma levels of IL-6 were measured using an ELISA (R&D Systems Cat# HS600C, RRID:AB_2893335).
Modeling Insulin Sensitivity and Secretion
Whole-body insulin sensitivity was calculated by the Matsuda and DeFronzo method [35] based on insulin (pmol/L) and glucose concentrations (mmol/L) during the OGTT. Whole-body insulin sensitivity index =
The insulinogenic index was defined as the ratio of the increment of plasma c-peptide to that plasma glucose at 30 minutes after the glucose load [36, 37]. The disposition index was calculated as the product of the Matsuda index and the insulinogenic index. The disposition index describes the hyperbolic relationship between insulin sensitivity and insulin secretion and thus the function of the beta cell adjusted for insulin sensitivity [38]. Insulin clearance was calculated by using the c-peptide:insulin molar ratio [39].
Statistical Analysis
Changes in glucose, insulin, glucagon, c-peptide, GLP-1, and GIP during the OGTT as well as glucose, insulin, GLP-1, glucagon, and c-peptide concentrations during the clamp, and GIR during the GLP-1-infusion following the training period were compared using a 2-way ANOVA (PROC MIXED, SAS version 9.1, SAS Institute, Cary, NC). Post hoc analyses were made with Tukey adjusted paired t tests. Body weight, BMI, fat mass, visceral fat volume, VO2max, blood pressure, cholesterol, high-density lipoprotein-cholesterol, low-density lipoprotein-cholesterol, triglycerides, and glucose before and after the training period were compared with a 2-tailed paired t test (PROC TTEST, SAS version 9.1, SAS Institute). For all data, the distribution was evaluated with probability plots and Kolmogorov-Smirnov tests (P > 0.15). Accordingly, BMI as well as plasma concentrations of glucose, insulin, c-peptide, glucagon, and GLP-1 were logarithmically (log10) transformed to fit a normal distribution. Untransformed data are presented as mean ± SEM, whereas log-transformed data are presented as geometric means with geometric SE. Statistical significance was set at P < 0.05.
Results
We screened 124 females and included 26 in the study. Two participants dropped out during the training period for personal reasons and are not included in the data analysis. Nine of the women were postmenopausal.
Body Composition, Lipid Profile, and Hormones
Participant characteristics at baseline and intervention-induced changes in body composition, lipid profile, blood pressure, cardiorespiratory fitness, and hormone levels are shown in Tables 1 and 2, respectively. Body weight, BMI, whole body fat mass, and visceral fat volume all decreased significantly following the training period (Table 2). Visceral fat volume decreased from 4176 ± 265 cm3 to 3888 ± 266 cm3 corresponding to a 19% reduction (P < 0.01). Cardiorespiratory fitness (VO2max) improved with training from 24.7 ± 0.8 mL/kg/min to 27.0 ± 0.7 mL/kg/min (P < 0.05). Blood pressure, total cholesterol, high-density lipoprotein, low-density lipoprotein, and triglycerides remained unchanged after the training intervention. Also, plasma levels of IL-6, TNF-alpha, leptin, and adiponectin were unaffected by the training intervention.
Participant characteristics; mean (SEM)
| OGTT, n = 24 | Clamp, n = 6 | |
|---|---|---|
| Age, y | 46 (2) | 46 (4) |
| Weight, kg | 89.3 (2.4) | 90.9 (4.5) |
| BMI, kg/m2 | 32.4 (0.9) | 32.4 (0.5) |
| Fasting glucose, mmol/L | 5.3 (0.1) | 5.4 (0.1) |
| 2-h glucose, mmol/L | 7.3 (0.3) | 6.9 (0.5) |
| Fasting insulin, pmol/L | 52.1 (6.5) | 48.2 (9.6) |
| VO2max, mL/kg/min | 24.7 (0.8) | 24.2 (1.7) |
Abbreviations: BMI, body mass index; VO2max, maximum oxygen uptake.
Intervention-induced changes, mean (SEM)
| Before training | After training | P value | |
|---|---|---|---|
| Weight, kg | 89.3 (2.4) | 88.1 (2.5) | <0.05 |
| BMI, kg/m2 | 32.4 (0.8) | 32.0 (0.9) | <0.05 |
| Fat mass, kg | 40.1 (1.6) | 38.6 (1.6) | <0.05 |
| Visceral fat volume, cm3 | 4176 (265) | 3888 (266) | <0.01 |
| Cholesterol, mM | 5.3 (0.1) | 5.1 (0.2) | 0.1688 |
| HDL-cholesterol, mM | 1.5 (0.1) | 1.5 (0.1) | 0.3353 |
| LDL-cholesterol, mM | 3.2 (0.1) | 3.1 (0.2) | 0.3316 |
| Triglycerides, mM | 1.2 (0.1) | 1.2 (0.1) | 0.9210 |
| Blood pressure, mmHg | 129 (4)/86 (3) | 130 (4)/87 (3) | 0.7844/0.3427 |
| VO2max, mL/kg/min | 24.7 (0.8) | 27.0 (0.7) | <0.05 |
| IL-6, pg/mL | 1.8 (0.2) | 1.5 (0.2) | 0.2320 |
| TNF-alpha, pg/mL | 2.8 (0.2) | 3.1 (0.3) | 0.2104 |
| Leptin, ng/mL | 56.8 (3.8) | 56.7 (3.7) | 0.5451 |
| Adiponectin, µg/mL | 61.1 (5.5) | 63.7 (6.1) | 0.2955 |
N = 18 for visceral fat volume.
Abbreviations: BMI, body mass index; VO2max, maximum oxygen uptake.
Hyperglycemic Glucose Clamp
To assess beta-cell responsiveness to glucose and GLP-1, we performed a hyperglycemic glucose clamp with infusion of GLP-1 in a subset (n = 6) of participants before and after a 10-week training period. During the first 15 minutes of the hyperglycemic clamp, glucose concentrations increased from 5.4 ± 0.1 and 5.5 ± 0.2 mmol/L (before and after training, respectively) to 8.6 ± 0.3 and 8.8 ± 0.2 mmol/L (before and after training, respectively) (Fig. 1A). Glucose concentrations remained stable until the infusion of GLP-1 was initiated at time point 60 minutes. Infusion of GLP-1 increased plasma concentrations of GLP-1 similarly on both study days (Fig. 1B). During the GLP-1 infusion (60-120 minutes), glucose levels decreased on average 0.3 mmol/L to 8.3 ± 0.2 and 8.5 ± 0.2 mmol/L (P < 0.02) with no difference between study days (Fig. 1A).
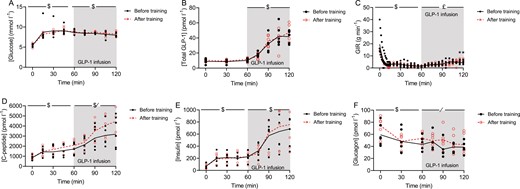
Plasma concentration of (A) glucose, (B) glucagon-like peptide (GLP-1), (C) glucose infusion rate (GIR), (D) plasma concentration of insulin, (E) c-peptide, and (F) glucagon during a hyperglycemic clamp (~8.5 mmol/L) with GLP-1 infusion before and after a 10-week training period. Data are from 6 participants. Insulin, c-peptide, glucagon, and infusion rate data are presented as mean ± SEM. GLP-1 and glucose data are presented as geometric mean ± geometric SE. *Indicates a significant difference between the before and after trial at the specific time point (P < 0.05). /Indicates a significant effect of training (P < 0.05). $Indicates a significant change over time (P < 0.05). £Indicates a significant interaction between training and time (P < 0.05).
During the GLP-1 infusion, glucose infusion rates interacted with training and time (P < 0.05) and were higher at time points 115 minutes (P < 0.05) and 120 minutes (P < 0.05) after the training period (Fig. 1C).
Insulin and c-peptide concentrations increased during the first 60 minutes of the hyperglycemic clamp (P < 0.01) with no difference between study days (Fig. 1D and 1E). Plasma levels of insulin and c-peptide increased further during the GLP-1 infusion, and during the last 30 minutes (90-120 minutes), the c-peptide concentration were on average 28 ± 4 3% higher (P < 0.05) (Fig. 1D), at time point 105 the mean difference was -958.3 95% CI (-1888 to -28.3), P = 0.0436. At time point 120 minutes, the mean difference was -1105 (-2035 to -175.0), P = 0.0204, and the insulin concentration was significantly unchanged (Fig. 1E) after the 10-week training period. Including body weight and visceral adipose tissue as covariates in the analyses, showed that neither body weight nor visceral adipose tissue had a significant effect on the improved c-peptide secretion in response to infused GLP-1. Of note, of the 6 participants in the clamp study, only n = 4 had visceral adipose tissue measurements.
As expected, glucagon concentrations decreased during the hyperglycemic clamp (0-60 minutes) (P < 0.01; Fig. 1F) and following the training period, plasma glucagon levels were higher during infusion of GLP-1 (Fig. 1F).
OGTT
The effect of endurance training on the incretin response was evaluated during an OGTT before and after a 10-week training period.
Systemic levels of GLP-1 in response to oral glucose were slightly reduced after the training intervention; GIP concentrations remained unchanged (Fig. 2A and 2B). The training intervention improved glucose tolerance (Fig. 2C), changes were evident in the later phase of the OGTT, at time point 120 minutes and 180 minutes, glucose levels were 1.0 ± 0.3 mmol/L (P < 0.01) and 0.6 ± 0.3 mmol/L (P < 0.05) lower after training (Fig. 2C).
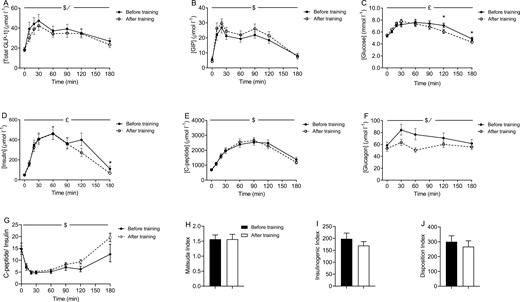
Plasma concentrations of (A) total glucagon-like peptide 1 (GLP-1), (B) intact glucose dependent insulinotropic peptide (GIP), (C) glucose, (D) c-peptide, (E) insulin, and (F) glucagon during an oral glucose tolerance test (OGTT) before and after a 10-week training period. (G) C-peptide: insulin, (H) Matsuda index, (I) insulinogenic index, and (J) disposition index before and after a 10-week training period. Data are from 24 participants and presented as geometric mean ± geometric SE. Matsuda index, insulinogenic and disposition index are presented as mean ± SEM. *Indicates significant difference between before and after training at the specific time point (P < 0.05). /Indicates significant effect of training (P < 0.05). $Indicates significant change over time (P < 0.05). £Indicates a significant interaction between training and time (P < 0.05).
Insulin concentrations during the OGTT were reduced after the training intervention (Fig. 2D). As with plasma glucose, the effect of training on plasma insulin was evident during the late phase of the OGTT. A comparison of fasting insulin levels (time point 0 minutes) with insulin levels at the end of the OGTT (time point 180 minutes) before and after the training period, revealed that whereas plasma insulin levels were elevated at the end of the OGTT (time point 0 minutes: 54.3 ± 6.6 pmol/L vs time point 180 minutes: 190.8 ± 42.6 pmol/L (mean ± SEM); P < 0.01) before training, plasma insulin returned to baseline levels after the training period (time point 0: 77.1 ± 20.6 pmol/L vs time point 180: 84.4 ± 11.1; P = 0.66; Fig. 2D). C-peptide concentrations were unaffected by the training intervention (Fig. 2E). Glucagon concentrations during the OGTT were significantly reduced following the training period (P < 0.01) (Fig. 2F). The calculated hepatic insulin clearance (c-peptide/insulin) revealed no significant effect of the training intervention, P = 0.0563 for the interaction between time and before/after training, P = 0.2882 for before vs after training. Consequently, none of the timepoints showed a significant difference between before training and after training samples (Fig. 2G). Finally, modelling insulin sensitivity [35], the insulinogenic index [36, 37], and the disposition index using c-peptide revealed no significant effect of the training intervention (Fig. 2H-J), modelling insulin sensitivity, and the insulinogenic index using insulin also showed no effect of the intervention (data not shown).
Discussion
The present study was undertaken to investigate the effects of endurance training on beta-cell sensitivity to GLP-1, glucose tolerance, and glucose-induced secretion of incretins in individuals with incipient impairment of glucose tolerance. To achieve this, obese physically unfit women went through a series of tests before and after a 10-week endurance-training period.
The data revealed a positive effect of endurance training on beta-cell sensitivity to GLP-1. After the training intervention, infusion of GLP-1 stimulated a greater rise in plasma c-peptide concentrations, in spite of identical glucose concentrations, indicating improved beta-cell sensitivity to GLP-1. The rise in plasma insulin in response to infusion of GLP-1 was not significantly affected by training. This discrepancy between GLP-1-induced c-peptide and insulin levels may be explained by a tendency toward an increased clearance of insulin (calculated based on c-peptide and insulin levels during OGTT) following the training intervention. Improved beta-cell sensitivity to GLP-1 following long-term training has, to the best of our knowledge, not been described previously. However, in a previous study, a single bout of exercise (1-hour walk) under similar clamping conditions was associated with increased insulin secretion in response to infusion of GLP-1 [40]. Yet, the mechanisms involved in beta-cell adaptations to acute and long-term exercise may differ.
Our data confirm that endurance training can improve glucose tolerance. Our data also confirm that endurance training in people with normal glucose tolerance does not improve beta-cell function (measured as insulin secretion during the OGTT) [41]. Solomon et al. show that although patients with type 2 diabetes respond to an exercise training intervention by improving beta-cell function, there was no effect on beta-cell function in persons with normal glucose tolerance [41]. Thus, it appears, that the level glycemic control is important for whether or not exercise training improves insulin secretion. The women included in our study had a normal glucose tolerance and probably therefore showed no effect on glucose-induced insulin secretion.
Improvements in glucose tolerance were evident during the later phase of the 3-hour OGTT. Combined with lower insulin levels, this is indicative of improvements in insulin sensitivity, which was not reflected by the Matsuda index. This may be because modelling the Matsuda index is based on glucose and insulin or c-peptide levels up until 120 minutes (and therefore does not include the effects seen at 180 minutes). Training-induced changes in insulin sensitivity were also not apparent during the hyperglycemic clamp (glucose infusion alone) because glucose infusion rates during the first half of the clamp were unaffected by training. The slightly increased glucose infusion rates towards the end of the GLP-1 infusion are likely related to increased secretion of c-peptide and insulin.
GLP-1 levels during the OGTT were slightly reduced after training; this is not in line with previous literature in obese individuals, where exercise training either had no effect [29] or a stimulatory effect on meal-induced GLP-1 secretion [27, 28]. The mechanism underlying the reduced GLP-1 secretion in our study is unclear; conceivably, increased beta-cell sensitivity to GLP-1 might somehow provide a feedback signal to the L cell to reduce GLP-1 secretion. However, improved insulin resistance may also have affected GLP-1 secretion [42, 43].
Whereas GLP-1 acts directly on beta cells to stimulate insulin secretion, the current view is that GLP-1 suppression of glucagon secretion from alpha cells is mediated mainly through indirect effects. Alpha-cell secretion is also powerfully regulated in an interplay with amino acid metabolism, which again is dependent on the functional status of the liver (eg, steatosis of the liver). Indeed, after training, visceral fat, which may include liver fat, (liver fat was not assessed in this study) was significantly reduced, which would be expected to be associated with the observed decrease in glucagon secretion [44].
The women participating in this study lost ~1.5 kg of fat mass and a significant amount of visceral adipose tissue. It is unclear how changes in body composition affect beta-cell sensitivity to GLP-1; however, weight loss has been shown to significantly improve beta-cell function [45, 46] and it is possible that the reduced fat mass in the present study contributed to the improved GLP-1 sensitivity of the beta cell. However, assessing the influence of changes in body weight and visceral adipose tissue on GLP-1-induced c-peptide levels in our study showed no significant effect. This may be due to the small number of participants in our clamp study; thus, we cannot conclude that changes in body weight or visceral adipose tissue do not have a role in the improved GLP-1 sensitivity of the beta cell—in other words, we cannot conclude that the observed changes are due to the exercise intervention; they may be driven by the weight loss.
Overall, the adaptations in glucose tolerance and glucoregulatory hormones to the training intervention are very mild. The women included in this study were normoglycemic to begin with, and there was maybe not much room for improvement. It is therefore interesting that beta-cell sensitivity to GLP-1 improved so clearly, and it raises the question whether beta-cell sensitivity to GLP-1 is a mechanism that is particularly sensitive to obesity. Moreover, the improved beta-cell sensitivity to GLP-1 is not reflected in the OGTT data, as speculated earlier, this may be due to a feedback signal from the beta cell to the L cell to reduce GLP-1 secretion. This would also explain why glucose-induced insulin and c-peptide secretion remain unchanged during the OGTT. Obese individuals and patients with type 2 diabetes are sometimes treated with GLP-1 receptor agonists, and it is tempting to suggest that combining exercise training with GLP-1 receptor agonist treatment might be more effective than GLP-1 receptor agonist treatment alone. A study in patients with type 2 diabetes showed that exercise combined with administration of the GLP-1 receptor agonist liraglutide improved glycemic control, insulin sensitivity, and beta-cell function more effectively than exercise alone [47]. Some studies have shown that exercise-induced improvements of beta-cell function in patients with type 2 diabetes are influenced by the diabetic status [23, 40]; thus, some patients may only benefit from exercise if exercise is combined with pharmacological treatment.
The study was originally designed to compare the effects of continuous vs intermittent endurance training and it can therefore be viewed as a limitation that these 2 training groups were combined only after the data were analyzed. That the study does not include a no-training control group can be viewed as a limitation. The small number of participants in the clamp study is another limitation, and the lack of control of dietary intake during the training intervention can be viewed as a limitation. Finally, hepatic insulin extraction, which has not been considered in the analyses, may influence the results. The participants included in this study were obese healthy women with near-normal glucose tolerance and functional beta cells, it would also be relevant to investigate individuals, including men, with impaired beta-cell function (ie, individuals with prediabetes and patients with type 2 diabetes).
In conclusion, this study shows that 10 weeks of endurance training in obese women improves beta-cell sensitivity to GLP-1. The study does not allow us to conclude that it is an effect of training per se; it is possible that changes in body composition drive the improvement in beta-cell sensitivity to GLP-1. Given that GLP-1 receptor agonists are used as treatment for obesity and type 2 diabetes, this finding has clinical implications and suggests that combining exercise training with GLP-1 receptor agonist treatment may be more effective than treatment with GLP-1 receptor agonists alone.
Abbreviations
- BMI
body mass index
- GIP
glucose-dependent insulinotropic polypeptide
- GIR
glucose infusion rate
- GLP-1
glucagon-like peptide 1
- MR
magnetic resonance
- OGTT
oral glucose tolerance test
- VO2max
maximal oxygen consumption
Acknowledgments
Ruth Rousing and Hanne Villumsen are acknowledged for their technical assistance.
Funding
The Centre for Physical Activity Research (CFAS) is supported by TrygFonden (grants ID 101390, ID 20045, and ID 125132). During the study period, the Centre of Inflammation and Metabolism was supported by a grant from the Danish National Research Foundation (#02-512-55) and by the Commission of the European Communities (contract no. LSHM-CT-2004-005272 EXGENESIS). This study was further supported by the Danish Medical Research Council and by the Carla Thiel Kragh Foundation.
Author Contributions
T.Å., M.N.S., R.W., K.M., conceived and designed experiments. T.Å., M.N.S., R.W., T.F.D., J.M.H., K.M., J.S.H., B.T., J.J.H., C.T., B.K.P., and H.E. performed experiments or analyzed the data and interpreted results. T.Å., M.N.S., R.W., J.J.H., and H.E. wrote the manuscript. All co-authors reviewed, edited, and approved the final version.
Disclosures
The authors have nothing to disclose.
Data Availability
Data generated in this study have not been uploaded to a public repository but are available from the corresponding author on request.
