


Abstract
Children with X-linked hypophosphatemic (XLH) rickets have muscle weakness that severely impairs their function. Intermuscular and intramuscular adipose tissue (IMAT and intraMAT, respectively) may contribute to this muscle weakness.
This work aimed to compare IMAT and intraMAT in XLH children vs typically developing (TD) children.
A prospective, monocentric cohort study was conducted of XLH (n = 11; aged 10.3 years [6-17]) and TD children (n = 22; aged 10.2 years [5-15.5]). All children underwent magnetic resonance imaging of the lower limbs; IMAT and intraMAT percentages were calculated after manual contouring of each muscle of the thigh and the deep fascia at mid-thigh level.
XLH children were comparable in age but shorter and heavier than TD children (P = .001 and P = .03, respectively). They had smaller muscle length and volume than TD children (P < .001) but there was no statistically significant difference in muscle cross-sectional area between the groups (P = .833). The total percentage of IMAT was higher in XLH children (8.66% vs 3.60% in TD children; P < .0001). In addition, though the total percentage of intraMAT did not differ significantly (12.58% and 10.85% in XLH and TD children, respectively; P = .143) intraMAT was statistically significantly higher in XLH children than TD children in 4 of the 13 muscles studied.
Our results show that IMAT is higher in young children with XLH, independently of obesity and overweight. Further, these results will facilitate both the early prevention of functional and metabolic consequences of the increase in adipose tissue in XLH children.
X-linked hypophosphatemic (XLH) rickets is a rare condition with a prevalence of 3.0 (1.4-6.5) to 8.1 (5.8-11.4) per million in the most recent UK epidemiological study [1]. It is the result of a mutation in the PHEX gene and the main clinical features in children are the combination of bone abnormalities (rickets and lower limb deformities), dental abnormalities, and muscle weakness [2]. While the first 2 of these symptoms have already been the subject of many studies [3–6], very few have objectively studied the quantitative and qualitative characteristics of muscles in these patients.
In 2012, Veilleux et al [7] described evidence muscle abnormalities in children with XLH on peripheral quantitative computed tomography (CT) scans. A study of muscle composition (via quantitative CT) and function (via jump mechanography) showed lower than normal muscle volume, density, and strength in the leg. Further, studies by Ducher et al [8] and Farr et al [9] suggest that the low muscle density and strength found in these XLH children are related to a high rate of intramuscular fat infiltration, highlighting the need for objective measurement of this type of adipose tissue. In 2020, our group reported on a cohort of 172 children with XLH (113 girls/59 boys) almost a third of whom were overweight or obese at as early as age 5 years and recommended careful monitoring of body mass index (BMI) in these patients [10].
Over the last decade, there has been growing interest in ectopic adiposity, especially that found in the lower limbs, known as intermuscular (IMAT, ie, beneath the deep fascia and between muscle groups) and intramuscular (intraMAT, ie, within and between muscle fibers). Ectopic fat is known not only to be predictive of metabolic disease such as insulin resistance [11–15], but also to be associated with decreased strength [16–19] and mobility impairment [20–23] and to have a direct role in muscle weakness [24, 25].
We describe a prospective analysis to quantify and compare muscle composition (IMAT and intraMAT) in XLH children vs typically developing (TD) children using magnetic resonance imaging (MRI). We hypothesize that IMAT and/or intraMAT are higher in XLH children than in TD children and that this may help explain muscle weakness.
Materials and Methods
Patients
A prospective, single-center, longitudinal cohort study was conducted at the Reference Center for Rare Disorders of the Calcium and Phosphate Metabolism, France. Patients diagnosed with XLH were included in the study and underwent an MRI scan if they met the following criteria: PHEX mutation; aged between 5 and 17 years; treatment with conventional therapy or burosumab; ongoing bone growth; no history of lower limb surgery; and ability to remain motionless during MRI. Further, TD children aged between 5 and 17 years were included as controls applying the following exclusion criteria: any diagnosis of metabolic or muscle disease, any history of lower-limb surgery or long-term treatment; or high-performance athlete status.
In accordance with the Jardé law in France, the study was approved by the French Data Protection Authority (CNIL) and by the institutional review board (Comité de Protection des Personnes reference No. 2020-A01386-33). Written informed consent was obtained from parents, along with assent from children (where appropriate).
Methods
Muscle MRI scans were performed in the Pediatric Radiology Department at Bicêtre Hospital (Le Kremlin-Bicêtre, France). The MRI was performed on a 3-Tesla whole-body scanner (Magetom Skyra, Siemens Healthcare) using a 24-channel spine matrix coil and three 4-channel flex coils from the same manufacturer. Image volume covered the pelvis and the limbs to the tip of the toes. The imaging protocol included a T1-weighted turbo spin-echo sequence for applying the Dixon method (repetition and echo times = 836 and 20 ms, field of view = 375 mm, voxel size = 1.0 × 1.0 × 5.0 mm, slice thickness = 5 mm, interslice gap = 10 mm). Water and fat images were automatically generated by the scanner. The patients were lying supine on the scanner bed with their ankles, knees, and hips in a neutral and relaxed position. No sedation or contrast injection was performed. The average acquisition time was 30 minutes.
To identify intraMAT, muscles needed to be reconstructed in 3 dimensions using specific software (Arts et Métiers ParisTech), based on a discrete particle swarm optimization method [26]. Muscle belly contours were detected on the MRI slices (on the in-phase images) between the proximal and the distal muscle-tendon junctions and the 3-dimensional reconstruction was semiautomatic. The muscle-tendon junction was identified on the T1-sequence images as the level where muscle fibers (dark color) were no longer visible and the tendon became visible (light color). Muscle contours were approximated, and at the end, the operator verified each slice and adjusted the contour as appropriate. This technique has been previously described and validated [27, 28]. Muscle lengths and volumes were calculating using MATLAB.
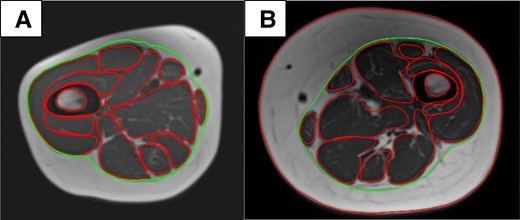
A, TD child; age 11 years. B, XLH child; age 10 years. Measurement of IMAT by manual tracing of the deep fascia at mid-thigh level. Green: deep fascia; red: external contour of the muscle. The inner and outer cortex were also traced. IMAT, intermuscular adipose tissue; TD, typically developing; XLH, X-linked hypophosphatemia.
Statistical Analysis
For each of the parameters studied, the 2 populations were compared in MATLAB using the t or Wilcoxon–Mann-Whitney tests, depending on whether the corresponding data were normally distributed. A correction for the multiple testing was applied. A P value of less than .05 was considered statistically significant. The normality of distributions was established using the Lilliefors test. Quantitative variables were described as means (± SD) and qualitative variables as numbers (percentages). We considered a value as normal when it falls within 1 SD of the mean value of the control group.
Results
Clinical Characteristics and Muscle Geometry at the Lower Limbs
We prospectively included 11 XLH children (5 boys and 6 girls), with a mean age of 10.3 years (6-17 years); and a group of 22 TD volunteers (13 boys and 9 girls), with a mean age of 10.3 years (5-15.5 years). Table 1 summarizes the clinical characteristics and muscle geometric parameters of participants. The ages of the XLH and TD children were comparable (P = .9); as expected, the XLH children were shorter and heavier than the TD children (P < .0001 and P = .022, respectively). In the lower limbs, XLH children had less muscle length and volume than TD children (P < .001); interestingly, however, muscle cross-sectional area (CSA) did not differ significantly between the groups (P = .833).
Clinical characteristics and muscle geometric parameters in X-linked hypophosphatemia children and typically developing children
| XLH (n = 11) ( ± SD) | TD (n = 22) ( ± SD) | P | |
|---|---|---|---|
| Clinical characteristics | |||
| - Age, y | 10.32 (±3.1) | 10.34 (±3.0) | .9 |
| - Height, cm | 126.69 (±15.2) | 143.75 (±16.4) | .001 |
| - Height (SD) | −1.71 (±1.03) | 1.28 (±1.03) | <.001 |
| - Weight, kg | 31.6 (±10.3) | 37.1 (±13.8) | .03 |
| - Weight (SD) | 0.96 (±1.05) | −0.16 (±1.62) | .02 |
| - BMI Geometric parameters of lower limb muscles | 19.2 (±2.5) | 17.3 (±3.0) | .01 |
| - Length, mm | 184 (±9.5) | 244 (±12.0) | <.001 |
| - CSA, mm² | 1097 (±853) | 1292 (±1013) | .83 |
| - Volume, mm3 | 123 105 (±96 442) | 180 840 (±133 203) | <.001 |
Values are presented as mean ( ± SD). In bold, P < .05.
Abbreviations: BMI, body mass index; CSA, cross-sectional area; TD, typically developing; XLH, X-linked hypophosphatemia.
Intermuscular Adipose Tissue
One child from the TD children group was excluded because of motion artifacts. The total percentage of IMAT was significantly higher in XLH children (8.66% [±3.26] vs 3.60% [±1.29] in TD children; P < .0001). We plotted a range of normality of IMAT and the variability of IMAT in the XLH children (Fig. 2): IMAT values were more than 2 SD above the mean for most XLH patients (82%; n = 9), 1 having IMAT values between 1 SD and 2 SD and only 1 having values within the range of normality.
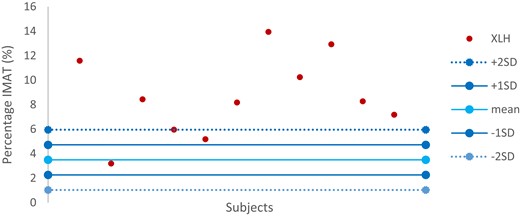
Variability of IMAT in XLH children in comparison with the range of normality defined by the TD child group. IMAT, intermuscular adipose tissue; TD, typically developing; XLH, X-linked hypophosphatemia.
Intramuscular Adipose Tissue
Table 2 illustrates the results of intraMAT in the lower-limb muscles of both groups. Two children from the control group were excluded: one had motion artifacts, and one was considered an outlier (value > 3 times the total intraMAT value).
Intramuscular adipose tissue percentage in thigh muscles
| % ( ± SD) | |||
|---|---|---|---|
| XLH (n = 11) | TD (n = 20) | P | |
| Thigh muscles | 12.58 (±4.12) | 10.85 (±1.69) | .14 |
| Gluteus maximus | 18.15 (±6.83) | 13.66 (±3.33) | .006 |
| Gluteus medius and minimus | 14.24 (±4.50) | 12.23 (±1.97) | .83 |
| Rectus femoris | 9.44 (±2.99) | 9.90 (±1.92) | >.99 |
| Vastus medialis | 11.02 (±4.91) | 8.03 (±1.32) | .23 |
| Vastus intermedius | 8.59 (±3.97) | 6.86 (±1.10) | .83 |
| Vastus lateralis | 9.89 (±4.18) | 8.60 (±1.89) | >.99 |
| Femoral biceps | 14.19 (±4.71) | 10.32 (±1.72) | .03 |
| Semimembranosus | 11.07 (±3.85) | 10.22 (±1.99) | .99 |
| Semitendinosus | 10.82 (±3.72) | 8.69 (±2.35) | .91 |
| Sartorius | 19.55 (±6.77) | 15.25 (±2.7) | .01 |
| Tensor fasciae latae | 14.84 (±6.04) | 14.86 (±3.83) | >.99 |
| Adductor | 10.92 (±3.52) | 10.20 (±1.93) | >.99 |
| Gracilis | 17.10 (±5.96) | 13.13 (±3.42) | .02 |
In bold, P < .05. Abbreviations: TD, typically developing; XLH, X-linked hypophosphatemia.
The total percentage of intraMAT was not statistically significantly different in XLH and TD children, with values of 12.58% [±4.12] and 10.85% [±1.69], respectively (P = .143). We plotted a range of normality of total intraMAT and the variability of total intraMAT in the XLH children (Fig. 3): Three XLH patients (27%) had values below the range of normality, another 3 (27%) had values within the range of normality, and 5 patients (46%) had values more than 2 SD above the mean.
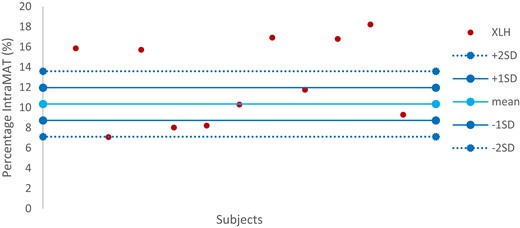
Variability of total intraMAT in XLH children in comparison with the range of normality defined by the TD child group. intraMAT, intramuscular adipose tissue; TD, typically developing; XLH, X-linked hypophosphatemia.
On the other hand, intraMAT percentages were statistically significantly higher in XLH children than in TD children in specific muscles, namely, the gluteus maximus (P = .0056), the femoral biceps (P = .0314), the sartorius (P = .0097), and the gracilis (P = .0242) as shown in Fig. 4.
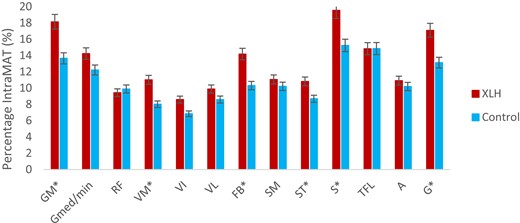
Muscle selectivity of the intraMAT. A, adductor; FB, femoral biceps; G, gracilis; GM, gluteus maximus; Gmed/min, gluteus medius and minimus; intraMAT, intramuscular adipose tissue; RF, rectus femoris; SM, semimembranosus; S, sartorius; ST, semitendinosus; TFL, tensor fasciae latae; VI, vastus intermedius; VL, vastus lateralis; VM, vastus medialis; XLH, X-linked hypophosphatemia.
Table 3 illustrates the selectivity of the intraMAT depending on the CSA of some muscles. In XLH children, for each muscle infiltrated by a substantial amount of fat, the muscle CSA was smaller than that in the TD children group. After normalization by body weight, however, only the gluteus maximus, vastus medialis, and femoral biceps muscles were significantly more infiltrated in XLH children (P < .0001, P = .0011, and P = .0094, respectively).
Intramuscular adipose tissue muscle selectivity as a function of cross-sectional area
| CSA cm² ( ± SD) | CSA/Body weight cm²·kg−1 ( ± SD) | |||||
|---|---|---|---|---|---|---|
| XLH (n = 11) | TD (n = 20) | P | XLH (n = 11) | TD (n = 20) | P | |
| Gluteus maximus | 22.98 (±8.70) | 30.51 (±8.93) | <.0001 | 118 (±37) | 85 (±11) | <.0001 |
| Vastus medialis | 10.55 (±3.85) | 12.87 (±3.92) | <.0001 | 55 (±17) | 36 (±6) | .001 |
| Femoral biceps | 7.79 (±2.81) | 8.91 (±2.26) | <.0001 | 41 (±14) | 25 (±5) | .001 |
| Sartorius | 1.88 (±0.72) | 2.16 (±0.58) | .8216 | 10 (±3) | 6 (±2) | .96 |
| Gracilis | 1.93 (±0.92) | 2.68 (±0.77) | .8019 | 10 (±4) | 8 (±2) | .99 |
Values are presented as mean ( ± SD). In bold, P < .05.
Abbreviations: CSA, cross-sectional area; TD, typically developing; XLH, X-linked hypophosphatemia.
Discussion
To our knowledge, this is the first study to objectively characterize the amount of adipose tissue in the thigh in XLH patients. We show that XLH children have statistically significantly more IMAT and, in certain muscles, more intraMAT than TD children. Higher values of IMAT or intraMAT are nowadays known to be linked to muscle weakness in healthy young adults, age-related muscle loss, and obesity [18, 24, 25, 32]. Our hypothesis that increased IMAT and/or intraMAT percentages may contributed to muscle impairment in XLH patients is therefore supported by our findings.
Muscle Composition in X-linked Hypophosphatemic Children
In this study, we found that XLH children have a significantly higher percentage of IMAT than TD children. The underlying cause of the accumulation of IMAT is not well understood [33, 34]. In XLH children, it might be related to significantly shorter muscle lengths and volumes. Indeed, IMAT is particularly high in populations in whom muscle volume is decreased, such as people with age-related sarcopenia [22, 35] or spinal cord injury [13, 36, 37]. In 2017, Whitney et al [23] quantified muscle volume and adipose tissue volume of the mid-leg in children with mild spastic cerebral palsy compared to TD children. In the paretic population, they observed a smaller muscle volume whereas the IMAT volume was significantly higher. That is, even though the origin of muscle volume decrease is not the same, our findings are similar to other research in which muscle atrophy is observed.
In the case of intraMAT, the difference between the groups did not reach statistical significance, but there was a tendency to a higher total percentage in the XLH children compared to the TD children. In 2015, Akima et al [38] looked at the relationship between intraMAT and muscle CSA in adults and reported that smaller skeletal muscle size could be associated with an accretion of intraMAT. These results are similar to those found by Ryan et al [39] in stroke survivors, in whom atrophy in the paretic thigh was related to fat infiltration of the muscles. The higher intraMAT percentages observed in our study could then be explained by the muscle atrophy found in XLH children. On the other hand, intraMAT showed muscle selectivity, similar to that already observed by Akima et al [38]. Specifically, 4 of the 13 muscles studied showed a significantly greater infiltration in XLH than in TD children. All 13 muscles had individually a shorter length and smaller volume, even after normalization by height and height × weight respectively, and the only variable parameter was the CSA. The 4 muscles with the greatest intraMAT had a smaller muscle CSA even if this did not reach statistical significance for all. Nonetheless, after normalization of the muscle CSA by body weight, only 3 muscles had a significantly lower muscle CSA/body weight ratio in cm²·kg−1. These findings confirmed the muscle selectivity of intraMAT, without identifying the exact mechanism.
Correlation Between Muscle Composition and Muscle Function in X-linked Hypophosphatemic Children
XLH children are known to have muscle weakness, mostly illustrated with an impaired 6-minute walking test [40–42], even if this test has many biases such as preparation, instructions, and encouragement. However, Veilleux et al [7] have objectively reported an alteration in muscle function of the lower leg in XLH population thanks to the mechanography of the jump. Specifically, they observed that both eccentric (multiple 1- and 2-legged hopping) and concentric (heel-rise test, chair-rise test) contractions as well as the stretch-shortening cycle (single 2-legged jump) were affected in XLH children.
The novelty of this study is the possible involvement of IMAT in muscle weakness in XLH children. In 2007, Manini et al [18] found a greater increase in IMAT than loss in muscle volume in healthy adults after 1 month of physical inactivity. Further, they observed that the increase in IMAT accounted for 4% to 6% of the loss of muscle strength and concluded that IMAT contributed to muscle weakness. These observations were confirmed in 2009 by Delmonico et al [32], who found a greater muscle strength decrease than muscle mass loss correlated with an increase in IMAT. These results suggest that the muscle weakness observed in XLH children is not explained solely by the shorter length and smaller volume of their muscles. Even if there was a smaller muscle volume in our XLH children than in the TD children that could partly explain muscle weakness, the total percentage of IMAT in our study was twice as high in the XLH population. We therefore propose that IMAT may be a cause of muscle weakness in XLH children.
IntraMAT may also be involved in muscle weakness in XLH population. As mentioned, Veilleux et al [7] found XLH patients to have significantly lower muscle function. They also found, using peripheral quantitative CT, a significantly lower muscle density than controls, reflecting a higher level of fat infiltration in their lower legs. Their results suggested an implication of the intraMAT in muscle weakness. As noted earlier, the total percentage of intraMAT did not differ significantly between the groups in our study, though values tended to be higher in the XLH children. It is possible that our results differ from those of Veilleux and colleagues [7] and did not reach statistical significance because of the relatively small number of XLH patients in our sample, the anatomic region studied (thigh vs calf), or in particular, the younger age of our population of XLH patients (10.3 [6-17] vs 23.8 [6-60] years), knowing that the intraMAT percentage increases physiologically with age. Notably, the composition of intraMAT itself may be of importance in muscle weakness, intraMAT being the adipose tissue between and within muscle fibers. In 2016, Akima et al [43] reported that only the extramyocellular lipid portion of the intraMAT is visible by MRI, whereas magnetic resonance spectroscopy is needed to measure the intramyocellular lipid (IMCL) portion [44, 45]. Furthermore, animal studies [24, 25] have indicated that it is IMCLs that impact muscle contraction. Our study may be limited by the use of MRI reflecting above all the intraMAT containing extramyocellular lipids; hence, further studies may be necessary to evaluate the link between IMCL and muscle weakness in XLH.
Effect of Increased Adipose Tissue in X-linked Hypophosphatemic Rickets
Today, IMAT and intraMAT are studied in many diseases [46–49]. They have shown to be a metabolic risk factor [13, 15, 23, 39, 50] and are strongly related to insulin resistance [10, 11, 13, 47–50]. We have previously reported that XLH children have a statistically significant risk of being overweight or obese as early as age 5 years [10]. We report here larger amounts of muscular adipose tissue after adjusting for weight and compared to TD children, suggesting that XLH patients may have an elevated metabolic risk very early in life.
Based on the results of our study, we strongly recommend the prevention and monitoring of metabolic syndrome in XLH patients. It may be of interest to seek to decrease both IMAT and intraMAT percentages. In 2007, Prior et al [14] reported that aerobic exercise training and weight loss induced an improvement in glucose tolerance that correlated with a decrease in intraMAT in older men. Further, Goodpaster et al [51] found that physical activity prevents increases in IMAT percentage in older individuals, and this was confirmed in another study by Marcus et al [52], who reported that resistance training decreases IMAT in older adults with metabolic disorders. By analogy, a recommendation of physical activity could be made to XLH children to prevent the accumulation of IMAT and intraMAT, and limit muscle weakness.
Our study has several limits. First, due to the rarity of the disease, the number of patients with XLH included (n = 11) was relatively small with a wide age range (6-17), this limiting the statistical power of the study. In addition, patients with a history of surgery of the lower limbs, although likely the most severely affected, were not eligible for our study and this prevented the analysis of the full spectrum of the disease. Controls were matched for age, but not for other demographic data, particularly BMI. Indeed, XLH rickets is a condition that markedly affects patients’ height and weight; this means we could not recruit TD children age, height, and BMI matched to the children in our XLH cohort. Finally, we are aware that a link between muscle composition and muscle function would be an important insight into the pathophysiology of XLH muscle impairment; this work is in progress.
Conclusion
We propose that a high IMAT percentage contributes to muscle weakness in XLH children independently of their overweight/obesity status. Further explorations of intraMAT are necessary to demonstrate its involvement in muscle weakness in this disease. Since the accumulation of adipose tissue in muscle is associated with adverse metabolic outcomes in many conditions, we recommend preventing or minimizing the accumulation of such tissue by promoting physical activity as early as in childhood in XLH.
Acknowledgments
The authors thank Kyowa Kirin Pharma for its financial contribution to this study.
Financial Support
This work was supported by Kyowa Kirin Pharma.
Disclosures
V.N.K. has received a grant from SOFCOT. A.L. has received grants and fee reimbursement from Kyowa Kirin. W.S. has a patent related to the biplanar imaging system but does not personally receive any financial benefit from it. Royalties from EOS Imaging are paid to the Georges Charpak Human Biomechanics Institute to fund research and education. The other authors have nothing to disclose.
Data Availability
Original data generated and analyzed during this study are included in this published article or in the data repositories listed in “References.”
References
Abbreviations
- BMI
body mass index
- CSA
cross-sectional area
- CT
computed tomography
- IMAT
intermuscular adipose tissue
- intraMAT
intramuscular adipose tissue
- IMCL
intramyocellular lipid
- MRI
magnetic resonance imaging
- TD
typically developing
- XLH
X-linked hypophosphatemia
