


Abstract
Millions of women continue to die during and soon after childbirth, even where the knowledge and resources to avoid this are available. We posit that raising the share of women in parliament can trigger action. Leveraging the timing of gender quota legislation across developing countries, we identify sharp sustained reductions of 7%–12% in maternal mortality. Investigating mechanisms, we find that gender quotas lead to increases in percentage points of 5–8 in skilled birth attendance and 4–8 in prenatal care utilization, alongside a decline in fertility of 6%–7% and an increase in the schooling of young women of about 0.5 years. The results are robust to numerous robustness checks. They suggest a new policy tool for tackling maternal mortality.
A set of Teaching Slides to accompany this article is available online as Supplementary Data.
1. Introduction
Maternal mortality, defined as the death of women within 42 days of childbirth, remains a looming global health problem well into the 21st century. It is estimated to account for 830 deaths per day and more than 216 deaths per 100,000 live births globally (Ceschia and Horton 2016). In sub-Saharan Africa, the maternal mortality ratio (MMR) exceeds the rate in developed countries a century ago (Loudon 1992; Alkema et al. 2016).1 A woman’s lifetime risk of maternal death (the probability that a 15 year old woman will eventually die from a maternal cause) is 1 in 190 today, but there are dramatic variations across the world, the risk being 1 in 5,400 in high income countries and 1 in 45 in low income countries (WHO 2019). Moreover, maternal mortality is only the tip of an iceberg, the mass of which is maternal morbidity (Koblinsky et al. 2012).2 There is no single cause of death and disability for men aged 15–44 that is close in magnitude.
Reducing maternal mortality is of both intrinsic and functional value, as it favorably influences women’s human capital attainment, employment, and growth (Jayachandran and Lleras-Muney 2009; Albanesi and Olivetti 2014, Bloom, Kuhn, and Prettner 2015a; 2016). A broad stream of research has documented the importance of population health for economic growth, via life expectancy and human capital accumulation (Shastry and Weil 2003; Bloom, Canning, and Sevilla 2004; Soares 2005; Weil 2007; Lorentzen, McMillan, and Wacziarg 2008; Ashraf, Lester, and Weil 2009; Aghion, Howitt, and Murtin 2010).
Persistence of high rates of maternal mortality is striking given that the knowledge and technology needed to dramatically reduce it have been available for nearly a century, and the costs of intervention are relatively small (Loudon 1992; Cutler, Deaton, and Lleras-Muney 2006). The causes of maternal mortality are well understood, and have not varied a lot through the course of history. Skilled care before, during, and after childbirth can prevent about three-fourths of maternal deaths ( Hunt and Bueno De Mesquita 2007 WHO 2019;). Rather than obstetricians and gynecologists, this requires relatively low-cost primary care during pregnancy and midwives at delivery (Bhalotra, Rocha, and Soares 2019b; Tikkanen et al. 2020; Lorentzon and Pettersson-Lidbom 2021). In recognition of this, the Millennium Development Goals (MDGs) set in the year 2000, included as a target for 2015 universal access to reproductive health services. Progress was made, but it fell short of this target (Zureick-Brown et al. 2013).
As more than 95% of maternal mortality occurs in developing countries, a natural explanation may be that low income has constrained progress. However, there is a considerable variation in levels and in rates of decline of maternal mortality ratio (MMR) conditional upon income, see, for example, Ritchie (2020). Among low income countries, MMR in Rwanda is three times lower than in Chad despite it being poorer. Among high income countries, the United States has the highest MMR despite its considerable wealth. Bucking the global tide, the US has seen an increase in MMR of about 50% since 2000 (MacDorman et al. 2016; Mann et al. 2018). Although aggregate income displays a positive association with each of female and male life expectancy, it exhibits only a weak relationship with the ratio of female to male life expectancy, a proxy for excess deaths of women associated with reproduction (Online Appendix Figure A1). Overall, it seems that other factors are at play.
We put forward the hypothesis that the paucity of women policy-makers has constrained progress. In particular, we argue that male-dominated parliaments have not sufficiently prioritized maternal mortality reduction. This may reflect both preferences and information constraints. Women leaders may be innately more concerned about MMR because they identify with the risks, or have clearer information on the risks (Powley 2007; Ashraf et al. 2020). The broad stylized facts line up with our hypothesis: Since 1990, MMR has shown an unprecedented fall of 44%, a period in which the share of women in parliament has risen unusually rapidly, from under 10% to more than 20% (Figure 1(a)). We study whether these trends are causally related.
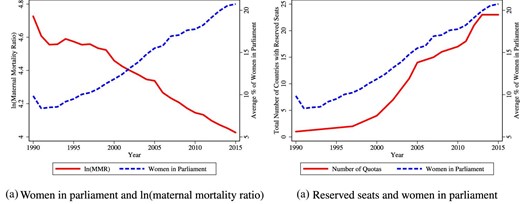
Trends in gender quotas, women in parliament, and maternal mortality. Raw trends in number of countries with parliamentary gender quotas, the percentage of women in parliamentary seats, and the log of the maternal mortality ratio. Data sources are provided in the Data Appendix. The sample is a global sample of 178 countries for which we have annual data through 1990–2015.
To do this, we leverage the abrupt legislation of reserved seat quotas for women in parliament. A wave of quota adoption swept through developing countries, with 22 countries reforming during 1990–2015, the period we analyze. We first demonstrate that quota legislation leads to a sharp increase in the share of parliamentary seats held by women. We then show that quota adoption is associated with an 8%–12% decline in the MMR. The dynamic impacts are persistent, in fact increasing over time, consistent with women who enter parliament after quotas remaining through a 5-year term, and with the efforts of parliamentarians cumulating over time. Quota impacts are increasing in the pre-intervention level of MMR, consistent with the low hanging fruit argument. They are also increasing in the share of seats reserved, and finding this dose–response relationship increases our confidence that we capture impacts of quota adoption rather than a confounder.
We use data on maternal mortality that were recently released by the WHO (Alkema et al. 2016, 2017), merged with data on gender quota legislation, the share of women in parliament, and a host of other data that allow us to analyze mechanisms and confounders. The main analysis relies upon the de Chaisemartin and D’Haultfœuille (2020) estimator, which produces unbiased estimates of dynamic effects when treatment effects are heterogeneous across units or time, avoiding the potential bias arising in conventional difference-in-differences estimates. The identifying assumption is that the country-specific timing of quota adoption is quasi-random. The main threat to identification is that an underlying trend in gender progressivity may have triggered quota legislation and also led to lower MMR, with the quotas having no causal impact on MMR. This would be in line with broader evidence that the timing of legislation is not random but, instead, that legislation is passed when social preferences have evolved to support it (Doepke and Zilibotti 2005; Platteau and Wahhaj 2014).
We probe this and other threats to identification. The placebo coefficients show no evidence of differential pre-trends. We show that the main results hold if we use estimators that make weaker assumptions about parallel trends, including a standard synthetic control approach (Abadie, Diamond, and Hainmueller 2010) and the synthetic difference-in-differences approach (Arkhangelsky et al. 2021) and, following Rambachan and Roth (2020), we estimate bounds on the dynamic effects after relaxing the parallel trends assumption. We further estimate a limited information maximum likelihood (LIML) model in which MMR is regressed on the share of women in parliament, instrumented with quota legislation. Following Conley, Hansen, and Rossi (2012), we estimate bounds on these estimates, allowing that the exclusion restriction is violated, as would be the case if quota adoption had a direct impact on MMR conditional on the share of women in parliament because quota adoption proxies an underlying move toward gender equality. These results show that increasing the share of women in parliament by 1 percentage point generates a drop in MMR of 1.5%–2%. Estimates of Anderson–Rubin confidence sets show that this finding holds even after accounting for the instrument being weak. We demonstrate robustness of the estimates to inclusion of country-specific linear trends and region|$\times$|year fixed effects.
We directly investigate the evolution of a policy environment supportive of gender equality. We find no evidence that quota adoption is preceded by an uptick in any of 18 distinct indicators of women’s economic rights, civil liberties, and property rights. We nevertheless also confirm that our estimates are not sensitive to conditioning upon these indicators. Our findings are not entirely surprising—while the progression of gender equality is likely to eventually culminate in increased attention to women’s reproductive health, this is likely to be a slow process. In contrast, quotas that give women instrumental power to action improvements can produce sharp changes. We demonstrate this, showing that the decline in MMR following quota adoption is mirrored in improved coverage of reproductive health services and movements in other relevant mechanisms.
We show that our results are not driven by democratization, nor by other drivers of quota adoption identified in the political science literature (Krook 2010). To further support identification and affirm the broad generality of our findings, we leverage the quasi-random state-level adoption of gender quotas in local government in India (Iyer et al. 2012), where we identify a significant relationship of broadly similar magnitude.
As the main analysis uses aggregate data, we confirm that our findings are not driven by changes in the composition of women giving birth. To do this, we created a pseudo panel from the full reproductive histories of women available in harmonized microdata including 10,837,442 births of 3,079,298 individual women surveyed in 34 different years in 82 countries, 14 of which implemented quotas. Using three different approaches, we show that our estimates are robust to accounting for uncertainty in the MMR data.
Turning to mechanisms, we identify quota-led improvements in reproductive health services coverage, the key determinant of MMR highlighted in scientific research and promoted by WHO guidelines (Grépin and Klugman 2013; Kruk et al. 2016). We identify increases in coverage of skilled birth attendance of 5–8 percentage points (6%–9.6%), of antenatal care of 4–8 percentage points (4.8%–9.6%) and an increase in contraceptive coverage of 1.7%. However, we find no impact on adoption of abortion legislation (relevant because unsafe abortion is a major cause of MMR (Girum and Wasie 2017; Clarke and Mühlrad 2021)). This is possibly because there are religious barriers to abortion law, which women leaders may not be able to surmount.
We also look at whether an increased presence of women in parliament modified demand side determinants of MMR, including women’s rights, female education, and fertility (Bhalotra and Clarke 2013; Girum and Wasie 2017). We find no discernible impacts of quotas on women’s rights but we identify an increase of 0.5 years in the education of young women and a decline in the total fertility rate of 6%–7%, consistent with the observed expansion of contraceptive coverage and women’s schooling. In addition to being a likely mechanism for the decline in maternal death risk per birth (the definition of MMR), the decline in fertility will have a scale effect, tending to reduce the number of maternal deaths at any level of risk per birth. We estimate that the scale effect leads to an additional decline in the maternal death count that is roughly 64% of the impact of quotas on maternal deaths per birth.3
In view of broader concerns about reducing MMR in low-resource settings, a natural question is whether these results rely upon women parliamentarians raising resources. We find no evidence that gender quotas arrest declines in male reproductive-age mortality, mortality from tuberculosis (which is gender-neutral), or infant mortality—thus no evidence of substitution. We find some evidence of an increase in health spending, albeit this is sensitive to specification. We find no evidence that more resources became available—there is no impact of gender quotas on GDP or international development assistance for maternal health (DAH). We argue that large changes in outcomes are feasible without a large increase in resources, highlighting the low costs of relevant interventions (Dupas 2011; Banke-Thomas et al. 2020), and the slack generated by inefficiency and corruption that a motivated leader can put to use (Folbre 2012; Brollo and Troiano 2016; Baskaran et al. 2018). In Section 7, we cite evidence consistent with leaders being able to move the outcomes they prioritize by building consensus, provoking legislation, and improving policy design and delivery, including better targeting and greater outreach.
Overall, we provide evidence that the political empowerment of women can effect rapid maternal mortality decline. Thus, gender quotas may be a powerful at-scale means of modifying policy priorities in favor of maternal health.
The rest of this paper is organized as follows. In Section 2, we provide a discussion of maternal mortality initiatives and of the implementation of parliamentary gender quotas. Section 3 describes the data, and Section 4 lays out the empirical strategy. We present results in Section 5, robustness checks in Section 6 and analysis of mechanisms in Sections 7 and 8. We conclude in Section 9.
2. The Policy Landscape
Maternal Mortality.
Although women have been dying in and around childbirth since the origin of life, international initiatives to tackle maternal mortality are recent. The Safe Motherhood Conference held in 1987 in Nairobi was the first of a series of international meetings that highlighted the need for global action on maternal mortality. Strategies for achieving this goal included making family planning universally available, providing prenatal care and trained assistance at delivery, and ensuring access to emergency obstetric care (Starrs 2006). Subsequent events calling for action include the World Summit for Children in 1990 and the International Conference on Population and Development in 1994. In September 2000, the United Nations General Assembly adopted the UN Millennium Declaration and articulated the MDGs. MDG 5 called for a three-quarters reduction in MMR between 1990 and 2015. A second target of achieving universal access to reproductive health by 2015 was added in a subsequent reformulation of the MDGs. The Sustainable Development Goals (SDGs) agreed in 2015 set new, more ambitious targets to be achieved by 2030. However, no new policies to hasten progress have been proposed.
Gender Quotas.
In response to growing awareness of women’s rights in civil society, in 1990 the UN Economic and Social Council set a target of 30% female representation in decision making bodies by 1995 (Pande and Ford 2012). The passage of gender quotas followed this and accelerated after the unanimous signing of the Beijing Platform for Action by all UN delegates at the Fourth World Conference on Women in 1995 (Krook 2010; Inter-Parliamentary Union 2015). Since 1990, 22 countries in sub-Saharan Africa, the Middle East, and South and East Asia have implemented constitutionally protected quotas reserving seats in parliament for women, mostly after 1995. We observe an uptick in quotas particularly after year 2000, driven by sub-Saharan Africa.4 The existing evidence on reserved seat quotas is dominated by analysis of the randomized implementation of gender quotas (for headship together with council membership) in local government in India.5 We also provide estimates for the Indian quotas, alongside our analysis of women’s membership of parliament.
The focus of our study is on these reserved seat quotas, but we shall provide a brief analysis of impacts of candidate quotas on women’s share in parliament and MMR. Since 1990, the number of countries with candidate list quotas for women has also risen sharply from 1 to 46.6 Candidate quotas were passed mostly in middle- and higher-income countries (see Online Appendix Figure A2) and have weaker impacts on representation, see, for example, Bagues and Campa (2017).
3. Data and Descriptive Statistics
Maternal Mortality.
Maternal mortality was not consistently measured until recently, imposing an impediment to evidence-based prevention efforts. The MDGs set quantitative targets to be monitored, and this triggered a multi-agency effort to gather data on MMR. In this paper, we use the first harmonized time series estimates of MMR across 183 countries, released in 2015 by the United Nations Maternal Mortality Estimation Inter-Agency Group (MMEIG), covering the period 1990–2015. These estimates combine available data from vital statistics, special inquiries, surveillance sites, population-based household surveys, and census files. They use Bayesian methods to combine these data and fill gaps (Alkema et al. 2016, 2017). We conduct a sensitivity check that allows for this in inference, and we also show results using MMR data derived from the Demographic and Health Surveys (DHS).
Gender Quotas and Women’s Share in Parliament.
We collected information on country-specific adoption of quotas up until 2005 from Dahlerup (2005), and updated these to 2015 using the Global Database of Quotas for Women. The data include the date of legislation and the share of seats reserved for women. We obtained the share of women in parliament from the World Development Indicators (WDI), the UN MDGs Indicators, and the ICPSR dataset compiled by Paxton, Green, and Hughes (2008). Figure 1b shows that aggregate trends in women’s share in parliament track trends in quota coverage.
Other Data.
Data on a range of intermediate outcomes (mechanisms) and controls, including measures of women’s rights or gender equality, political variables, and indicators of reproductive health coverage were compiled from diverse sources (see Online Appendix D), where we also discuss the MMR and micro-fertility data drawn from the DHS, and state-level quota adoption, women in government, and MMR data for India.
Descriptive Statistics.
The analysis sample contains (at most) 178 countries, through 1990–2015. Online Appendix Table A1 provides summary statistics. Online Appendix Figure A3 plots the world distribution of average MMR in the analysis period. The geographic spread of reserved seat quotas is in Online Appendix Figure A2 and the trend in gender quota implementation in Online Appendix Figure A3. Quota size varied across countries and Online Appendix Figure A5 displays the distribution. The median (mean) gender quota is 21% (20%). Casual inspection suggests support for our hypothesis that reserved seat quotas are associated with MMR decline. Comparing country pairs with similar GDP per capita in 1990, selecting one that implemented reserved seat quotas before 2010 and one that did not, we find that the quota-implementing country tends to witness a larger decline in maternal mortality in 1990–2010. Thus, Burundi did better than Malawi, Kenya did better than Zimbabwe, and Niger did better than the Democratic Republic of Congo. A more formal approach is discussed next.
4. Empirical Strategy
The share of women in parliament has increased fairly smoothly (Figure 1a), making it hard to isolate its effects from those of other gradually evolving trends. We therefore leverage the abrupt implementation of quotas. The main results are obtained using the de Chaisemartin and D’Haultfœuille (2020) estimator. However, we also provide the standard event study estimates, the Goodman-Bacon decomposition, bounds following Rambachan and Roth (2020) and estimates based on synthetic controls (Abadie, Diamond, and Hainmueller 2010; Arkhangelsky et al. 2021). We begin by setting out the standard event study model (Jacobson, LaLonde, and Sullivan 1993) that allows us to track outcome trends before and after quota implementation. The estimated equation is
The outcome |$Y_{ct}$| varies at the country c and year t level. The outcomes are initially the proportion of women in parliament (first stage compliance) and the natural logarithm of the maternal mortality ratio. We model a series of additional outcomes including intermediate outcomes (potential mechanisms), placebo outcomes, and potential confounders. |${Quota}_{c}$| is 1 if a country ever adopted a quota, and this is interacted with a full set of leads and lags with respect to the year the quota was adopted. We include 10 lags and leads, the tenth term including all years greater than 10, and the first lead is omitted as the base category. We provide results varying this window down to 5 and 8 years. We include country and year fixed effects (|$\phi _c$| and |$\mu _t$|), and cluster standard errors at the country level (Bertrand, Duflo, and Mullainathan 2004).
Parallel Trends.
The |$\beta ^{ {lag}}$| coefficients capture dynamic impacts and the |$\beta ^{lead}$| coefficients provide a partial test of the identifying assumption of no differential trends. This is only a partial test because, to estimate unbiased parameters, we require parallel trends between treated and non-treated units in the absence of treatment. Parallel pre-trends support this assumption but cannot be used to test what would have happened at the time of the reform had the reform not been implemented (Kahn-Lang and Lang 2018). In view of concerns about the inclusion of unit-specific linear trends (Goodman-Bacon 2019), we use the Rambachan and Roth (2020) “Honest DiD” estimator, which provides bounds on the post-quota coefficients under the scenario that any prevailing (even if imprecisely estimated) trends in the pre-treatment period between quota and non-quota countries are projected forward into the post-quota period (rather than assuming parallel trends going forward). We also use two estimators that make weaker parallel trends assumptions than our main approach. We implement the strategy of generating a synthetic control for each treated country (following Abadie, Diamond, and Hainmueller 2010; Cavallo et al. 2013) by matching on pre-quota trends in maternal mortality, giving preference to countries within the same sub-region of the world (see Online Appendix E). This synthetic control procedure chooses for each treated country its own synthetic control, and then pools pre- and post-treatment differences across countries to generate a single event-style plot. We additionally use the recent synthetic difference-in-differences approach of Arkhangelsky et al. (2021), which allow us to generate a synthetic counterfactual to optimally align pre-treatment trends for each quota year specific adoption group, resulting in a treatment versus synthetic counterfactual comparison for each quota adoption period, as well as an aggregate Average Treatment Effect on the Treated (ATT) estimate.
Staggered Adoption.
A series of recent papers analyze the inference problem when treatment is staggered across units (countries) over time, creating multiple experiments. If there are heterogeneous treatment effects across countries or time, then estimates obtained using the conventional difference-in-differences estimator may be biased. We address this by using using the dynamic estimator of de Chaisemartin and D’Haultfœuille (2020), which provides unbiased estimates. It uses groups whose treatment status is stable to infer the trends that would have affected switchers if their treatment had not changed. Specifically, we report their ‘DID|$_M$|’ estimate, which is based on a series of time-specific aggregated estimates. This estimator considers changes immediately surrounding quota adoption. It can be extended to estimate full dynamic impacts if rather than considering changes between t and |$t-1$|, we consider changes between |$t+k$| and |$t-1$| for |$k=1,2,\ldots ,10$| years post reform, and similarly, placebo estimates can be presented showing changes between pre-reform periods in which quota adopters have not yet been exposed.7 Inference is consistently based on a block bootstrap procedure, resampling over countries. Given the preferred properties of the de Chaisemartin and D’Haultfœuille (2020) estimator in cases with heterogeneous impacts of treatment, we use this estimator as our main specification. Standard event studies described in equation (1) are provided as supplementary results.
Sensitivity to Estimator.
We supplement the dynamic models described above with single coefficient estimates of a two-way fixed effects (TWFE) specification in which the independent variable is defined as one for all years following the implementation of a quota for implementing countries, and zero before. It is set to zero for all countries that do not implement quotas in the sample period. The TWFE specification will tend to estimate an average of treatment effects that over-weights short-run effects and under-weights long-run effects (Borusyak and Jaravel 2017). Since our event study estimates show that treatment effects increase with time since the quota event, in our setting the TWFE model will tend to produce conservative estimates. We provide a formal decomposition of the two-way FE estimator following Goodman-Bacon (2021), quantifying how much identifying variation is drawn from a pure treatment versus control comparison and how much is drawn from variation in treatment timing. We additionally document how this single coefficient estimate compares to pooled coefficients from the event study, the aggregate dynamic estimates from de Chaisemartin and D’Haultfœuille’s “|$DID_M$|” estimator, and estimates using the synthetic difference-in-differences approach of Arkhangelsky et al., which make comparisons in a more “ local” way, giving more weight to control units, which share more similar past trends with treated units, and more weight to time periods, which are more similar to treated periods. Both the “|$DID_M$|” estimator and the synthetic DID estimator are robust to the biases inherent in standard two-way fixed effects models.8
Additional Robustness Checks.
We directly investigate the threat to identification posed by the possibility that quota adoption responds to societal preferences becoming more pro-female, and that it is these underlying shifts in preferences that drive MMR decline. We similarly investigate democratization and a series of predictors of quota adoption discussed in the political science literature. We replicate the results for the staggered adoption across the Indian states of gender quotas in local area councils. This is useful not only because it is another setting but also because, in this case, quota implementation has been shown to have been quasi-random. The main estimates include the many (high and low income) countries that do not pass quotas in the sample period, as this expands the set of good comparisons available to identify trends (Borusyak and Jaravel 2017). In different specification checks, we first drop the 51 (never treated) high income countries from the sample, and then restrict further to African countries, thus making the sample more homogeneous. The baseline estimates control only for country and year fixed effects. We display sensitivity of the estimates to adding a series of controls, |$\boldsymbol {X_{ct}}$|, including country-specific linear trends, region-year fixed effects, education and demographic characteristics of mothers, ethnic fractionalization and potentially endogenous intermediate outcomes including international development assistance for maternal health, GDP, public health expenditure, indicators of women’s rights and gender equality, and political predictors of quota implementation. The potentially endogenous variables are consistently included as the baseline (pre-quota, in fact pre-1995) value of the variable multiplied by an indicator for post-quota years. This allows us to capture their direct impact on maternal mortality, also allowing that this impact changes after quota adoption. We also show results restricting to a balanced panel, and we address uncertainty in the MMR data by removing from the sample all modelled data, adjusting inference for the uncertainty, and by using the DHS to construct comparable survey data measures of MMR.
5. Results
Main Results.
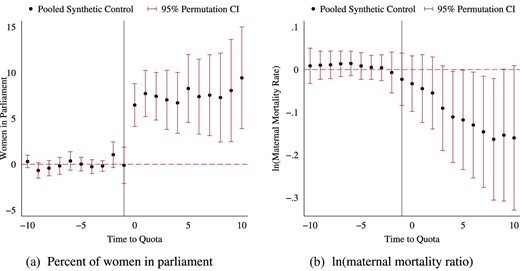
The de Chaisemartin and D’Haultfœuille (2020) estimates are presented in Figure 2. They are obtained by aggregating estimates of outcome changes between adopters and non-adopters, comparing periods surrounding adoption. Panel (a) shows a discrete jump in women’s parliamentary representation in the year after quotas are implemented. Panel (b) similarly shows a break in the coefficient series, with maternal mortality falling more rapidly after quota implementation. Panels (c) and (d) show that the patterns are broadly similar in models with no time-varying controls. The post-quota changes are persistent. Figure 3 shows numerous specification checks, which we elaborate in the next section. The standard event study estimates (Equation 1) are appended as Online Appendix Figure A6 and they too provide broadly similarly estimates.
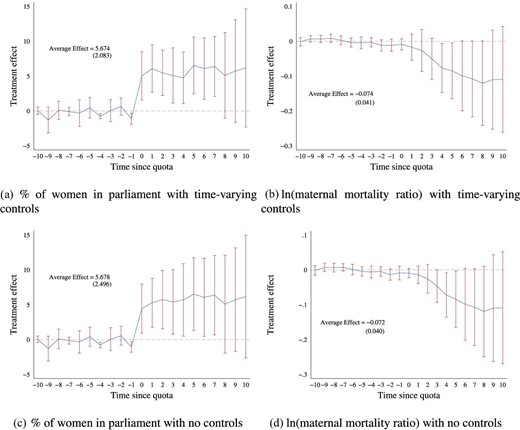
Gender quota impacts: de Chaisemartin and D’Haultfœuille’s |$DID_{M}$| estimator and placebos. Panels (a)–(d) present estimates of the impact of quotas on women in parliament and maternal mortality following de Chaisemartin and D’Haultfœuille (2020). This consists of estimating aggregate impacts comparing all changers with non-changers surrounding the time of reform. Plots present ten placebo estimates comparing switchers and non switchers in pre-reform periods (when switchers had not yet changed), and dynamic effects showing impacts between |$t+k$| and |$t-1$||$\ \forall k\in \lbrace 0,1,\ldots ,10\rbrace$|. Panels (a)–(b) present models controlling for baseline resource and democracy controls interacted with a post quota dummy for women in parliament (panel a) and ln(MMR) (panel b). Panels (c) and (d) present models with no controls. Additional specifications are provided in Figure 3 below. All inference is conducted using a block bootstrap, average effects, and standard errors are estimated by pooling all immediate and dynamic effects.
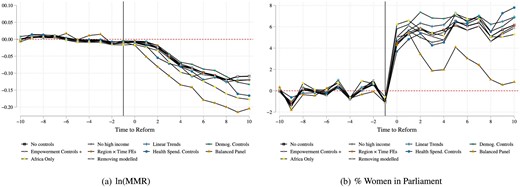
Robustness of de Chaisemartin and D’Haultfœuille (2020) |$DID_M$| estimates to alternative measures and specifications. Alternative plots graph |$DID_M$| estimates surrounding the passage of quota reforms. Coefficients indicated by a hollow black square correspond to baseline de Chaisemartin and D’Haultfœuille (2020) estimates without controls. Alternative specifications are documented as labelled in the graph legend. Balanced panel refers to a sample consisting only of countries, which adopted quotas prior to 2005 and as such exist in the entire range of quota post-treatment lags. “Removing modelled” removes from the sample any countries based only on modelled maternal mortality data. “Empowerment Controls +” controls for 25 variables measuring predictors of quotas indicated by the political science, literature, and measures of empowerment and women’s rights. Controls are consistently specified using a baseline index based on z-scores of each variable (standardized such that higher values capture more positive movements of the underlying measure), interacted with post-quota adoption indicators. Alternative specifications discussed, including point estimated as well as confidence intervals are documented in Online Appendix Figures A51 and A52.
Table 1 demonstrates that our results are not sensitive to the choice of estimator. We show estimates from the two-way fixed effects single coefficient model, the weighted average of the dynamic coefficients from de Chaisemartin and D’Haultfœuille (2020), where the weights are the number of countries contributing to the coefficient for each year, and estimates from the synthetic difference-in-differences model. Following quota adoption, we see an increase in the proportion of women in parliament of 5.7–6.6 percentage points, which relative to the baseline average in 1985–1990 of 9%, represents about a 64% increase. We see a fall in the maternal mortality ratio of 7.2%–12.7%.9
Two-way FE, de Chaisemartin and D’Haultfœuille, pooled event studies, and synthetic DID estimates.
| (1) | (2) | (3) | (4) | (5) | (6) | |
|---|---|---|---|---|---|---|
| Outcome: ln(MMR) | ||||||
| Method A: two-way FE model | ||||||
| Reserved Seats | |$-0.082$| | |$-0.156^{*}$| | |$-0.075$| | |$-0.106^{*}$| | |$-0.071$| | |$-0.246^{*}$| |
| (0.051) | (0.090) | (0.056) | (0.056) | (0.055) | (0.130) | |
| Method B: |$DID\_M$| estimates | ||||||
| Reserved Seats | |$-0.072^{*}$| | |$-0.074^{*}$| | |$-0.072^{*}$| | |$-0.074^{*}$| | |$-0.080^{*}$| | |$-0.082$| |
| (0.043) | (0.043) | (0.043) | (0.043) | (0.047) | (0.050) | |
| Method C: pooled event study | ||||||
| Reserved Seats | |$-0.079^{**}$| | |$-0.154$| | |$-0.076^{*}$| | |$-0.106^{*}$| | |$-0.058$| | |$-0.232$| |
| (0.039) | (0.100) | (0.042) | (0.058) | (0.045) | (0.166) | |
| Method D: synthetic DID | ||||||
| Reserved Seats | |$-0.127^{*}$| | |$-0.116^{*}$| | |$-0.129^{*}$| | |$-0.103$| | |$-0.128$| | |$-0.099$| |
| (0.067) | (0.069) | (0.072) | (0.064) | (0.080) | (0.062) | |
| Negative weights | |$-0.005$| | |$-0.143$| | |$-0.019$| | |$-0.006$| | |$-0.012$| | |$-0.445$| |
| Observations | 4335 | 4241 | 4335 | 4241 | 4335 | 4241 |
| Outcome: women in parliament | ||||||
| Method A: two-way FE model | ||||||
| Reserved seats | |$5.793^{***}$| | 6.333 | |$6.071^{**}$| | |$6.077^{**}$| | |$6.038^{***}$| | 9.207 |
| (2.167) | (4.521) | (2.478) | (2.645) | (2.145) | (6.266) | |
| Method B: |$DID\_M$| estimates | ||||||
| Reserved seats | |$5.678^{**}$| | |$5.674^{***}$| | |$5.678^{**}$| | |$5.674^{***}$| | |$5.167^{**}$| | |$5.128^{***}$| |
| (2.222) | (1.880) | (2.222) | (1.880) | (2.154) | (1.872) | |
| Method C: pooled event study | ||||||
| Reserved seats | |$6.622^{***}$| | 7.179 | |$6.940^{***}$| | |$7.079^{**}$| | |$6.242^{***}$| | 9.668 |
| (1.862) | (5.082) | (2.015) | (3.314) | (1.891) | (8.341) | |
| Method D: synthetic DID | ||||||
| Reserved seats | |$8.281^{***}$| | |$7.523^{***}$| | |$8.361^{**}$| | |$7.950^{**}$| | |$7.661^{***}$| | |$7.014^{**}$| |
| (2.611) | (2.344) | (3.597) | (3.246) | (2.552) | (2.724) | |
| Negative weights | |$-0.005$| | |$-0.143$| | |$-0.019$| | |$-0.006$| | |$-0.012$| | |$-0.445$| |
| Observations | 4335 | 4241 | 4335 | 4241 | 4335 | 4241 |
| Controls (baseline): | ||||||
| Empowerment & Predictors | Y | Y | ||||
| Democracy | Y | Y | ||||
| Resources | Y | Y | ||||
| Region|$\times$|year FE | Y | Y | ||||
Notes: Each cell presents results from a separate individual reduced form estimate varying estimation procedures (in rows) and included controls (in columns). The top panel considers the impact of reserved seats on maternal mortality, while the bottom panel considers the impact of reserved seats on women in parliament. Two-way FE models refers to linear regression controlling for country and year fixed effects. |$DID_M$| refers to pooled estimates based on de Chaisemartin and D’Haultfœuille. Pooled event study estimates impacts pooling all post-event study coefficients (from lag 0 to lag 10+). Synthetic DID implements Arkhangelsky et al. (2021). In each case, standard errors are estimated clustering by country or using a block bootstrap by country. Controls are consistently generated using baseline (pre-1995 measures) interacted with a post-quota dummy. At the base of each panel, we present the magnitude of the negative weights attached to the two-way FE estimate, following de Chaisemartin and D’Haultfœuille (2020). |$^{*} p < 0.10$|; |$^{**} p < 0.05$|; |$^{***} p < 0.01$|.
After quotas are legislated, the share of women in parliament can only change at the next election. For every country, we identified the years between quota legislation and the next election. The mode and median are zero years, the mean is 1.3.10 The event study plot shows a slight jump 5 years after the quota is passed, consistent with the subsequent election presenting a further opportunity to increase the share of women. Once women are in parliament, any changes they make will need to translate to the field and cumulate to have a discernible population-level impact on maternal mortality. Our finding that impacts of quota adoption on MMR increase with time since quota in Figure 2 and Online Appendix Figure A6 are consistent with this. Ten years out, MMR was 13% lower in countries that passed quotas.
The placebo coefficients are tightly centered on zero, showing no prevailing differential trends in MMR prior to quota adoption.11 We show in the next section that the bounds on the dynamic effects on MMR are consistent with our main findings when we relax the pre-trends assumption, and that our estimates hold with the synthetic control and synthetic DiD approaches. We also show that our findings hold in bounded IV estimates that allow that the exclusion restriction is violated and that the instrument is weak. We examine numerous potential predictors of quota adoption and show that they do not trend upward before the event of quota adoption, that they do not predict MMR, and that our estimates are robust to controlling for them.
Heterogeneity in Impact.
Although international conventions suggested a target of 30%, the mandated quota varied across countries (see Online Appendix Figure A5 and Table A2). Leveraging this variation, we find a clear “dose-response” (Online Appendix Figures A9 and A10). This increases our confidence that we identify impacts of quotas rather than an omitted variable, and it is also relevant to policy making. Estimates from the single-coefficient model (Online Appendix Table A3, panel B) indicate that quotas of less than 10% increase the share of women in parliament by 2.8 percentage points, and generate a 0.6% reduction in MMR, while quotas of 20%–30% increase the share of women in parliament by 6.8 percentage points and reduce MMR by 13.4%. Baseline shares of women in parliament varied, as a result of which a given quota size had different impacts on the increase in the share of women in parliament. Baseline rates of MMR also varied considerably and we find larger declines where base rates were higher and there was more room for reduction. Estimates using terciles of baseline MMR are in Online Appendix Figure A10, panel B. We find a 7.7% reduction in MMR in countries with a low baseline rate and a 15.9% reduction in countries with a high baseline rate (Online Appendix Table A3, panel A).12
Effect Sizes.
Our estimates are of a similar order of magnitude to the historical introduction of occupational licensing requirements for U.S. midwives (Anderson et al. 2020), the 10-year impact of Brazil’s Bolsa Familia conditional cash transfer program (Rasella et al. 2021), and the 4-year impact of Brazil’s expansion of community-based primary care (Bhalotra, Rocha, and Soares 2019b). In contrast, our estimates were larger than those from a large-scale program in India providing financial incentives for institutional birth (Janani Suraksha Yojana), which had no impact on maternal mortality (Powell-Jackson, Mazumdar, and Mills 2015), and about 40% as large as the impact of introducing antibiotics to treat high-risk, childbirth-related maternal infections in America in the late 1930s, when MMR was at a similar level to modern day Sub-Saharan Africa (Jayachandran, Lleras-Muney, and Smith 2010).
Our IV estimates indicate that a 1 percentage point increase in women in parliament reduces MMR by 1.5%–2%. The elasticity, corresponding to a 1% increase is 0.11–0.13. We conducted a back of the envelope calculation using our estimates and rates of maternal mortality at the end of our sample period to project forward. We estimate that the adoption of parliamentary gender quotas in all non-adopting countries could reduce rates of maternal mortality in Africa by 7.1%, in Oceania by 1.6%, in Asia by 1.3%, in the Americas by 0.8%, and in Europe by 0.1%.
Candidate List Quotas.
We used a similar approach to investigate impacts of candidate list quotas. These result in significant but smaller increases in women’s share in parliament than reserved seat quotas. This is what we would expect since candidate quotas do not guarantee seats in parliament, also see Pande and Ford (2012), and Bagues and Esteve-Volart (2012). We find no impact on MMR (Online Appendix Figures A12 and A13). This seems plausible both because of their smaller impact on women’s political representation, and because the countries implementing candidate list quotas during the study period (predominantly in Latin America) had achieved dramatic declines in MMR prior to quota implementation. This is backed by our estimates for reserved seat quotas showing quota impacts decreasing in baseline MMR, consistent with diminishing returns to policy intervention.
Sub-National Estimates for India.
Implementation of gender quotas in India was randomized at the village level, creating an opportunity for identification of their impact. However, there are no MMR data at the village level. We leverage the fact that state level legislative reform implementing the village level gender quotas has been shown to be as good as randomly assigned (Iyer et al. 2012). Using the staggered adoption of quotas across India’s states yields the estimates in Online Appendix Figure A14. Although less precise given the more limited variation available, these estimates, which rely on a source of identification that is distinct from our main cross-country analyses, confirm our main finding of quota-led declines in maternal mortality of 14.2% (Online Appendix Table A4). This result is robust to leaving out one state at a time (see Online Appendix Figure A15).
6. Robustness Checks
In this section, we summarize the main robustness checks. In Online Appendix C, we elaborate the checks discussed here and a few additional checks.
Alternative Estimators and Pre-Trends.
If standard tests of pretrends are underpowered, then we might fail to capture the evolution of a relevant unobservable trend. To address this concern, we follow the “Honest DiD” procedure of Rambachan and Roth (2020) and estimate upper and lower bounds on the dynamic effects. For both women in parliament (Figure 4(a)) and MMR (Figure 4(b)) these bounds are informative at 95% or, in some cases in later periods, at 90%.
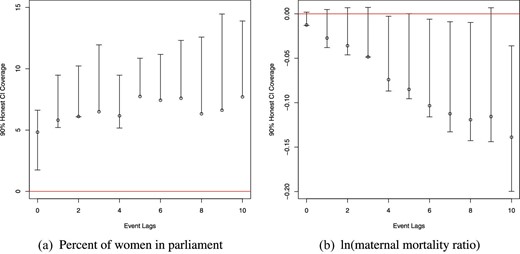
Post-quota coefficients based on “Honest DiD”: women in parliament and maternal mortality. Each post-quota coefficient from event study specification 1 is documented, along with valid inference under Rambachan and Roth (2020)’s “Honest DiD” methods. These correspond to the specifications presented in Online Appendix Figure A6, panels (a) and (b). Here, in place of assuming parallel trends in quota and non-quota countries, valid 95% confidence intervals are constructed under the assumption that post-quota trends in quota countries relative to non-adopters would have followed their prevailing path from the pre-quota period, permitting violations of standard parallel trend assumptions.
Motivated by the concern that countries that do and do not adopt quotas may be different, we generate synthetic controls for each treated country. We aggregate estimates of treatment leads and lags across all treatment–synthetic control pairs, and implement an inference procedure based on clustered permutation to generate confidence intervals for these estimates (see Online Appendix E). The results in Figure 5 show no evidence of differential pre-trends, and a significant post-reform decline in MMR. We also re-estimate the models using the synthetic difference-in-differences procedure of Arkhangelsky et al. (2021) and observe, if anything, slightly larger effects, see panel D, Table 1.
Matched synthetic controls. Refer to notes to Online Appendix E. Coefficients are estimated based on a pooled synthetic control approach where for each quota country a synthetic control is chosen based on leads of the variable of interest (up to period -3), over-weighting units, which come from the same region as the country of interest. Averages of each lag and lead are taken across all treatment–synthetic control matches. Inference is conducted by permutation, where each permutation consists of randomly assigning the same distribution of quota reforms (blocked by countries to ensure identical treatment paths over time) but to non-reforming countries.
Table 1 shows that summary effect sizes from alternative estimators are similar in magnitude. This suggests that, in our setting, the potential bias in the single coefficient two-way FE model discussed in Goodman-Bacon (2021) and de Chaisemartin and D’Haultfœuille (2020) is small. To illuminate this, we provide the Goodman-Bacon (2021) decomposition of the identifying variation into its treatment versus pure control and differential timing components (Online Appendix Table A5). The drop in MMR (of about 7%) is similar when we compare early to late adopters (prior to adoption) to that obtained when comparing aggregate TWFE estimates of treated versus never treated countries, albeit the weight attached to the latter is much greater (panel b). Online Appendix Figure A16 reveals estimates closely clustered around the average effect (indicated by the dashed red line), which suggests that the observed reduction in MMR is observed broadly. This is confirmed in Online Appendix Figures A17–A20, which show leave-one-out estimates.
To complement the reduced form estimates, we estimated LIML regressions of MMR on the share of women in parliament, instrumented with quota implementation. The IV estimates in Online Appendix Table A6 provide the scaled impact of women’s parliamentary representation among compliers. They indicate that a 1 percentage point increase in women’s share in parliament is associated with a 1.5%–2.0% decrease in MMR. If quotas were proxying an omitted variable, then the exclusion restriction would fail, but inference can still proceed on the premise of “plausible exogeneity”, which delivers bounds on the IV estimates (Conley, Hansen, and Rossi 2012). If we allow quota adoption to have a direct impact on MMR of up to -1% over and above its impact on MMR via women in parliament, then the bounds are informative, indicating a 0.01%–3.7% reduction in MMR for a 1 percentage point increase in the women’s share in parliament. We provide weak IV robust Anderson–Rubin confidence sets in Online Appendix Table A6 and plot the implied rejection probabilities for the null across a range of null hypotheses in Online Appendix Figure A21, both of which suggest that the observed relationship between women in parliament and MMR is robust to corrections for weak instruments.
Selection into Gender Quota Legislation.
The multiple approaches to investigating pre-trends discussed in the preceding section allay the key identification concerns. We nevertheless directly investigate the possibility that our results derive from social preferences evolving gradually to favor gender equality, with gender quota legislation being one manifestation of this. To measure social preferences and gender progressiveness in the policy environment, we pulled together data on 18 indicators of gender progressivity in the political, economic, and civil domains including indices of women’s civil liberties, access to justice, economic rights, women’s protests, and the passage of abortion law (see the Data Appendix D). To examine the concern that the timing of quota adoption is a response to an upward drift in women’s position, we use the same empirical strategy as for the main analysis, focusing on whether any of these 18 indicators shows an uptick prior to quota adoption. The estimates are in Online Appendix Figures A22 and A23. The placebo coefficients (de Chaisemartin and D’Haultfœuille) allow us to reject a positive pre-trend for each of the 18 indicators.
These findings are plausible. While the progression of gender equality in society is likely to eventually culminate in increased attention to women’s reproductive health, this is likely to be a slow process. In contrast, we discover that giving women instrumental power to directly influence policy can effect sharp change. We will pursue evidence of this in the section on mechanisms, where we use the same identification strategy to test for impacts of discontinuous changes in women’s political power on a series of intermediate outcomes that (a) can be influenced by policy, and (b) are known to bring MMR down.
To investigate whether the estimated impacts of quota adoption might instead reflect political changes (Baines and Rubio-Marin 2005; Krook 2010), we follow the same approach as for women’s rights, finding no pre-trend in seven measures of the political environment (see Online Appendix Figure A24).
Although we find limited evidence that the 25 potential predictors, including women’s rights and political variables, predict either quota adoption or MMR, we control in the main analysis for an index of the baseline (pre-quota, 1995) value of the indicators interacted with a dummy for post-quota years. The estimated impact of quotas on MMR is not statistically different from the baseline estimate, see Figure 3, as well as full dynamic estimates with inference in Online Appendix Figures A25 and A26. We also tested a series of placebo trend breaks before the true date of quota legislation in each country, and find no evidence of a pre-legislation break in trend in MMR (Online Appendix Table A7).
Endogenous Changes in the Composition of Women Giving Birth.
If gender quotas lead to a shift in the composition of births such that women with lower baseline risks of maternal death are over-represented after quotas, then this could explain our finding of lower MMR. A compositional shift is not implausible given that we find an impact of quotas on fertility (Section 7). We cannot investigate compositional change using aggregate country-year data on fertility, we need information on mother characteristics. To achieve this, we created a psuedo panel of births in the DHS data based on 10,837,442 births for 3,079,298 individual women from 82 countries surveyed in a total of 34 different years. We model quota impacts on birth rates of women of different education and age categories, and on the sex ratio (male/female) of births, a proxy for fetal, and hence maternal health (Waldron 1983; Low 2000). We find no significant shifts in composition by any of these measures (see Online Appendix Figures A27–A30). Our estimates are robust to controlling for time-varying measures of the age and educational composition of mothers (see Figure 3 and Online Appendix Figure A34d).
Measurement of Maternal Mortality.
MMR varies considerably across countries, and proportional changes will exaggerate achievements in countries with lower baseline rates (Deaton 2006). We find that the results hold when we replace the logarithm with the level of the MMR ratio (see Online Appendix Table A3). The United Nations MMR data derive from vital statistics and demographic survey data, with gaps filled using modelled predictions (Wilmoth et al. 2012; World Health Organization 2015; Alkema et al. 2017, 2016). About 76% of the country-year observations are original survey data points, and 24% are imputed. Figure 3 shows that removing countries for which all observations are imputed has no substantive impact on the findings. We directly account for this uncertainty, using a double-bootstrap procedure re-sampling over the provided uncertainty intervals to calculate the standard errors (see Online Appendix Table A8). Allowing for correlation within country reduces the estimated uncertainty. For the de Chaisemartin and D’Haultfœuille (2020) DID|$_M$| estimator and synthetic DID, with a triangular resampling procedure, the main estimates are upheld. We also use a measure of MMR, which we derive from survey-based reports of sister deaths of DHS respondents, following the procedure detailed in Bhalotra and Clarke (2019), albeit for fewer countries. (See Online Appendix Figures A31 and A32). While less precisely estimated, the effects are larger, consistent with the DHS countries having higher MMR on average.
We considered whether the availability and quality of MMR data is endogenous. If women parliamentarians, motivated by a concern to reduce MMR, improve surveillance and tracking of MMR (“we measure what we treasure”), then this will render our estimates conservative. However, this could go the other way if women politicians face more scrutiny of MMR and they react by pulling back on counting maternal deaths. Alternatively, if women politicians act to reduce the variance of (mean zero) measurement error in MMR, then this could make finding significant effects more likely. We acknowledge this problem without directly addressing it, but the fact that we identify mechanisms consistent with actual reductions in MMR suggests that our findings are less likely to be driven by changes in MMR measurement.
Sensitivity to Sample and Clustering.
To assess sensitivity to changes in the composition of countries in the panel, we dropped the seven countries that passed quotas after 2005 to create a balanced sample with the baseline window of 10 years pre and post-quota. The estimates are unchanged (Figure 3). For some of the mechanisms variables analyzed in the next section, the data are relatively sparse. We therefore re-estimate the main results on the common sample (see Online Appendix Figure A33). The results are less precise in this smaller sample but the broad patterns remain. To address the potential concern that quota implementation was temporally correlated, we estimate event studies with two-way clustering (Cameron, Gelbach, and Miller 2011) of standard errors by both country and by year (see Online Appendix Figures A34 and A35). While the confidence intervals are now wider, we still observe statistically significant effects.
7. Mechanisms
Reproductive Health Coverage.
We investigate whether gender quotas influence the reproductive health services that have become conventional wisdom for policy (Jamison et al. 2013; WHO 2014), based on scientific consensus on their relevance to MMR reduction. Antenatal care is critical to identifying life threatening conditions such as pre-eclampsia and eclampsia early on, and having births attended by a skilled professional can reduce mortality from uterine bleeding and post-partum infection (Jamison et al. 2013; WHO 2014). Contraceptive coverage may reduce fertility, and high fertility is a proximate cause of MMR (Girum and Wasie 2017). Contraceptive coverage can also lower MMR without changing fertility by lengthening birth spacing or by substituting unsafe abortion (Miller and Valente 2016).
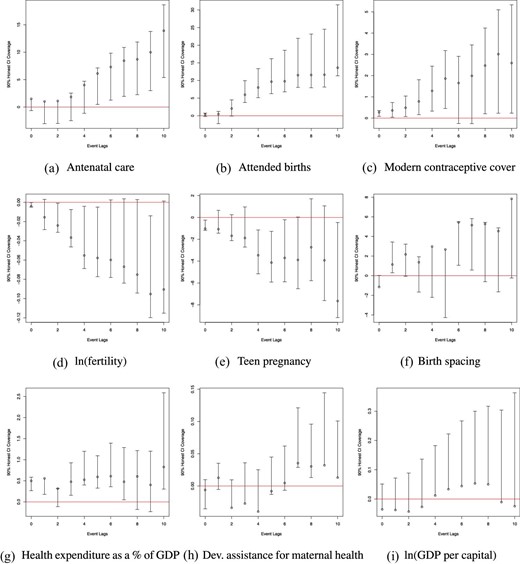
Figure 6 panels (a)–(c) shows increased rates of coverage along these three dimensions of reproductive health in the years following quotas (and this also holds in the standard event study, see Online Appendix Figure A36). The single coefficient models (Online Appendix Table A9) show statistically significant increases in the share of coverage (in percentage points) of 5.8 in skilled birth attendance, 4.7 in prenatal care, and (less precise estimates) of 1.7 in modern contraceptive use.13 Univariate descriptive associations of MMR with reproductive health coverage indicators on our analysis sample are in Online Appendix Table A10. A 1 percentage point increase in the share of attended births, prenatal care, and access to contraception, respectively, is associated with declines in MMR of 4.4%, 4.0%, and 6.3%, magnitudes that make the identified impacts on MMR plausible.
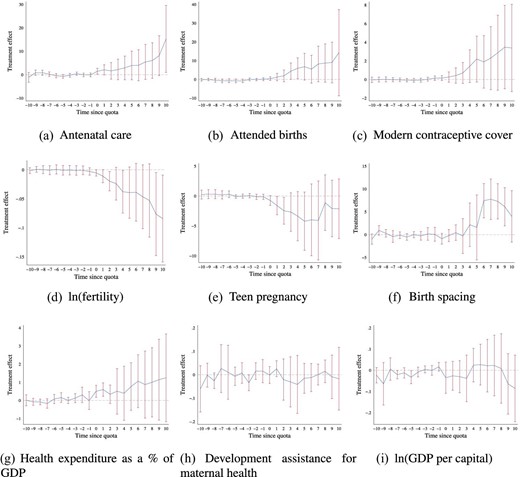
Mechanisms: de Chaisemartin and D’Haultfœuille estimates for impacts of gender quotas on intermediate outcomes. de Chaisemartin and D’Haultfœuille (2020) |$DID_M$| estimates of intermediate outcomes as a function of the passage of gender quotas are presented. Antenatal coverage and birth attendance refer to the percentage of coverage, are accessed from the World Bank databank, and are only available for a sub-sample of years for each country (an unbalanced panel from 1990 to 2015). Fertility rates refer to the expected births per women (the total fertility rate) and are recorded as World Bank databank indicator SP.DYN.TFRT.IN. Birth spacing is calculated as the average time to subsequent births for all women giving birth in a country and year based on DHS fertility rosters. Health expenditure is expressed as a percent of GDP, and is accessed from the World Health Organization’s National Health Accounts (NHA) data series. Proportion of development assistance for health that goes toward maternal health is provided by the Institute for Health Metrics and Evaluation (IHME) Development Assistance for Health Database. The log of GDP per capita is PPP adjusted and measured in 2011 international dollars. All other details follow those of estimates presented in Figure 2.
Abortion legislation, Women’s Rights, and Women’s Economic Participation.
We investigate whether political power for women led to pro-female legislation being enacted, or to women being more likely to join the labor force. We find no evidence that quotas result in improvements in women’s rights or economic participation—so these are unlikely to be relevant mechanisms. The only outcome of the 18 we consider that responds to gender quotas is the political participation of women. This evidence is gathered from analysis of the indices of gender-related progressivity in Online Appendix Figures A22 and A23. Specification checks based on standard event studies and Rambachan and Roth (2020) are provided as Online Appendix Figures A37, A38, A39, and A40. We also reproduce these figures conditioning upon country-specific linear trends (see Online Appendix Figures A41–A43).14 In the discussion of identification, we pointed to the placebo coefficients of these estimates, and now we focus on the dynamic post-quota coefficients. One of the outcomes we investigate that merits particular attention is legalization of abortion, which directly related to women’s reproductive health because barriers to safe abortion lead to unsafe abortion, a major cause of MMR (Girum and Wasie 2017). Using data from Elías et al. (2017), we find no impact of quotas on abortion legislation (see Online Appendix Figures A23 and A38). A possible reason is that there are strong religious barriers to abortion law, which women leaders may not be able to surmount.
Education and Fertility.
We investigated whether an increased presence of women in parliament modified female education and fertility, among demand side determinants of MMR. Bhalotra and Clarke (2013) provide quasi-experimental evidence that expanding female education brings MMR down, and many studies document a positive association of fertility with MMR (Girum and Wasie 2017). We find an increase of 0.5 years in the education of young women and a decline in the total fertility rate of 6%–7%, consistent with the observed expansion of contraceptive coverage and women’s schooling.15
On education, we study girls and boys aged 15–19 at the time of the reform, finding that attainment increases significantly more for girls than for boys (Figure 8 and Online Appendix Table A11). This result is in line with evidence from India that quotas for women in local government led to an increase in girl’s schooling, the suggested channel being an increase in female aspirations (Beaman et al. 2009). The decline in fertility is accompanied by an (noisy) increase in birth spacing of 2 months (modelled using the DHS microdata), see Figure 6, consistent with the documented expansion of contraceptive coverage.
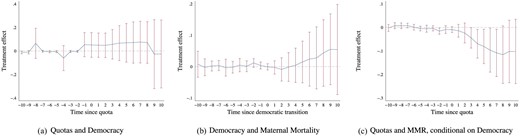
Quotas, Democratic Transitions, and Maternal Mortality Declines—DID|$_M$| Estimates. Here, we consider the potential role of democratization in observed impacts of quota adoption on maternal mortality. The Left-hand panel estimates the impact of quota adoption on whether or not a country is classified as a democracy. The Center panel estimates the impact of transition to a democracy (rather than quota adoption) on rates of maternal mortality. The Right-hand panel reports the impacts of quota adoption on maternal mortality when additionally including as controls full lags and leads to the adoption of democracy in cases, where countries are classified as moving from non-democratic to democratic. All other estimation details follow those in Figure 2.
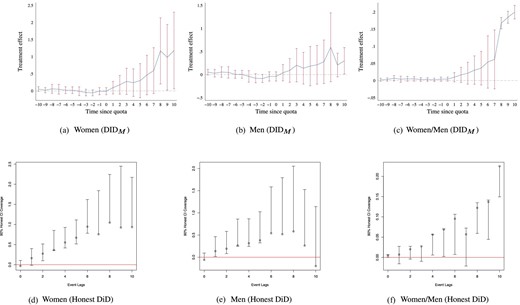
Gender quotas and schooling (15–19 year-olds). Impacts of reserved seat quotas on female education, male education, and the ratio of female to male education are presented. Panels (a)–(c) present estimates using de Chaisemartin and D’Haultfœuille’s |$DID_M$| estimator, and panels (d)–(f) present estimates based on Rambachan and Roth’s Honest DiD estimator. Education measures the average years of schooling for 15–19 year-olds.
Fertility—Parity and Scale Effects.
Since high fertility, defined as the number of children per woman, is associated with higher MMR risk per birth, a decline in fertility is a plausible mechanism for the observed decline in maternal death risk per birth (MMR). In addition, a decline in fertility will have a scale effect, tending to reduce the number of maternal deaths at any level of risk per birth. Online Appendix Table A12 provides a back-of-the-envelope calculation of the number of maternal deaths averted on account of the impact of quotas on (a) MMR or risk per birth, and (b) TFR or the number of births.16 Our estimates are that from the baseline of 92,928 total deaths per year, post-quota deaths would fall to 84,843 (a fall of 8,085 deaths) if only considering the MMR (per birth) channel, to 87,259 if only considering the scale effect of fertility (a fall of 5,669 deaths), and to 79,668 (a fall of 13,260 deaths) if considering the total effect of gender quotas on the maternal death count, as mediated by both fertility and MMR decline. The scale effect (that is not captured in MMR decline) is roughly 43% of the total change in the death count, and 64% of the decline in deaths captured by MMR.
Political Change.
Earlier, we discussed political factors as potential predictors of quota legislation, focusing in Online Appendix Figure A24 on the placebo coefficients. We now study dynamic effects of quotas on the same range of political outcomes. We see that quota adoption is associated with a significant increase in the years that a regime is in power, and a corresponding decline in the probability of regime transition. In other words, after gender quota adoption, there is greater political stability, consistent with both being associated with constitutional reform.17 What is relevant for interpretation of our results is that our results hold conditional upon controls for regime stability.
We also investigated democratization, defined as in Boix, Miller, and Rosato (2013). This is related to regime transition and is empirically relevant as developing countries (which dominate in quota adoption) often transition in and out of democracy. The preferred de Chaisemartin and D’Haultfœuille (2020) DID|$_M$| results are in Figure 7 and event studies are provided in Online Appendix Figure A44. There is no evident tendency for quota adoption to increase democratization, or for democratization to lower MMR, albeit democratization has been shown to lead to lower infant mortality (Kudamatsu 2012). The main estimates control for pre-quota democratization interacted with a post-quota trend, see Table 1, and Figure 2(a) and (b). We perform a stricter test, controlling for a full set of lags and leads to democratic transitions. Our estimate of impacts of quotas on MMR is robust to this (see Figure 7 and Online Appendix Figure A44).
8. Resources
In this section, we first address the substantive question of whether increasing the share of women in parliament benefits population health in general, or MMR in particular. This is related to the question of how any improvements are resourced. We therefore investigate if gender quota adoption is associated with increased resources, overall, and for health. We close the section with reference to existing studies, primarily single-country studies, with a view to illuminating how gender quotas can result in MMR reduction without a large increase in resources.
Other Population Health Outcomes.
In view of previous evidence that women leaders prioritize health (Miller 2008; Bhalotra and Clots-Figueras 2014; Bhalotra, Fernandez-Sierra, and Slapin 2019a), we investigate whether gender quotas led to generalized improvements in population health or possibly detrimental impacts on other health outcomes, as would be the case if the observed improvements in MMR were achieved by allocating resources away from other population health priorities. To assess this we investigated adult male (and female) mortality, mortality from TB,18 and infant mortality, which is widely regarded as a marker of population health in infectious disease environments such as those, which characterize developing countries. DID|$_M$| and event study plots are in Online Appendix Figures A45 and A46 and the TWFE coefficients in Online Appendix Table A11, columns 4–9.
Mortality among adult males, tuberculosis, and infant mortality show no significant change following gender quota adoption, with quite tightly estimated zeros until at least 5 years post-quota. There is some evidence of adult female mortality declining, but this is not statistically significant. This does not surprise us because any policies targeting causes of adult mortality among women other than MMR (TB, accidents, etc.) are not easily targeted to women. The reason that MMR is a conceptually clean outcome to study is that reproductive health services that address maternal mortality are by definition targeted at women. Overall, the evidence points to (a) no deterioration in the other population health outcomes studied, and thus no evidence of substitution, and (b) gender quotas being more effective at improving women’s reproductive health and survival than in addressing other population health indicators. We suggest that both priorities and the potential to target women can explain why gender quotas have their largest impact on MMR.
Resources and Resource Allocation.
We examine whether quota adoption led to an increase in available resources (Figure 6), which would constitute economic mechanisms. We find no evidence of an increase in GDP or in international DAH. We looked at DAH as this was increased after the year 2000 in response to MMR being included in the MDGs (Dieleman et al. 2016). It is of some interest to analyze the estimated coefficient on GDP. There is no impact of GDP on the share of women in parliament, but GDP has a significant direct impact on MMR. A 1% increase in current GDP is associated with a decline in MMR of around 0.33% (Online Appendix Table A13). A very crude back-of-the-envelope calculation assuming log-linearity (conditional on country and year FEs) suggests that to achieve the roughly 10% reduction in MMR that we estimate as flowing from quota adoption, GDP would have to increase by nearly 30%. This illustrates the force of women’s political power.
We tested for increases in state health expenditure. When this is measured as a share of GDP, the estimates are imprecise, see Online Appendix Figure 6g for the de Chaisemartin and D’Haultfœuille estimates, and the standard event study plot in Online Appendix Figure A36g, also see Online Appendix Figures A47, which fills in missing data. Alternative estimates normalizing on population rather than GDP (Online Appendix Figure A48) show a significant increase (panels g, h). The single coefficient model indicates an increase of 0.89 percentage points or about 14% following quota implementation (Online Appendix Table A19, column 7). As there is some weak evidence of pre-trends in the figures, we account for this by producing “Honest DiD” bounds (Online Appendix Figure 9g) and now we see that the bounds are positive, with a lower bound of about 0.7 percentage points. Overall, there is some evidence of an increase in state health expenditure. However, our estimates are robust to controlling for GDP, DAH, and health spending, see Figure 3 and the corresponding DID|$_M$| and event study plots in Online Appendix Figures A34, A35, A51, and A52. Thus, MMR reduction does not rely upon increasing public expenditure.
Mechanisms: post-quota coefficients based on “Honest DiD”. Each post-quota coefficient from event study 1 is documented, along with valid inference under Rambachan and Roth (2020)’s “Honest DiD” methods. Here, in place of assuming parallel trends in quota and non-quota countries, valid 95% confidence intervals are constructed under the assumption that post-quota trends in quota countries relative to non-adopters would have followed their prevailing path from the pre-quota period, permitting violations of standard parallel trend assumptions.
Evidence on Mechanisms from Previous Research.
In this section, we refer to a broader literature, which illustrates the mechanisms by which leaders are able to move the outcomes they prioritize. These include legislation, advocacy, parliamentary (or council committee) debate, building consensus, information campaigns, role model effects (that raise the aspirations of younger women), committing resources to areas they prioritize, targeting existing resources, and improving coordination, management, and efficiency of public service delivery (e.g. by setting targets for civil servants). Women may act differently from men in these matters because they have different preferences, different information sets, are less corrupt, or have greater intrinsic motivation. This is potentially reinforced by women citizens feeling more able to raise their concerns with women representatives and raising their aspirations when exposed to female leaders.
On women changing the debate, recent analysis of text data illuminates the differentiated political preferences of women and the fact that they bring to parliament (or local council meetings), the issues that they care about (Clayton, Josefsson, and Wang 2017; Baskaran and Hessami 2019; Bhalotra, Fernandez-Sierra, and Slapin 2019a; Lippmann 2020). Women in India’s state legislatures have been shown to influence pro-female legislation (Clots-Figueras 2012). Gender quotas in India have been associated with women citizens being more likely to be heard (Iyer et al. 2012; Parthasarathy, Rao, and Palaniswamy 2019). Using US data, Gagliarducci and Paserman (2016) show that women are better at consensus-building, which is relevant if they want not only to generate debate but to achieve policy action. Building consensus for action on maternal mortality is likely to be harder than for action on child mortality. For example, one area where there is agreement between Republicans and Democrats in the US is early childhood investment.
There is some evidence that women bring resources to domains they prioritize, in particular, to health (Miller 2008; Bhalotra and Clots-Figueras 2014). However, resources may not be key for four reasons. First, policy action on the margins we identify in our analysis of mechanisms (namely, expanding the cadre of skilled prenatal and birth attendants and educating young women) is relatively low-cost because wages of the relevant personnel are low in developing countries. In particular, midwives, nurses, and teachers can make a large difference to these outcomes—see Banke-Thomas et al. (2020) on costs of extending prenatal care, and Andrabi et al. (2020) on costs of extending schooling. Second, there is considerable scope to improve public services by limiting leakage of public funds on account of corruption. Women politicians in Brazil and India have been shown to be less corrupt than men, and less likely to distort policy to achieve electoral gains (Brollo and Troiano 2016; Baskaran et al. 2018). Third, there is evidence of substantial slack that good resource management can transform into productivity (Bloom et al. 2014, 2015b), including in the public health domain (Propper and Van Reenen 2010). In developing countries, public services including health services have been shown to suffer high rates of staff absenteeism (World Bank 2003; Chaudhury et al. 2006; Das and Hammer 2014). Correcting this sort of inefficiency does not require material resources as much as motivated governance. Women in politics appear to be more intrinsically motivated. If women have more information on MMR (Ashraf et al. 2020), then they may also be better able to target resources. Fourth, our measures of reproductive health coverage are not purely supply-side measures, they also reflect uptake. Previous work suggests that low-cost outreach, information provision, and education of women can improve uptake (Currie and Moretti 2003; Miller 2008; Beaman et al. 2009; Dupas 2011; Bhalotra and Clots-Figueras 2014; Bhalotra, Fernandez-Sierra, and Slapin 2019a).
9. Conclusion
Using longitudinal cross-country data across a period of 25 years that encompasses periods of dramatic but uneven decline in maternal mortality (and additionally using cross-state longitudinal variation within India), we provide new evidence that gender quotas that raise the share of women in parliament lead to substantial declines in maternal mortality. Current international strategy to address MMR is focused upon extending reproductive health coverage, but there is no recognition among policy makers of the political economy constraints on achieving this. We provide the first systematic analysis of the impacts of the recent wave of implementation of gender quotas across countries.19 Our findings suggest that gender quotas can be an effective policy tool for maternal mortality reduction.
Despite a wave of gender quota implementation, 130 countries in the world have none. There is thus substantial room for maneuver. While significant progress has been made, especially since 2000, preventable maternal mortality remains high, the lifetime risk of maternal mortality being 1 in 45 among women in low income countries. Our findings have implications for the recently launched Global Health 2035 report, and the ambitious SDGs. We show that SDG 3.1 targeting maternal mortality reduction is complementary to SDG 5.5 targeting an increase in women’s political representation.
The broader evidence on the success of quotas is mixed (Coate and Loury 1993; Pande and Ford 2012; Niederle 2016; Besley et al. 2017; Van der Windt et al. 2018). However, our findings cohere with previous evidence that increasing the share of women politicians influences policy choices in favor of policies that align with the preferences of women (Taylor-Robinson and Heath 2003; Chattopadhyay and Duflo 2004; Swers 2005; Clots-Figueras 2012; Baskaran and Hessami 2019). It also resonates with research showing that women politicians are more likely than men to invest in public health (Miller 2008; Bhalotra and Clots-Figueras 2014), and that women voters prioritize public health while male voters prioritize low taxes (Campbell 2004). In contrast to most public health outcomes, maternal mortality is unique to women and thus easy to overlook in a male-dominated parliament, but naturally targeted toward or “assignable” to women.
The overall decline in MMR of 8%–12% that we identify as flowing from quota implementation compares favorably with the 44% global decline in MMR that occurred over the 25-year period, averaged over countries that did and did not implement quotas. Similarly, the 5–8 percentage point increase in birth attendance, the 4–8 percentage point increase in prenatal care, and the 1.7 percentage point increase in modern contraceptive use that we demonstrate flow from quota passage compare well with the 12, 13, and 9 percentage point increases (respectively) achieved through the recent 25 years. The decline in MMR of 44% since 1990 fell well short of the MDG target decline of 75% (Hogan et al. 2010; Kassebaum et al. 2014), and yet the new SDGs have set a higher target (of less than 70 per 100,000 live births by 2030). This is a clear flag that some policy innovation is needed—and we suggest gender quotas.
Acknowledgments
Bhalotra: Department of Economics, University of Warwick, United Kingdom, CEPR, IFS, AcSS, IZA, IEA, CAGE, and MiSOC; Clarke: Department of Economics, Universidad de Chile, Chile, MIPP, and IZA; Gomes: IRES/LIDAM, UCLouvain, Louvain-la-Neuve, Belgium, and CEPR; Venkataramani: University of Pennsylvania and NBER. We acknowledge support of UNU-WIDER in Helsinki who commissioned an earlier version of this paper in connection with the 17th Nordic Conference on Development Economics. We are grateful to James Fenske, Alessandro Tarozzi, Mark Pauly, Dean Yang, the editor Paola Giuliano, and anonymous referees for comments. Replication materials are available at https://doi.org/10.7910/DVN/INLWUH. Bhalotra acknowledges partial support for her time from CAGE and the Department in Warwick and from ESRC grant ESM010236-1 awarded to the Human Rights, Big Data, and Technology project at the Human Rights Centre in Essex. Clarke acknowledges support from FONDECYT Chile grant 1200634, and from the Institute for Research in Market Imperfections and Public Policy, MIPP.
Notes
The editor in charge of this paper was Paola Giuliano.
Footnotes
MMR is defined as maternal deaths per 100,000 live births. In sub-Saharan Africa in 2015, it was 547; in the US in 1936, it was 555.
For every woman who dies from obstetric complications, approximately 30 more suffer injuries, infection, and disabilities (Hunt and Bueno De Mesquita 2007). In 1999, for example, the World Health Organization (WHO) estimated that over 2 million women living in developing countries remain untreated for obstetric fistula, a devastating injury of childbirth. Of the 6 million missing women each year, 21% are in their reproductive years (Wong 2012).
Our back-of-the-envelope calculations suggest that more than 8,000 maternal deaths a year were averted by quotas lowering maternal deaths per birth, and an additional 5,669 maternal deaths a year were averted on account of the impact of quotas on the number of births.
The countries implementing quotas are: Afghanistan, Algeria, Bangladesh, Burundi, China, Djibouti, Eritrea, Haiti, Iraq, Jordan, Kenya, Morocco, Niger, Pakistan, Rwanda, Saudi Arabia, South Sudan, Sudan, Swaziland, Tanzania, Uganda, and Zimbabwe. Uganda is the only country, which reserved seats before 1990, in 1989. Four other countries: Samoa, Kosovo, Somalia, and Taiwan have implemented quotas during 1990–2015, but are left out due to data restrictions. Three other countries implemented quotas more recently and fall outside our study period: Nepal in 2016, UAE in 2019, and Egypt in 2020.
In their pioneering study, Chattopadhyay and Duflo (2004) showed that women leaders were responsive to the needs of women citizens, as expressed in council meetings. Direct observation of council meeting minutes confirms this level of interaction (Parthasarathy, Rao, and Palaniswamy 2019), also see Iyer et al. (2012).
Candidate quotas set a minimum for the share of women on candidate lists, either as a legal requirement or a measure written into the statutes of individual political parties.
Nevertheless, the two-way fixed effects model provides a useful summary statistic. It is also helpful in assessing results for some intermediate outcomes (mechanisms) for which the data are relatively sparse, and when we use the Rambachan and Roth (2020) and IV estimators to compute bounds.
The median (mean) gender quota is 21% (20%). The estimated impacts of quotas on the proportion of women in parliament are smaller than the entire size of quotas. In quota implementing countries, the pre-quota share of women in parliament was not always zero, the average was 7.9%, rising to 20.9% post-quota (median: 6.2 and 21.0%). Taking all countries, the mean was 14.1%, median 11.5% (see Online Appendix Figures A7a and A7b for full distributions). See Online Appendix Figure A8 for temporal variation by country. In Rwanda, we see a jump in line with quota legislation but from a high baseline, while Djibouti shows a sharp jump from zero to quota attainment. The event studies of course show the unrestricted dynamic coefficients. We also show a series of estimates leaving out one country at a time.
In a few cases, it took time from quota passage until fulfillment. In Niger, for instance, the quota was in 2000 but the next election in 2004.
This is also the case when we use the long placebo indicated in de Chaisemartin and D’Haultfoeuille (2022) (see Online Appendix Figure A11).
We examine variation in baseline MMR and quota size jointly in Online Appendix Table A3 panels A and B, respectively, see columns 5 and 8.
In Online Appendix Figure A23, the only outcome of the set we investigate that responds to quota reform is women’s labor market participation, which shows a decline. However, once we condition upon country-specific linear trends there is no impact. The results for the other outcomes are not sensitive to country-specific trends.
Substantively similar results are observed in standard event-study estimates (Online Appendix Figure A36), in “Honest DiD” bounds (Figure 9), and when using a common sample across all mechanism variables (Online Appendix Figure A33, though note that a small number of variables have sparse coverage, so estimation is noisier).
To do this, we use data for the year before the imposition of quotas and sum across all quota countries to get baseline statistics of about 35 million births, and around 93,000 maternal deaths in a year, corresponding to 266 deaths per 100,000 births. We apply the estimated declines of 8.2% in maternal deaths per birth (Table 1) and 6.1% in fertility (Online Appendix Table A19, column 4).
Clayton, Josefsson, and Wang (2017), for instance, argue that quotas are instituted with the intention of ensuring regime stability by bolstering support from women. She writes “In Uganda, the ruling National Resistance Movement party implemented quotas in 1989 as part of a wider strategy to ensure regime stability and strengthen support among various social groups.” Other authoritarian or semi-authoritarian regimes have similarly adopted gender quotas to bolster political support, see, for example, Panday (2008) on Bangladesh; Meena (2004) on Tanzania; and Longman (2006) on Rwanda. In Eswatini, Kenya, and Zimbabwe, quotas were brought about by the adoption of new constitutions, as was also the case in Nepal and Rwanda as they emerged from conflict. Our reading of the evidence, albeit for a few countries, is that violence and political instability create support for stable and inclusive governance and an appetite for constitutional reform.
We chose this as it is high prevalence and gender-neutral. If anything, incidence and death rates from TB are higher among men than women. In 2017, close to 6 million adult men contracted TB and around 8,40,000 died from it. This compares with an estimated 3.2 million adult women who fell ill and almost half a million who died from TB (WHO, September 2018).
See, for instance, the review by Pande and Ford (2012), who discuss the cross-country implementation of quotas, but provide evidence based only on implementation of local government quotas in India.
