


Abstract
For the correct clinical application of the sonographic risk-stratification systems, the definition of independent risk features that are foundational to each system is crucial.
The aim of this study was to identify the gray-scale sonographic features independently associated with malignancy, and to compare different definitions.
This prospective, diagnostic accuracy study took place in a single thyroid nodule referral center. All patients consecutively referred to our center for fine-needle aspiration cytology of a thyroid nodule between November 1, 2015 and March 30, 2020, were enrolled before cytology. Each nodule was examined by 2 experienced clinicians to record the sonographic features on a rating form. Histologic (when available) or cytologic diagnosis was used as the reference standard. For each single sonographic feature and definition, the sensitivity, specificity, positive and negative predictive values, and diagnostic odds ratios (DOR) were calculated. The significant predictors were then included in a multivariable regression model.
The final study cohort consisted of 903 nodules in 852 patients. A total of 76 nodules (8.4%) were malignant. Six features were independent predictors of malignancy: suspicious lymph node (DOR 16.23), extrathyroidal extension (DOR 6.60), irregular or infiltrative margins (DOR 7.13), marked hypoechogenicity (DOR 3.16), solid composition (DOR 3.61), and punctate hyperechoic foci (including microcalcifications and indeterminate foci; DOI 2.69). Taller-than-wide shape was not confirmed as an independent predictor.
We identified the key suspicious features of thyroid nodules and provided a simplified definition of some debated ones. Malignancy rate increases with number of features.
Ultrasonography (US) is the main tool for both the confirmation of suspected thyroid nodules and initial cancer risk stratification. Fine-needle aspiration biopsy (FNAB) decision-making is based on clinical risk factors and US features. Neck US is a convenient examination because is technically easy, does not require any preparation, and can be performed in diverse clinical settings (1). Owing to the superficial location of the gland, high-frequency probes yield excellent image resolution. Recently, professional societies have developed and endorsed US risk stratification systems (RSSs) for thyroid nodules (2-9) with the goal of using a defined set of suspicious imaging characteristics to standardize image description and to risk-stratify nodule sonographic appearance into tiered categories, which then become the basis for FNAB recommendations.
Although the application of these RSSs reduces interobserver and intraobserver variability in nodule classification and FNAB recommendation (10), the systems still generally rely on the recognition of specific individual features. Most of the RSSs share the same features as high suspicion, which are then integrated for nodule classification—irregular margins, solid composition, microcalcifications, and taller-than-wide (TTW) shape. Other features, even if recognized as cancer predictors, are variably incorporated into RSSs, including marked hypoechogenicity, extrathyroidal extension (ETE), and suspicious lymph nodes. Detection of sonographically suspicious lymph nodes is a modifier in the decision-making for biopsy and provides a rationale for FNAB recommendations for subcentimeter nodules.
For the correct clinical application of the RSSs, the definition of independent risk features that are foundational to each system is crucial. Since some features often cluster together, and malignant nodules frequently display many suspicious US characteristics, the aim of this study was to identify in a prospective, single-institution population, the gray-scale US features independently associated with malignancy, and to compare different definitions to allow for a more precise design of future US RSSs.
Materials and Methods
All patients consecutively referred to our center for FNA cytology of a thyroid nodule between November 1, 2015 and March 30, 2020, were eligible for enrollment in this prospective study, which was conducted with ethics committee approval (Sapienza University of Rome Ethics Committee, reference 4233) and written informed consent. A portion of this cohort was previously analyzed for comparison of the diagnostic performance of the 5 US RSSs, evaluation of nodule location and malignancy risk, and refinement of the definition of TTW shape; these results have been previously reported (11-13).
Prior to FNA, each nodule was examined with a HI VISION Avius ultrasound system (Hitachi Medical Corporation Inc) and a 13-MHz linear-array transducer. During this examination, 2 experienced clinicians reviewed the images to record the sonographic features of each biopsied nodule on an internal, computer-based rating form (14). These US features included were diameter (anteroposterior [AP], transverse, and longitudinal); margins (peripheral halo presence, smooth and well-defined, ill-defined, irregular [included margins that were jagged, spiculated, microlobulated, had sharp angles], or infiltrative [with protrusions into the surrounding parenchyma]); composition (solid, cystic, mixed); echogenicity (hyperechoic, isoechoic, mildly hypoechoic—if relative to the thyroid parenchyma—or markedly hypoechoic, ie, less echoic than the adjacent strap muscle); calcifications (microcalcifications, ie, punctate echogenic foci, £ 1 mm, within the solid component of the nodule; macrocalcifications, ie, hyperechoic foci > 1 mm with posterior shadowing); indeterminate hyperechoic foci (punctate hyperechoic foci that could not be definitively classified as microcalcifications, without posterior shadowing or artifacts), and hyperechoic foci with comet-tail artifact. Linear hyperechoic images were not considered as indeterminate foci (Fig. 1). ETE was suspected if the echogenic thyroid border could not be visualized at the nodule interface, with or without images of frank invasion of the surrounding structures (15). Simple contact of a nodule with the thyroid capsule was not considered enough for the definition. The shape was considered TTW when the AP diameter (either in transverse or longitudinal planes) exceeded the transverse diameter. In addition, we also analyzed our recently proposed alternative definition of TTW (13): an AP-to-transverse diameter ratio greater than 1.2, meaning that the nodule is at least 20% TTW. This difference has been reported to reduce the rate of intraobserver and interobserver variability, and has been suggested to be applied both in clinical practice and research (16).
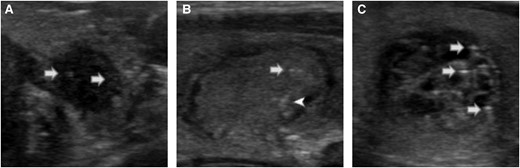
Examples of microcalcifications, indeterminate foci, and comet-tail foci. Punctate hyperechoic foci, less than or equal to 1 mm, within the solid component of the nodule were considered as microcalcifications (A, white arrow). Uncertain punctate hyperechoic foci, with no posterior shadowing or artifacts, in the solid portion of the nodule were considered indeterminate foci (B, white arrow). When the foci were clearly posterior to a cystic area, of triangular shape, or with reverberation artifacts, they were considered as comet-tail foci (white arrowhead, B; white arrows, C).
All operators underwent specific training (10) on feature descriptions to reduce the burden of interobserver variability that is reported for assessments of US features (10, 17).
Reference Standard Diagnosis
Clinicians trained in US-guided thyroid FNAB obtained the cytology samples, which were evaluated by dedicated thyroid cytopathologists and classified according to the criteria published in the Italian Consensus for Thyroid Cytopathology (18, 19). Nodule diagnosis was determined by histologic diagnosis (malignant vs benign) if surgery was performed. However, if the nodule had not been resected, the cytologic diagnosis was used as the reference standard: nodules were considered malignant if classified as TIR4 or TIR5 (suspected malignancy or malignancy, corresponding to Bethesda classes V and VI (20)), and benign if classified as TIR2, corresponding to Bethesda class II. Nodules without histologic diagnoses that had been cytologically classified as TIR1 (nondiagnostic, similar to Bethesda I), TIR3A, or TIR3B (indeterminate, similar to III and IV classes) were excluded from the analysis.
Statistical Analysis
The diagnostic performance of single sonographic features and definition was estimated by calculating their sensitivity, specificity, positive and negative predictive values, and diagnostic odds ratios (DOR), each with 95% CI. The statistically significant predictors were then included in a multivariable regression model. Data were analyzed with the IBM SPSS Statistics package, version 25.0 (IBM Corp).
Results
A total of 1230 thyroid nodules (1145 patients) underwent FNAB; 327 (28.5%) were excluded because of inconclusive diagnosis (nonoperated nodules with nondiagnostic [n = 159] or indeterminate [n = 168] cytology). In our cohort, 46 of the 214 indeterminate nodules (21.5%) underwent surgery (overall malignancy rate: 39.1%). As expected, indeterminate nodules displayed more frequently some suspicious features (eg, solid composition and slightly hypoechogenicity) than benign nodules. The distribution of sonographic risk classes, according to the American College of Radiology (ACR) Thyroid Imaging Reporting and Data System (TIRADS), was different between indeterminate and benign nodules (P < .001; with fewer low-risk TR1 and TR2 classes) and malignant and indeterminate nodules (P < .001; with fewer high-risk TR5 nodules, and fewer intermediate TR3 nodules) (Supplementary Table S1) (21). The final study cohort consisted of 903 nodules in 852 patients (Table 1). A total of 76 nodules (8.4%) were malignant (52 papillary thyroid cancers [PTCs], 9 follicular-variant PTC, 2 follicular thyroid cancers, 2 medullary thyroid cancers, 9 other histologies, and 2 suspicious for PTC during active surveillance); 827 were benign.
Features of the study population
| No. | % | ||
|---|---|---|---|
| Patients | |||
| Sex | Female | 624 | 73.2 |
| Age | y, IQR | 55 | 46-66 |
| Nodules | |||
| Structure | Cystic | 7 | 0.8 |
| Solid | 291 | 32.2 | |
| Mixed | 605 | 67.0 | |
| Echogenicity | Anechoic | 7 | 0.8 |
| Hyperechoic | 8 | 0.9 | |
| Isoechoic | 616 | 68.2 | |
| Hypoechoic | 237 | 26.2 | |
| Markedly hypoechoic | 35 | 3.9 | |
| Margins | Irregular | 142 | 15.7 |
| Infiltrative | 5 | 0.6 | |
| Irregular or infiltrative | 147 | 16.3 | |
| Foci | Indeterminate foci | 189 | 20.9 |
| Microcalcifications | 83 | 9.2 | |
| Macrocalcifications | 126 | 14.0 | |
| Suspicious LN | 15 | 1.7 | |
| Suspicious ETE | 11 | 1.2 | |
| TTW shape | Classic definition | 166 | 18.4 |
| Alternative definition | 54 | 6.0 | |
| ACR TIRADS | TR1 | 29 | 3.2 |
| TR2 | 218 | 24.1 | |
| TR3 | 161 | 17.8 | |
| TR4 | 323 | 35.8 | |
| TR5 | 172 | 19.0 | |
| Cytology | (TIR1) Nondiagnostic Bethesda I: nondiagnostic | 4 | 0.4 |
| (TIR2) Benign Bethesda II: benign | 801 | 88.7 | |
| (TIR3A) Low-risk indeterminate Bethesda III: atypia of undetermined significance or follicular lesions of undetermined significance | 12 | 1.3 | |
| (TIR3B) High-risk indeterminate Bethesda IV: follicular neoplasm or suspicious for a follicular neoplasm | 28 | 3.1 | |
| (TIR4) Suspicious for malignancy Bethesda V: suspicious for malignancy | 28 | 3.1 | |
| (TIR5) Malignant Bethesda VI: malignant | 30 | 3.3 | |
| Final diagnosis | Benign | 827 | 91.6 |
| Malignant | 76 | 8.4 | |
| PTC | 52 | ||
| fvPTC | 9 | ||
| FTC | 2 | ||
| MTC | 2 | ||
| suspicious PTC (active surveillance) | 2 | ||
| Othera | 9 | ||
| Total | 903 | 100.0 | |
The revised Italian Consensus for Thyroid Cytology (18) defines a lower-risk subcategory of indeterminate lesions (TIR3A) and a higher-risk subcategory (TIR3B), similar (though not identical, to Bethesda class III and IV, respectively.
Abbreviations: ACR, American College of Radiology; ETE, extrathyroidal extension; FTC, follicular thyroid cancer; fv, follicular variant; IQR, interquartile range; LN, lymph node; MTC, medullary thyroid cancer; PTC, papillary thyroid cancer; TTW, taller-than-wide.
Three poorly differentiated thyroid cancers, 1 oxyphilic carcinoma, 2 squamous cell carcinomas, 3 metastases from other primary carcinomas.
Single Features
The diagnostic performance of the single recorded features was evaluated, and the significant predictors are reported in Table 2. For subcategories within the same feature (eg, any degree of hypoechogenicity vs marked hypoechogenicity; “irregular” margins vs “irregular and infiltrative” margins; the 2 alternative definitions of TTW shape), the classification with the higher DOR was retained for the multivariable analysis. “Infiltrative” margins were described in 5 nodules only.
Features associated with malignancy of thyroid nodules: univariate analysis
| Feature | Sensitivity | Specificity | PPV | NPV | DOR 95% CI | Pa |
|---|---|---|---|---|---|---|
| Suspicious lymph node | 11.8% (5.6%-21.3%) | 99.3% (98.4%-99.7%) | 60.0% (32.3%-83.7%) | 92.4% (90.5%-94.1%) | 18.38 (6.35-53.19) | <.001 |
| Suspicious extrathyroidal extension | 7.9% (2.9%-16.4%) | 99.4% (98.6%-99.8%) | 54.5% (23.4%-83.2%) | 92.1% (90.2%-93.8%) | 14.09 (4.19-47.33) | <.001 |
| Irregular or infiltrative margins | 59.2% (47.3%-70.3%) | 87.7% (85.2%-89.8%) | 30.6% (23.3%-38.7%) | 95.9% (94.2%-97.2%) | 10.32 (6.24-17.05) | <.001 |
| Marked hypoechogenicity | 19.7% (11.5%-30.5%) | 97.6% (96.3%-98.5%) | 42.9% (26.3%-60.6%) | 93% (91.1%-94.6%) | 9.92 (4.84-20.35) | <.001 |
| Irregular margins | 55.3% (43.4%-66.7%) | 87.9% (85.5%-90%) | 29.6% (22.2%-37.8%) | 95.5% (93.8%-96.9%) | 8.98 (5.46-14.78) | <.001 |
| Hypoechogenicity (including marked) | 64.5% (52.7%-75.1%) | 73.0% (69.9%-76%) | 18.0% (13.6%-23.1%) | 95.7% (93.8%-97.2%) | 4.92 (3-8.06) | <.001 |
| Solid composition | 64.5% (52.7%-75.1%) | 70.7% (67.5%-73.8%) | 16.8% (12.7%-21.6%) | 95.6% (93.6%-97.1%) | 4.39 (2.68-7.18) | <.001 |
| Microcalcification | 26.3% (16.9%-37.7%) | 92.4% (90.4%-94.1%) | 24.1% (15.4%-34.7%) | 93.2% (91.2%-94.8%) | 4.33 (2.45-7.67) | <.001 |
| Any punctate hyperechoic foci (microcalcifications or indeterminate foci) | 53.9% (42.1%-65.4%) | 75% (71.9%-77.9%) | 16.5% (12.1%-21.7%) | 94.7% (92.6%-96.2%) | 3.51 (2.18-5.66) | <.001 |
| TTW shape (AP/T ≥ 1.2) | 13.2% (6.5%-22.9%) | 94.7% (92.9%-96.1%) | 18.5% (9.2%-31.4%) | 92.2% (90.2%-93.9%) | 2.70 (1.30-5.60) | .019 |
| Mild hypoechogenicity | 44.7% (33.3%-56.6%) | 75.4% (72.4%-78.3%) | 14.3% (10.1%-19.5%) | 93.7% (91.6%-95.4%) | 2.49 (1.54-4.02) | <.001 |
| Any calcification | 36.8% (26.1%-48.7%) | 78.1% (75.1%-80.9%) | 13.4% (9.1%-18.8%) | 93.1% (90.9%-94.9%) | 2.08 (1.27-3.41) | .004 |
| TTW shape | 30.3% (20.2%-41.9%) | 82.7% (80%-85.2%) | 13.9% (9%-20.1%) | 92.8% (90.7%-94.6%) | 2.08 (1.23-3.50) | .008 |
| Indeterminate foci | 32. 9% (22.5%-44.6%) | 80.2% (77.3%-82.8%) | 13.2% (8.7%-18.9%) | 92.9% (90.7%-94.6%) | 1.98 (1.19-3.29) | .012 |
Features are ranked according their DOR. Features highlighted in gray are included in the multivariable analysis; the other—being alternative descriptors of the same feature—were not included.
Abbreviations: DOR, diagnostic odds ratio; NPV, negative predictive value; PPV, positive predictive value; TTW, taller-than-wide.
Fisher exact test.
Multivariable Regression Analysis
When including the significant individual predictors into a multivariable model, all retained significance as discriminators between benign and malignant, with the exception of TTW shape using either definition (AP > transverse diameter or AP 1.2 times the transverse diameter) (Table 3). Of note, only 14 nodules had TTW as their unique suspicious feature, and all were benign (all of them had regular margin and were mixed nodules with isoechoic solid component; median maximum diameter 19.4 mm [IQR 15.32-32.6 mm], and 6 were located in the lower third of the lobe).
Features associated with malignancy of thyroid nodules: multivariable analysis
| OR | 95% CI | P | ||
|---|---|---|---|---|
| Step 1 | Suspicious LN | 16.73 | 4.22-66.30 | <.001 |
| Irregular or infiltrative margins | 7.09 | 4.03-12.48 | <.001 | |
| Suspicious ETE | 6.35 | 1.33-30.36 | .021 | |
| Solid composition | 3.58 | 2.01-6.40 | <.001 | |
| Marked hypoechogenicity | 2.98 | 1.18-7.54 | .021 | |
| Any punctate hyperechoic foci | 2.68 | 1.53-4.72 | .001 | |
| TTW shape (AP/T ≥ 1.2) | 1.54 | 0.60-3.93 | .371 | |
| Step 2a | Suspicious LN | 16.23 | 4.10-64.24 | <.001 |
| Suspicious ETE | 6.60 | 1.42-30.76 | .016 | |
| Irregular or infiltrative margins | 7.13 | 4.05-12.55 | <.001 | |
| Marked hypoechogenicity | 3.16 | 1.26-7.93 | .014 | |
| Solid composition | 3.61 | 2.02-6.44 | <.001 | |
| Any punctate hyperechoic foci | 2.69 | 1.53-4.73 | .001 |
Abbreviations: ETE, extrathyroidal extension; LN, lymph node; OR, odds ratio; TTW, taller-than-wide. P-values that confirmed a significant association are shown in bold.
TTW was removed in step 2, being not a significant independent predictor of malignancy.
Since both indeterminate foci and microcalcifications were significant predictors both in univariate and multivariable analysis, we used their combination (ie, any punctate hyperechoic foci, excluding comet-tail foci), because this would allow an easier recognition and description of the feature. Furthermore, the OR of the combination is higher than the OR of each of the 2 features in the multivariable model (see Table 3). Hyperechoic spots were considered true microcalcifications in 83 nodules, of which 39 (47%) were solid, and 6 (7.2%) markedly hypoechoic; overall, 55 (66.3%) had at least another suspicious feature. On the other hand, hyperechoic foci were reported as indeterminate in 189 nodules: A total of 113 (59.8%) had no other suspicious feature, 149 (78.8%) were mixed nodules, and 7 (3.7%) were markedly hypoechoic. Both microcalcification and indeterminate foci were found in 24 nodules.
After the removal of the TTW shape from the model, 6 features confirmed a significant and independent effect on risk of malignancy: suspicious lymph node, ETE, irregular or infiltrative margins, marked hypoechogenicity, solid composition, and punctate hyperechoic foci (see Table 3). Since the presence of suspicious lymph nodes is not an intrinsic feature of a specific thyroid nodule, the analysis was repeated after the exclusion of this predictor (Table 4).
Features associated with malignancy of thyroid nodules: multivariable analysis after removal of suspicious lymph nodes (not an intrinsic feature of thyroid nodules)
| DOR | 95% CI | P | ||
|---|---|---|---|---|
| Step 1 | Suspicious ETE | 6.09 | 1.33-28.0 | .02 |
| Irregular or infiltrative margins | 6.81 | 3.94-11.79 | <.001 | |
| Marked hypoechogenicity | 3.24 | 1.34-7.83 | .009 | |
| Solid composition | 3.58 | 2.03-6.33 | <.001 | |
| Any punctate hyperechoic foci | 2.90 | 1.67-5.03 | <.001 | |
| TTW shape (AP/T ≥ 1.2) | 1.39 | 0.55-3.53 | .482 | |
| Step 2a | Suspicious ETE | 6.38 | 1.43-28.49 | .015 |
| Irregular or infiltrative margins | 6.84 | 3.95-11.84 | <.001 | |
| Marked hypoechogenicity | 3.37 | 1.40-8.10 | .007 | |
| Solid composition | 3.61 | 2.04-6.37 | <.001 | |
| Any punctate hyperechoic foci | 2.90 | 1.67-5.03 | <.001 |
Abbreviations: DOR, diagnostic odds ratio; ETE, extrathyroidal extension; TTW, taller-than-wide.
TTW was removed in step 2, being not a significant independent predictor of malignancy.
Malignancy Rate According to Number of Suspicious Features
After the identification of these 5 predictive features of sonographic nodule imaging, the rate of malignancy was calculated according to the number present (Table 5). Even if some suspicious features are more strongly associated with malignancy, as demonstrated by their higher OR, a simple count of main suspicious features can classify the malignancy risk.
Count of suspicious features and malignancy rate
| Malignant nodules | OR (95% CI) | ||
|---|---|---|---|
| Count of suspicious features | Including TTW in count | Excluding TTW | |
| 0 | 6/370 (1.6%) | 6/384 (1.6%)a | — |
| 1 | 17/344 (4.9%) | 17/354 (4.8%) | 3.18 (1.24-8.15) |
| 2 | 21/134 (15.7%) | 25/117 (21.4%) | 17.12 (6.82-42.94) |
| 3 | 18/37 (48.6%) | 17/36 (47.2%) | 56.37 (19.95-159.25) |
| 4 | 9/13 (69.2%) | 8/9 (88.9%) | 504 (54.2-4686.24) |
| 5 | 4/4 (100%) | 3/3 (100%) | — |
| 6 | 1/1 (100%) | — | |
All of them resulted in being benign.
Abbreviations: OR, odds ratio; TTW, taller-than-wide.
Only 14 nodules had TTW as their unique suspicious feature.
Discussion
Even if the sonographic RSSs aim to be evidence-based to the greatest extent possible, they are still largely based on retrospective data, literature reviews, and expert opinion (4-6). The single-sonographic criteria have various sensitivity and specificity, but none of them is sufficient to adequately detect (or rule out) malignancy (22, 23). The evidence that backed the RSSs was mainly derived by 3 meta-analysis studies. Brito et al (24) evaluated 31 studies (18 288 nodules), concluding that the feature with the highest DOR for predicting malignancy was TTW shape (11.1; 95% CI, 6.6-18.9). Consistently, Campanella and colleagues (evaluating 41 studies, 29 678 nodules) (25) reported a DOR of 10.2 (95% CI, 6.7-15.3) for TTW shape. Finally, Remonti et al (26) found the highest specificity for the same feature (96.6%), exploring 22 observational studies (12 786 nodules). However, these results should be interpreted with caution. All these reviews were published in 2014 to 2015, and evaluated studies encompassing a wide time frame (1985-2012): During these years, US technologies and definitions substantially changed. US is an operator-dependent technique, and its reliability is clouded by a substantial interobserver variability in the assessment and reporting of many features (10, 27). The 6 sonographic RSSs most widely used (2-9) define TTW nodules as those with an AP diameter that exceeds the transverse diameter, without specifying any minimum magnitude for the difference. Thus, the TTW definition can potentially be applied to nodules whose diameters differ by only a few millimeters and the effect of interobserver and/or intraobserver variability could be considerable: an intraobserver variability of up to 18% (28) and an interobserver variability of 20.9% were reported for AP diameter measurements (16). Furthermore, other sources of variability are the prospective or retrospective evaluation (29), the plane in which the shape may be observed (transverse or longitudinal plane), or the “visual assessment” method (as suggested by the ACR TIRADS (4)), instead of the measurement of diameters. Many of the early papers do not provide any definition or details about these potential sources of variability, while recent reports adopted completely new definitions (such as orientation or sphericity(30)). This is also reflected by the considerable heterogeneity reported across the meta-analyses. Furthermore, TTW shape was analyzed only by 5 out of 22 studies in Remonti et al and 10 out of 41 studies in the Campanella review, and in 3137 nodules of the 18 288 nodules reported by Brito and colleagues. Also the most recently proposed systems, such as Chinese C-TIRADS (8) and the 2021 revised version of the Korean (K)-TIRADS (9), were based on a retrospective cohort study (31) and an updated literature review, respectively.
This single-center, prospective study reports our experience with 903 nodules jointly described by 2 operators during real-time examination before undergoing FNAB. Our group undertook extensive work on the definition and recognition of sonographic features (10), producing data on alternative descriptions of known features (13, 15). Three main conclusions may be derived from our analysis. First, margins that are suspicious for malignancy are irregular (including jagged, spiculated, microlobulated, and infiltrative ones). Second, even after the introduction of a new description of TTW shape, we were not able to reproduce the literature-reported high specificity and overall discriminative ability of this feature. On the contrary, it resulted in being a nonsignificant predictor when considered together with others in a multivariable model. None of the nodules having this feature alone resulted in being malignant.
In more recent studies, the TTW shape was confirmed as an independent risk feature for subcentimeter nodules (32), and thus relevant for the selection of patient candidates for active surveillance, or only in hypoechoic nodules (33). However, no definition of the feature was provided. Another study showed that TTW shape was not an accurate sonographic criterion for PTC diagnosis in nodules larger than 1 cm (and added no additional value to other features), while it showed the highest accuracy for PTC smaller than 0.5 cm (34). It was suggested that TTW shape reflects no or minimal compressibility of a thyroid lesion by the US probe, and it may be influenced both by the location and the composition of the lesion (35).
A recent study suggested that spherical shape (allowing greater access to blood oxygen, and calculated as the long/short diameter ratio) is an independent predictor of cancer (30); however, the multivariable analysis included age, sex, and nodule size, but no other sonographic risk features were analyzed. Furthermore, consistent with our results, the authors demonstrated no predictive value of TTW shape for malignancy.
On the other hand, we identified some features independently associated with malignancy that may be considered key suspicious features. In contrast with the choice of the European Thyroid Association (EU)-TIRADS, our data show that solid composition should be considered a significant predictor of malignancy: This is consistent with data suggesting that even small cystic changes reduce the likelihood of malignancy (36).
Finally, all hyperechoic punctate foci with no comet-tail artifact should be considered predictors of malignancy, including the so-called “indeterminate” hyperechoic foci, both in univariate and multivariable analyses. Punctate hyperechoic foci in the solid component of a nodule may indicate true microcalcifications (ie, psammoma bodies) (37), but also fibrosis, clumped thick colloid, or other dystrophic changes (38). Their interpretation is challenging, and they are prone to under-calling or over-calling. In our experience, it was more common for hyperechoic foci to be defined as microcalcification when clustering with other suspicious features and to be understated as indeterminate if found in less-suspicious lesions (eg, isoechogenic, mixed-composition nodules). This is consistent with the reported moderate interobserver agreement in their recognition (k value of 0.47 for microcalcifications, excluding “uncertain” hyperechoic foci (27); an even lower α value of .35 when the readers have to distinguish indeterminate foci from microcalcifications and comet-tail artifacts) (10). Thus, the presence of any punctate hyperechoic foci (without comet-tail artifact) should be taken into account during thyroid nodule risk stratification (as reported by other authors (39) and suggested by the ACR TIRADS) (4). This is consistent also with the definition proposed by the revised version of the K-TIRADS (9). To simplify the risk stratification process, a simple “counting” approach may be sufficient to stratify the risk of malignancy of thyroid nodules.
The study has some limitations: First, this was a selected cohort of thyroid nodules, all of which underwent FNAB based on several clinical or US criteria; second, we used a composite reference standard in which benign cytology report was deemed sufficient. However, cytology can yield a small number of false-negative results. Finally, the exclusion of nodules with nondiagnostic and indeterminate cytology reports is a source of selection bias, with a potential reduction of follicular-patterned lesions (usually lacking typical suspicious features) (40, 41). In fact, intermediate-risk nodules are more common in the indeterminate cytology cohort. On the other hand, however, the use of surgical cohorts causes selection bias, a significantly higher malignancy rate, and a different distribution of clinical features (eg, symptomatic benign nodules, larger nodules).
In conclusion, we identified 5 key suspicious features of thyroid nodules: suspicious ETE, the presence of irregular margins, marked hypoechogenicity, solid composition, and the existence of any punctate hyperechoic foci. The malignancy rate increases with the number of features.
Disclosures
The authors have nothing to disclose.
Data Availability
Restrictions apply to the availability of some or all data generated or analyzed during this study to preserve patient confidentiality or because they were used under license. The corresponding author will on request detail the restrictions and any conditions under which access to some data may be provided.
References
Abbreviations
- ACR
American College of Radiology
- AP
anteroposterior
- DOR
diagnostic odds ratio
- ETE
extrathyroidal extension
- FNAB
fine-needle aspiration biopsy
- PTC
papillary thyroid cancer
- RSS
risk stratification system
- TIRADS
Thyroid Imaging Reporting and Data System
- TTW
taller-than-wide
- US
ultrasonography
