


Abstract
Premenopausal women are at a lower risk of type 2 diabetes (T2D) compared to men, but the underlying mechanism(s) remain elusive. The secretion of the incretin hormones, glucose-dependent insulinotropic polypeptide (GIP) and glucagon-like peptide-1 (GLP-1), from the small intestine is a major determinant of glucose homeostasis and may be influenced by sex.
This study compared blood glucose and plasma insulin and incretin responses to intraduodenal glucose infusions in healthy young males and females.
In Study 1, 9 women and 20 men received an intraduodenal glucose infusion at 2 kcal/min for 60 minutes. In Study 2, 10 women and 26 men received an intraduodenal glucose at 3 kcal/min for 60 minutes. Venous blood was sampled every 15 minutes for measurements of blood glucose and plasma insulin, GLP-1 and GIP.
In response to intraduodenal glucose at 2 kcal/min, the incremental area under the curve between t = 0-60 minutes (iAUC0-60min) for blood glucose and plasma GIP did not differ between the 2 groups. However, iAUC0-60min for plasma GLP-1 (P = 0.016) and insulin (P = 0.011) were ∼2-fold higher in women than men. In response to intraduodenal glucose at 3 kcal/min, iAUC0-60min for blood glucose, plasma GIP, and insulin did not differ between women and men, but GLP-1 iAUC0-60min was 2.5-fold higher in women (P = 0.012).
Healthy young women exhibit comparable GIP but a markedly greater GLP-1 response to intraduodenal glucose than men. This disparity warrants further investigations to delineate the underlying mechanisms and may be of relevance to the reduced risk of diabetes in premenopausal women when compared to men.
Compared with men, the risk of type 2 diabetes (T2D) is noticeably lower in women, particularly when the later are in the premenopausal phase (1-3). Furthermore, in postmenopausal women, hormone replacement therapy (i.e., oestrogen and progestin) is associated with a reduced risk of T2D (4). These observations are indicative of a sex-driven disparity in glucose metabolism.
There is recent evidence that oestrogen signaling is coupled to the secretion of the incretin hormone, glucagon-like peptide-1 (GLP-1), which, together with glucose-dependent insulinotropic polypeptide (GIP), modulates the secretion of both insulin and glucagon from the pancreatic islets to drive glucose disposal in health and T2D (5). For example, in ovariectomized mice, there are impairments in GLP-1 and insulin secretion, as well as glucose tolerance (6), while supplementation of oestradiol in ovariectomized mice augments GLP-1 secretion, associated with increased insulin, suppressed glucagon, and improved glucose tolerance (6). Moreover, 10 weeks’ treatment with oestradiol in a rodent model of menopause reduced energy intake and body weight, effects that were markedly attenuated by the GLP-1 receptor antagonist, exendin(9-39). These observations provide a strong support for an “oestrogen-GLP-1” pathway in modulating metabolic health (38).
In humans, both GLP-1 and GIP are secreted mainly in response to meals, as a result of direct interaction between ingested nutrients and enteroendocrine L- and K-cells scattered along the gastrointestinal tract. There is a specific threshold, between 1 and 2 kcal/min, for glucose-induced GLP-1 secretion in the small intestine (39), while the secretion of GIP is more sensitive, which could be triggered by lesser glucose in the small intestine (7, 39). In contrast to animal models, the impact of sex on nutrient-induced GLP-1 and GIP secretion has not been well studied, and limited clinical studies have yielded inconsistent findings. It was reported that the postprandial GLP-1 response after a standardized breakfast is 50% higher in normal-weight young women than men (8). In combined analyses of subjects with and without T2D, plasma GLP-1 levels following 75 g oral glucose or a mixed meal were reported to be higher in women than men (9, 10). In another study, while the GLP-1 response to 75 g oral glucose was ∼20% higher in normoglycemic women than men, there was no difference in GLP-1 secretion between men and women with prediabetes and T2D (11). In premenopausal healthy women, the GLP-1 levels in response to 50 g oral glucose were shown to be substantially higher during the luteal than follicular phase (12). However, it should also be appreciated that these studies did not take into account variation in the rate of gastric emptying, which exhibits a substantial interindividual, but much lesser intraindividual, variation (∼1-4 kcal/min) (13, 14), which may be influenced by sex (15, 16) and, in women, the menstrual cycle (12, 17). Consequently, any difference in gastric emptying and, by definition, exposure of nutrients to the small intestine, would affect the “early” glycemic response (14, 18, 19) and secretion of GLP-1 and GIP (20-22, 39). For these reasons, the lack of standardization of gastric emptying may compromise the capacity to determine potential differences in GLP-1 and GIP secretion between men and women.
Accordingly, the current study compared plasma GLP-1 and GIP, as well as plasma insulin and blood glucose, in response to standardized intraduodenal glucose infusions at 2 different rates within the physiological range of gastric emptying between healthy young men and women.
Methods
Participants
We derived data from 65 healthy participants who were recruited from the community by advertisement for previous studies evaluating nutritional and/or pharmacological therapies for T2D (22-27). Participants were excluded if they reported significant gastrointestinal symptoms, a history of gastrointestinal surgery, or a requirement for medication known to affect gastrointestinal function or appetite. Female participants who used oral contraceptives or were pregnant were also excluded. Participants were screened to exclude renal dysfunction (based on the estimated glomerular filtration rate) and/or liver disease (based on serum liver enzymes). The studies were approved by the Royal Adelaide Hospital Human Research Ethics Committee and conducted in accordance with the principles of the Declaration of Helsinki as revised in 2000, and all participants provided written informed consent.
Protocol
Healthy young female and male participants were evaluated in 2 independent experimental settings (i.e., Studies 1 and 2) (Table 1). In Study 1, 9 female and 20 male participants received an intraduodenal glucose infusion at a rate of 2 kcal/min. In Study 2, 10 female and 26 male participants received an intraduodenal glucose at 3 kcal/min. Female participants were studied exclusively during the follicular phase of the menstrual cycle to limit potential cyclical variations in gastrointestinal function (12). All subjects were evaluated on a single study visit after refraining from strenuous physical activity for 24 hours and consuming a standardized evening meal (beef lasagne, McCain Foods, Victoria, Australia; 591 kcal) at 7 Pm the previous evening. Following the latter, subjects were instructed to abstain from food and nutrient beverages but were allowed to drink water until midnight, before attending our clinical research laboratory at The University of Adelaide the following day at around 8 Am.
Characteristics of study participants
| Study 1 (intraduodenal glucose at 2 kcal/min) | Study 2 (intraduodenal glucose at 3 kcal/min) | |||||||||
|---|---|---|---|---|---|---|---|---|---|---|
| Female (n = 9) | Male (n = 20) | P (no correction) | P (corrected for body weight) | P (corrected for BMI) | Female (n = 10) | Male (n = 26) | P (no correction) | P (corrected for body weight) | P (corrected for BMI) | |
| Age (years) | 25.0 (21.5, 26.0) | 21.0 (19.0, 27.8) | 0.19 | — | — | 25.0 (21.8, 27.0) | 23.5 (21.0, 28.0) | 0.50 | — | — |
| Weight (kg) | 57.1 ± 2.9 | 72.9 ± 4.1 | 0.001 | — | — | 62.3 (54.3, 92.6) | 73.8 (67.1, 90.1) | 0.09 | — | — |
| BMI (kg/m2) | 21.5 (20.1, 23.7) | 22.7 (21.8, 24.2) | 0.28 | — | — | 23.2 (20.2, 31.5) | 24.3 (22.7, 28.3) | 0.51 | — | — |
| Fasting blood glucose (mmol/L) | 5.3 ± 0.2 | 5.2 ± 0.4 | 0.95 | 0.32 | 0.47 | 5.4 ± 0.2 | 5.4 ± 0.1 | 0.83 | 0.93 | 0.81 |
| Glucose iAUC0-60min (mmol/L*min) | 135.7 ± 13.9 | 144.2 ± 10.4 | 0.75 | 0.35 | 0.44 | 99.8 ± 11.7 | 110.4 ± 8.0 | 0.47 | 0.59 | 0.51 |
| Fasting plasma insulin (mU/L) | 2.9 ± 0.4 | 2.4 ± 0.3 | 0.45 | 0.33 | 0.48 | 4.7 (2.4, 6.8) | 5.0 (2.2, 13.3) | 0.71 | 0.18 | 0.51 |
| Insulin iAUC0-60min (mU/L*min) | 1631.3 (1278.4, 2137.9) | 834.3 (66.24, 1114.1) | 0.005 | 0.011 | 0.025 | 1738.9 (1345.9, 4772.1) | 1897.1 (1093.1, 4252.5) | 0.99 | 0.86 | 0.85 |
| Fasting plasma GIP (pmol/L) | 10.9 ± 1.7 | 10.3 ± 1.4 | 0.81 | 0.61 | 0.62 | 11.2 (7.5, 16.5) | 11.5 (6.6, 14.5) | 0.79 | 0.96 | 0.95 |
| GIP iAUC0-60min (pmol/L*min) | 1283.9 ± 121.7 | 1352.1 ± 105.3 | 0.96 | 0.82 | 0.78 | 1006.2 ± 131.6 | 1030.3 ± 68.6 | 0.86 | 0.74 | 0.83 |
| Fasting plasma GLP-1 (pmol/L) | 19.5 ± 2.0 | 23.0 ± 1.5 | 0.17 | 0.08 | 0.07 | 16.7 (14.6, 19.6) | 15.7 (10.3, 20.7) | 0.46 | 0.61 | 0.63 |
| GLP-1 iAUC0-60min (pmol/L*min) | 524.8 ± 104.6 | 264.3 ± 57.2 | 0.025 | 0.016 | 0.039 | 640.5 (280.2, 1002.4) | 205.5 (87.8, 274.3) | 0.011 | 0.012 | 0.005 |
Abbreviations: BMI, body mass index; GIP, glucose-dependent insulinotropic polypeptide; GLP-1, glucagon-like peptide-1; iAUC0-60min, incremental area under the curve between t = 0-60 minutes.
Normally distributed data are expressed as means ± SEM, while data that are not normally distributed are expressed as median (25% and 75% interquartile range). The bold text used in the table is to emphasis the statistic significance (P < 0.05).
Upon arrival, a multilumen silicone catheter (Dentsleeve International, Ontario, Canada) was inserted transnasally and allowed to pass into the duodenum by peristalsis, with its position monitored continuously by measurement of the antral and duodenal transmucosal potential difference, as discussed previously (28, 29). An infusion port was positioned ∼12 cm distal to the pylorus. An intravenous cannula was inserted into a forearm vein, which was kept warm for repeated sampling of “arterialized’ venous blood. Subsequently, a standardized glucose solution was infused via the infusion port at a rate of either 2 kcal/min (Study 1) or 3 kcal/min (Study 2) between t = 0-60 minutes. Blood samples were collected at t = 0, 15, 30, 45, and 60 minutes for measurements of blood glucose and plasma insulin, total GIP and GLP-1 concentrations. At the end of each study visit, participants were given a meal before they were discharged from the laboratory.
Measurement of Blood Glucose and Plasma Insulin, Total GIP and GLP-1
Blood glucose concentrations were assessed using a glucometer (Optium Xceed, Abbott Laboratories, USA) and reported as the mean of duplicate measurements at each time point. Plasma insulin was measured by enzyme-linked immunosorbent assay (RRID: AB_287762, 10-1113, Mercodia, Uppsala, Sweden) with a sensitivity of 1.0 mU/L and intra- and interassay coefficients of variation (CVs) of 3.2% and 4.7%. Plasma total GIP was measured by radioimmunoassay (RRID: AB_518352) with some modifications of a previously published method (30). The standard curve was prepared in buffer rather than extracted charcoal stripped serum, and the radio-iodinated label was supplied by Perkin Elmer (Boston, MA, USA). The standard curve was prepared in buffer rather than extracted charcoal-stripped serum, and the radio-iodinated label was supplied by PerkinElmer. The sensitivity of the assay was 2 pmol/L, and the intra- and interassay CVs were 6.1% and 15.4%, respectively. Plasma total GLP-1 concentrations were measured by radioimmunoassay (RRID: AB_2757816, GLPIT-36HK; Millipore, Billerica, MA, USA) with a sensitivity of 3 pmol/L and intra- and interassay CVs of 4.2% and 10.5%, respectively.
Statistical Analysis
The incremental areas under the curve (iAUCs) (calculated as the total areas under the curve subtracting the baseline value) for blood glucose and plasma hormones were calculated using the trapezoidal rule. Demographic data for male and female subjects were compared using unpaired Student's t-tests after confirming normality of distribution. Fasting blood glucose and plasma hormone concentrations and their iAUCs during intraduodenal glucose infusions in male and female participants were compared using unpaired Student's t-tests, or Mann-Whitney U tests if data were not normally distributed, before and after adjustment for body weight or body mass index (BMI). The relationships of GLP-1 iAUC between t = 0-60 minutes (iAUC0-60min) with BMI and body weight in men were evaluated using univariate linear regression analysis. Blood glucose and plasma hormone responses to intraduodenal glucose infusions were also evaluated by two-way repeated measures analysis of variance using group and time as factors. Post hoc comparisons, adjusted for multiple comparisons by Bonferroni's correction, were performed if analyses of variance revealed significant interactions. All analyses were performed using Prism 9.4 software (GraphPad, La Jolla, CA, USA). Data are presented as means ± SEM or medians (25% and 75% interquartile ranges); P < 0.05 was considered statistically significant.
Results
The demographic data of subjects in both studies are summarized in Table 1. There was no difference in age [female vs male: 25.0 (21.5, 26.0) vs 21.0 (19.0, 27.8) years, P = 0.19, in Study 1, and 25.0 (21.8, 27.0) vs 23.5 (21.0, 28.0) years, P = 0.50, in Study 2] or BMI [female vs male: 21.5 (20.1, 23.7) vs 22.7 (21.8, 24.2) kg/m2, P = 0.28, in Study 1, and 23.2 (20.2, 31.5) vs 24.3 (22.7, 28.3) kg/m2, P = 0.51, in Study 2] between female and male participants in either study (Table 1). However, in Study 1, female participants had a significantly lower body weight [55.0 (51.5, 62.3) vs 67.8 (65.3, 79.5) kg, P = 0.001] and a trend for a lower body weight in Study 2 (71.4 ± 7.1 vs 82.7 ± 4.8 kg, P = 0.09).
Blood Glucose
Fasting blood glucose concentrations did not differ between the 2 groups in either study (Table 1). In both studies, during intraduodenal glucose infusion (t = 0-60 minutes), blood glucose increased progressively (time effect: P < 0.001 for each group), without a difference between the 2 groups (Study 1: P = 0.87 for group difference; Study 2: P = 0.35 for group difference, Fig. 1A and 1B). Similarly, the blood glucose iAUC0-60min did not differ between the 2 groups before or after adjustment for body weight or BMI in either study (Table 1).
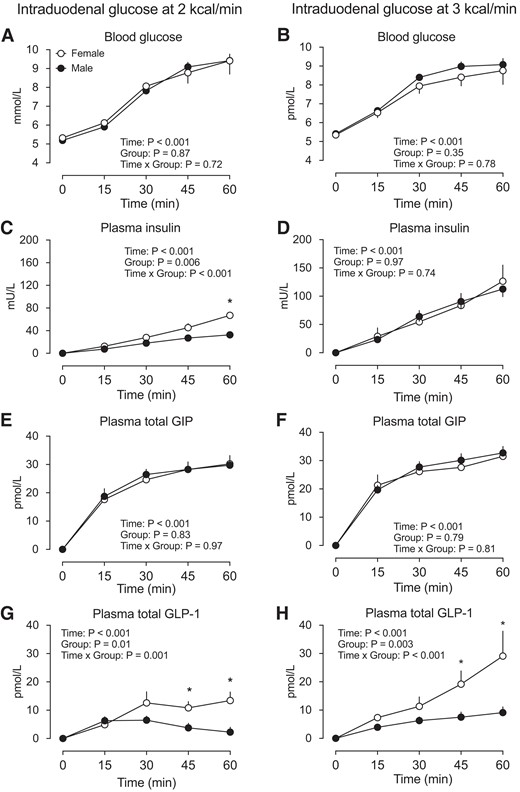
Blood glucose (A-B), plasma insulin (C-D), plasma total GIP (E-F), and plasma total GLP-1 (G-H) concentrations in response to intraduodenal glucose infusion at 2 kcal/min and 3 kcal/min in healthy male and female participants. Two-factor repeated-measures ANOVA, with group and time as factors, was used to compare the differences between males and females. *P < 0.05 for males vs females. Post hoc comparisons, adjusted for multiple comparisons by Bonferroni's correction, were performed if ANOVAs revealed significant interactions. Data are means ± SEM. Abbreviations: ANOVA, analysis of variance; GIP, glucose-dependent insulinotropic polypeptide; GLP-1, glucagon-like peptide-1.
Plasma Insulin
Fasting plasma insulin concentrations did not differ between the 2 groups in either study (Table 1). During intraduodenal glucose infusion (t = 0-60 minutes), plasma insulin increased progressively in both groups (time effect: P < 0.001 for each), with concentrations being higher in female than male subjects in Study 1 (group effect: P = 0.006, group by time interaction: P < 0.001), with a significant difference at t = 60 minutes; Fig. 1C) but not in Study 2 (group effect: P = 0.97, group by time interaction: P = 0.74). Similarly, the insulin iAUC0-60min was greater in female than male participants both before and after adjustment for body weight or BMI in Study 1, without any difference in Study 2 (Table 1).
Plasma Total GIP
Fasting plasma total GIP did not differ between the 2 groups in either study (Table 1). During intraduodenal glucose infusion (t = 0-60 minutes), plasma GIP increased promptly and plateaued between t = 30-60 minutes (time effect: P < 0.001 each), without any difference between the 2 groups in either study (Study 1: P = 0.83 for group difference, P = 0.97 for group by time interaction; Study 2: P = 0.79 for group difference, P = 0.81 for group by time interaction, Fig. 1E and 1F). Similarly, the GIP iAUC0-60min did not differ between the 2 groups, before or after adjustment for body weight or BMI, in either study (Table 1).
Plasma Total GLP-1
Fasting plasma total GLP-1 did not differ between the 2 groups in either study (Table 1). During intraduodenal glucose infusion at 2 kcal/min (t = 0-60 minutes), plasma total GLP-1 increased marginally in the first 30 minutes but subsequently returned to the baseline level in male participants (time effect: P < 0.001). However, there were marked and sustained increases in plasma GLP-1 in female participants (time effect: P < 0.001). Accordingly, the GLP-1 response was greater in females (P = 0.01 for group difference; P = 0.001 for group by time interaction, with significant differences between t = 45-60 minutes). During intraduodenal glucose infusion at 3 kcal/min (t = 0-60 minutes), plasma total GLP-1 increased progressively in both male and female participants (time effect: P < 0.001 for each), with the magnitude of increase being substantially greater in females (P = 0.003 for group difference, P < 0.001 for group by time interaction, with significant differences between t = 45-60 minutes (Fig. 1G-H). The GLP-1 iAUC0-60min was also greater in females, both before and after adjustment for body weight or BMI, in both studies (Table 1).
Discussion
The current study showed that the secretion of GLP-1 in response to small intestinal glucose infusion (at either 2 or 3 kcal/min) was substantially greater in healthy women than men. Although the latter was not accompanied by any difference in blood glucose, due probably to compensation for glucose disposal by other gluco-regulatory mechanisms in these healthy young participants, the sex-related disparity in GLP-1 secretion warrants further investigations to delineate the underlying mechanisms and clarify its relevance to the risk of T2D.
The use of intraduodenal infusions allowed standardization of small intestinal exposure to glucose by circumventing the influence of gastric emptying on postprandial incretin hormone secretion. The rates of intraduodenal glucose infusion, i.e., 2 and 3 kcal/min, were within the physiological range of gastric emptying and were well tolerated. We observed that the plasma total GIP levels increased rapidly and plateaued after t = 30 minutes of intraduodenal glucose infusion, with a similar response to glucose infusion at 2 and 3 kcal/min. This secretory pattern of GIP is consistent with the distribution of GIP-releasing K-cells in the proximal small intestine (5, 31). By contrast, plasma GLP-1 was modestly elevated in response to glucose infusion at 2 kcal/min and increased progressively following glucose infusion at 3 kcal/min, reflecting the need for glucose to exceed the absorptive capacity of the proximal small intestine and reach more distal regions of the intestine, where GLP-1-releasing L-cells predominate (5, 31).
Previous studies evaluating incretin responses to orally ingested meals or glucose have reported a modestly higher GLP-1 secretion (∼20-50%) in women than men (8-11) or no difference between women and men (11, 32). In the present study, we observed a profoundly higher GLP-1 response to intraduodenal glucose (at both 2 and 3 kcal/min) in healthy young women than men (>2 fold). The discrepancy between current and previous findings is likely to be attributable to the different study design. As discussed, gastric emptying varies substantially between individuals (14) and is often slower in women than age-matched men (15, 16), which would influence the nutrient exposure to the small intestine and confound comparisons of the secretory capacity of GLP-1 between women and men. In a previous study in healthy young women, the GLP-1 response to a 50 g oral glucose drink was found to be substantially greater during the luteal vs follicular phase, in association with slower gastric emptying and attenuated postprandial blood glucose levels (12). In the current study, female participants were evaluated in the follicular phase; it is therefore likely that the sex-related difference in GLP-1 response to intraduodenal glucose infusions could have been greater if female participants were studied in the luteal phase.
By contrast, we did not observe any sex-related disparity in GIP secretion in response to intraduodenal glucose. However, we noted that intraduodenal glucose infusions at 2 and 3 kcal/min appeared already to have achieved near-maximal GIP responses (22), which may have limited our ability to differentiate GIP secretion between the 2 groups.
Despite the differences in GLP-1 secretion in both experimental settings, insulin secretion was only modestly higher in women than men, following intraduodenal glucose infusion at 2 kcal/min, and there was no significant difference in blood glucose concentrations between the 2 groups in either setting. These observations may have reflected the fact that GIP is the major incretin hormone in health and that other gluco-regulatory mechanisms beyond GLP-1 are involved in glucose disposal in healthy young participants. It is also plausible that the observation window for blood glucose was too brief (only 60 minutes, within which blood glucose had not returned to baseline) to detect any potential differentiation in blood glucose.
Although the insulinotropic action of endogenous GIP is markedly diminished in T2D (29), the action of GLP-1 is largely preserved (5). In a given individual, the greater GLP-1 response to small intestinal nutrient stimulation is also predictive of slower gastric emptying (33), which is highly desirable for limiting postprandial glycemic excursions in the management of T2D (14, 19). Dietary and/or pharmacological interventions that stimulate GLP-1 secretion are effective for slowing gastric emptying and reducing postprandial glycemia in T2D (34-37). Accordingly, the sex-related disparity in GLP-1 secretion may be relevant to glucose disposal in the context of dysglycemia and T2D risk between women and men, and gaining an understanding of the underlying mechanism(s) may reveal novel therapeutic strategies for boosting endogenous GLP-1 secretion.
Preclinical evidence suggests a major role of oestrogen signaling in the incretin axis. In mice, ovariectomy is associated with a marked reduction in postprandial GLP-1 secretion, which can be restored by oestradiol replacement (6). It would therefore be of interest to investigate whether the onset of menopause decreases GLP-1 secretion and, if so, whether oestrogen replacement therapy (or targeted activation of the intestinal oestrogen receptor) would correct this defect.
Several limitations should be noted in the current study. First, only young healthy male and female participants were enrolled. Generalization of our findings to a wider population should be undertaken with caution. For example, there is evidence that both fasting and postprandial GLP-1 levels are reduced, at least modestly, with aging (40). Second, our sample size was relatively small; however, the findings were clear-cut. Third, although the cofounding factor gastric emptying was circumvented, small intestinal transit, which is likely to be a determinant of the nutrient-induced GLP-1 response, was not evaluated in the current study. Fourth, dietary patterns, which may also affect gastric motility (41) and incretin responses (42), were not evaluated. Fifth, the current study evaluated incretin responses to glucose only. Future studies involving other macronutrients or physiological meals are therefore warranted. Finally, we noted that, although BMI was well matched between the 2 groups in both study settings, female participants had lower body weight and hence less body fluid volume, which potentially represents as a confounder for the evaluation of plasma hormone concentrations. However, correction for body weight did not alter our conclusions. Moreover, we did not find any relationship between BMI/body weight and GLP-1 iAUC0-60min in men (data not shown). Accordingly, we believe that the differences in body weight between the 2 groups are unlikely to be of major relevance to their disparate GLP-1 responses.
In summary, we have demonstrated that healthy young women exhibited comparable GIP and blood glucose but a greater GLP-1 response to intraduodenal glucose infusions at 2 and 3 kcal/min than men. These observations are indicative of a major disparity in GLP-1 secretion between women and men, which warrants further investigation of the underlying mechanisms and the relevance to the risk of impaired glucose tolerance and T2D.
Acknowledgments
The authors wish to thank Kylie Lange (Centre of Research Excellence in Translating Nutritional Science into Good Health, The University of Adelaide) for her expert statistical advice and Michelle Bound, Jacqueline Grivell, Jessica Chang, Chinmay Marathe, Xiang Zhang, Sony Thazhath, Paul Kuo and Reawika Chaikomin (Centre of Research Excellence in Translating Nutritional Science into Good Health, The University of Adelaide) for assistance in subject recruitment and the conduct of the study.
Funding
C.X. is supported by a Mary Overton Early Career Fellowship from the Royal Adelaide Hospital. T.W. is supported by a Mid-Career Fellowship from The Hospital Research Foundation. K.L.J. is supported by a William T Southcott Research Fellowship.
Author Contributions
C.X. was involved in data collection and interpretation, statistical analysis, and writing of the manuscript; W.H., C.J.X., and Y.S. were involved in data interpretation and reviewing of the manuscript. L.T. was involved in data collection and reviewing of the manuscript. K.L.J. and M.H. were involved in conception and design of the study, data interpretation, and reviewing of the manuscript. C.K.R. and T.W. were involved in conception and design of the study, data interpretation, statistical analysis, and drafting of the manuscript and are guarantors of this work.
Disclosures
K.J. has received research funding from Sanofi and drug supplies from Merck Sharp & Dohme. T.W. has received travel support from Novartis and Sanofi and research funding from Novartis and AstraZeneca. M.H. has participated in the advisory boards and/or symposia for Novo Nordisk, Sanofi, Novartis, Eli Lilly, Merck Sharp & Dohme, Boehringer Ingelheim, and AstraZeneca and has received honoraria for this activity. C.K.R. has received research funding from AstraZeneca, Merck Sharp & Dohme, Eli Lilly, Novartis, and Sanofi. None of the other authors has any personal or financial conflict of interest to declare.
Data Availability
The datasets generated during and/or analyzed during the current study are not publicly available but are available from the corresponding author on reasonable request.
References
