


Abstract
Active acromegaly is characterized by increased lean body mass, but the mechanisms underlying the protein anabolic effect are unclear.
To study if active acromegaly induces reversible changes in whole-body and skeletal muscle protein kinetics.
Eighteen patients with acromegaly were investigated before and 47 ± 10 weeks after disease control by surgery (n = 8) and/or medical treatment (n = 10). Labeled phenylalanine and tyrosine tracers were employed to assess whole-body and regional forearm muscle protein kinetics. Intramyocellular protein signaling was assessed in skeletal muscle biopsies, and whole-body dual-energy X-ray absorptiometry scan and indirect calorimetry assessed lean body mass (LBM) and resting energy expenditure, respectively.
Disease control induced a 7% decrease in lean body mass (P < .000) and a 14% decrease in LBM-adjusted energy expenditure. Whole-body phenylalanine breakdown decreased after disease control (P = .005) accompanied by a decrease in the degradation of phenylalanine to tyrosine (P = .005) and a decrease in whole-body phenylalanine synthesis (P = .030). Skeletal muscle protein synthesis tended to decrease after disease control (P = .122), whereas the muscle protein breakdown (P = .437) and muscle protein loss were unaltered (P = .371). Unc-51 like autophagy activating kinase 1 phosphorylation, an activator of protein breakdown, increased after disease control (P = .042).
Active acromegaly represents a reversible high flux state in which both whole-body protein breakdown and synthesis are increased, whereas forearm muscle protein kinetics are unaltered. Future studies are needed to decipher the link between protein kinetics and the structure and function of the associated growth hormone-induced increase in lean body mass.
Growth hormone (GH) is essential for postnatal growth and exhibits a unique ability to promote either protein anabolism or lipid catabolism depending on energy state (1). However, the impact of GH on protein metabolism is complex, and the underlying mechanisms are not fully understood.
Previous studies report that acute high-dose growth hormone (GH) exposure stimulates muscle protein synthesis (2–5), accompanied by a reduction in amino acid oxidation (4, 6). Prolonged GH administration mainly increases whole-body protein synthesis (5, 7–9) paralleled by reduced urinary urea excretion (10, 11).
The anabolic effects of GH are evident in acromegaly characterized by chronically elevated GH levels and increased lean body mass (LBM), which reverses after treatment (12). Reciprocal changes are demonstrated before and after GH replacement in GH-deficient patients (13, 14). Protein kinetic studies in GH-deficient adults have reported uniformly reduced rates of whole-body protein synthesis and breakdown, indicating a steady state of low protein turnover (15, 16). GH replacement, in turn, increases whole-body protein synthesis (17, 18), which reaches a new steady state and maintains the net gain in LBM (15, 17).
Increased whole-body protein synthesis and breakdown have been reported in active acromegaly compared to healthy subjects (19), whereas another study failed to detect significant changes in protein turnover when comparing active and controlled acromegaly with healthy controls (20).
To our knowledge, no studies have prospectively evaluated whole-body and skeletal muscle protein kinetics in patients with acromegaly before and after disease control. The aim of our study was to investigate protein metabolism at the whole-body level and in skeletal muscle together with the intramyocellular signaling signatures of muscle protein synthesis and breakdown in newly diagnosed patients with acromegaly before and after treatment.
Patients
Eighteen patients with newly diagnosed acromegaly were included in the study and studied before and after treatment. The diagnosis of acromegaly was based on magnetic resonance imaging of the sellar region, age- and gender-adjusted insulin-like growth factor-I (IGF-I) levels and GHnadir levels during an oral glucose tolerance test. Eight patients were controlled by surgery alone, and 10 patients were treated medically with a somatostatin analogue alone (n = 7) or in combination with a GH antagonist (n = 3). Three male patients presented with biochemical hypogonadism (testosterone levels between 3.6 and7.9 nmol/L), which remained unreplaced during the study period. One patient developed mild hypocortisolemia following disease control (the level of cortisol increased from 178 to 487 nmol/L during a short synachten test) and was replaced with oral hydrocortisone (Table 1).
Patient characteristics (n = 18) at time of diagnosis and after disease control
| Time of diagnosis | |
| Age (years) | 50 (32; 74) |
| Sex (M/F) | 9/9 |
| Adenoma size (n) | |
| Macro | 16 |
| Micro | 2 |
| Disease control | |
| Time since intervention (weeks) | 47 (16; 163) |
| Pituitary surgery (y/n) | 14/4 |
| Somatostatin analogue (y/n) | 10/8 |
| GH-receptor antagonist (y/n) | 3/15 |
| Radiation therapy (y/n) | 0/18 |
| Dopamine agonist (y/n) | 2/16 |
| Diabetes mellitus (y/n) | 0/18 |
| Anterior pituitary deficiency (y/n) | 4/14 |
Age and times since intervention are presented as mean (range).
Abbreviations: GH, growth hormone.
The study was approved by the Central Denmark Region Scientific Ethics Committee (M-20070130), registered at ClinicalTrials.gov (NCT00647179), and conducted in agreement with the Declaration of Helsinki II. Patients gave written informed consent prior to inclusion in the study. Data on glucose, insulin, c-peptide, free fatty acid (FFA) levels, and body composition obtained by dual-energy X-ray absorptiometry (DXA) scanning have previously been published (21, 22).
Methods
On each study day, the patients were examined in the fasting state for 4 hours. A catheter was inserted in an antecubital vein for infusions, and a second catheter was inserted in a heated dorsal hand vein to sample arterialized blood. In the contralateral arm, a third catheter was inserted retrogradely in a deep antecubital vein to collect venous blood. At t = 0, amino acid tracers were administered. During sterile conditions and local anesthesia, muscle tissue from the vastus lateralis of the quadriceps muscle was obtained using a Bergström needle at t = 60. Tissue specimens were immediately washed free of blood and snap-frozen in liquid nitrogen. Indirect calorimetry (Oxycon Pro; Intramedic, Gentofte, Denmark) were performed at t = 170. The respiratory quotient (RQ) and the resting energy expenditure (REE) were determined during a 15-minute collection period. REE was adjusted for LBM (23). Urine was collected throughout the study day. The forearm blood flow was measured with strain-gauge plethysmography (24), and blood samples were obtained in triplicate at t = 210, t = 230, and t = 240. Body composition was measured by DXA using a Hologic scanner (QDR-2000; Hologic, Marlborough, MA, USA) at the end of the study day and LBM were computed according to the manufacturer's software.
Hormones and Metabolites
Serum GH (RRID: AB_2861356) and IGF-I (RRID: AB_2861357) levels were analyzed by chemiluminescence technology (IDS-iSYS platform; Immunodiagnostic 141 Systems, Boldon, UK). Serum IGF-I concentrations are expressed as SD scores (IGF-SDSs) (25). Plasma glucose was analyzed using YSI 142 2300 STAT Plus glucose analyzer (YSI, Burlington, VT, USA). Commercial enzyme-linked immunosorbent assay was used to analyze insulin (RRID: AB_2935709) (Dako, 143 Glostrup, Denmark) and C-peptide (RRID: AB_2801468) (ALPCO, Salem, NH, USA). FFA was analyzed by an in vitro enzymatic colorimetric method (Wako Chemicals, Neuss, Germany).
Energy Expenditure
Indirect calorimetry measures whole body oxygen consumption and carbon dioxide production. This provides an estimation of the type and amount of substrates oxidized and also an estimation of the amount of energy produced. The RQ is calculated as the ratio of carbon dioxide produced to the oxygen consumed, which equals 0.70 for protein. The nitrogen part of protein is excreted as urea, wherefore protein oxidation is calculated based on urea nitrogen excretion in the urine (26).
Tracer Techniques
Protein metabolism was evaluated by isotopic tracers: [15N]phenylalanine (10 mg/mL), [2H4]tyrosine (0.5 mg/mL), [15N]tyrosine (0.5 mg/mL), and [13C]urea (10 mg/mL) (Cambridge Isotope Laboratories). All tracer infusions were preceded by priming of pools with 0.7 mg/kg [15N]phenylalanine, 0.3 mg/kg [15N]tyrosine, 0.5 mg/kg [2H4]tyrosine, and 390.6 mg/kg [13C]urea. The infusions were continued for 4 hours at the following rates: 0.7 mg kg−1 h−1 of [15N]phenylalanine, 0.5 mg kg−1 h−1 of [2H4]tyrosine, and 42 mg/h [13C]urea. Steady state was reached during the last 30 minutes. Isotopic enrichments were measured by gas chromatography-mass spectrometry.
Whole-Body Protein Metabolism
Phenylalanine is an essential amino acid, and, in the fasting state, the phenylalanine tracer provides an estimate of whole-body protein turnover. Phenylalanine is either hydroxylated into tyrosine or incorporated into protein, wherefore adding the tyrosine tracer enables estimation of whole-body protein synthesis.
Whole-body fluxes of phenylalanine (Qphe), tyrosine (Qtyr), and urea (Qurea) were calculated as:
I = rate of trace infusion [µmol/(kg h)], Ei is enrichment of the tracer infused, and Ep is the plasma enrichment of the tracer at the isotopic plateau (27). The rate of phenylalanine conversion to tyrosine (Qpt) was calculated as:
15N-Tyrei and 15N-Pheei are the isotopic enrichments of the respective tracers in plasma. Iphe is the infusion rate of 15N-phenylalanine [µmol/(kg h)] (28).
The rate of phenylalanine synthesis (Qs) was calculated as:
Whole-body protein metabolism is expressed per kg total body weight.
Forearm Protein Metabolism
Phenylalanine is suitable for assessing muscle protein turnover since phenylalanine is neither metabolized (by oxidation) nor synthesized in muscle tissue. Skeletal muscle protein kinetics were calculated using the forearm model based on the two-pool model (arterial and venous pool, respectively) (27, 29):
NB (nmol min−1 100 mL−1 of forearm volume) is the net balance of phenylalanine. BF (mL min−1 100 mL−1 of forearm) is the blood flow. and (nmol/mL) are the arterial and venous plasma concentrations of phenylalanine.
The phenylalanine rate of appearance (Raphe) is a measure of muscle protein breakdown (29):
PheEa and PheEv represent phenylalanine isotopic enrichment in arterialized and venous blood, respectively.
The phenylalanine rate of disappearance (Rdphe) is a measure of muscle protein synthesis (29):
Western Blotting
Phosphorylation of dedicated signaling proteins, ie, GH and markers of protein degradation and synthesis, were measured by western blotting. Using a cold buffer containing a protease inhibitor cocktail (Halt, Thermo Scientific), 20 mM tris(hydroxymethyl)-aminomethane, 50 mM sodium chloride, 50 mM sodium fluoride, 5 mM Na4P2O7, 5 mM nicotinamide, 5 μM trichostatin A, 250 mM sucrose, 1% (v/v) Triton X-100, and 2 mM dithiothreitol muscle tissue was homogenized in Precellys 24 homogenizer (Bertin Technologies) at pH7.4. Samples were rotated for 20 minutes and centrifuged at 14.000 g for 20 minutes at 4°C. Control for equal loading was performed using the stainfree technology (30). Antibodies against mammalian target of rapamycin (mTOR) (catalog no. 2972, RRID: AB_330978), mTORser2448 (catalog no. 5536, RRID: AB_10691552), Eukaryotic translation initiation factor 4E-binding protein 1 (4EB-P1) (catalog no. 9644, RRID: AB_2097841), Unc-51 like autophagy activating kinase 1 (ULK1) (catalog no. 4773, RRID: AB_2288252), ULK1ser757 (catalog no. 6888, RRID: AB_10829226) from Cell Signaling Technology were used. Proteins were visualized and quantified using Image Lab (version 4.0.1, Bio-Rad). Quantifications are expressed as the ratio between phosphorylated protein and the total protein measurement.
Quantitative Polymerase Chain Reaction
Quantitative polymerase chain reaction analyses were performed as previously described (31). B2M (encoding β2 microglobulin) was used as housekeeping gene, as messenger RNA (mRNA) levels were similar between interventions. The following primers were used: IGF-I: GACAGGGGCTTTTATTTCAAC and CTCCAGCCTCCTTAGATCAC, length = 117 base pair (bp); cytokine-inducible SH2-containing protein (CISH): TTCGGGAATCTGGCTGGTATTGG and GCATCTTCTGCAGGTGTTGTCG, length = 69 bp; suppressor of cytokine signaling 2 (SOCS): TCCCTTCCTAAGGCTGACCAAGAC and GCGACTTCAGCCTTTACATGCG, length = 78 bp; microtubule associated protein 1 light chain 3 alpha (LC3): GTGCCTGTGTTGTTACGGAAAGC and TGTGTTTCTCCCGCTGTACTCC, length = 67 bp; sequestosome 1 (P62): AGAAGAGCAGCTCACAGCCAAG and TATCCGACTCCATCTGTTCCTCAG, length = 150 bp; muscle RING finger 1 (Murf1): ACCGTGTGCAGACCATCATCAC and ACCTGGTGACTGTTCTCCTTGG, length = 7 bp; the housekeeping gene, β2 microglobulin (β2 M): GAGGCTATCCAGCGTACTCC and AATGTCGGATGGATGAAACCC, length = 111 bp.
Statistics
Results are presented as mean ± SE when normally distributed and median (range) when not. The effect of intervention [active (pre) vs disease control (post)] was assessed by repeated measurement mixed effects model analysis, and Kenward Roger's approximation was used for calculation of degrees of freedom to account for unbalanced data sets due to missing observations. To obtain homogeneous variance, unequal variance variables were logarithmically transformed before statistical testing. Correlation analysis was performed with Pearson's or Spearman's coefficient for normally and nonnormally distributed variables, respectively. P-values <.05 were considered significant. Statistical analyses were performed with Stata Statistical Software, release 15 (StataCorp LP, College Station, TX, USA). The graphical presentations were made in SigmaPlot 11.0 (Systat Software, San Jose, CA, USA).
Results
Hormones and Metabolites
The mean ± SE IGF-ISDS level during active disease were 4.4 ± 0.3 and the corresponding median GHnadir level during the oral glucose tolerance test was 6.3 (3.7; 10.8) µg/L. Disease control lowered IGF-ISDS to 0.9 ± 0.3 and the median GHnadir levels to 0.5 (0.3; 0.9) µg/L (excluding the 3 patients treated with a GH antagonist). Although IGF-I levels decreased in all patients, IGF-I levels remained elevated in 4 patients.
Plasma glucose levels decreased insignificantly after disease control (P = .14), whereas disease control induced a significant decrease in serum insulin levels (P < .001) and serum C peptide levels (P = .002). Serum FFA levels were unaltered after disease control (P = .781) (Table 2).
Circulating hormones and metabolites before (pre) and after (post) disease control
| Pre | Post | P-value | |
|---|---|---|---|
| IGF-ISDS | 4.4 ± 0.3 | 0.9 ± 0.3 | .001 |
| GHnadir (µg/L) | 6.3 (3.7; 10.8) | 0.5 (0.3; 0.9) | .001 |
| Glucose (mmol/L) | 5.71 (5.33; 6.11) | 5.36 (5.0; 5.74) | .140 |
| Insulin (pmol/L) | 71.1 (56.5; 89.6) | 28.6 (22.7; 36.0) | .001 |
| C-peptide (pmol/L) | 626.2 (468.4; 784.0) | 364.3 (203.6; 525.0) | .002 |
| Free fatty acids (mmol/L) | 0.39 (0.30; 0.51) | 0.41 (0.32; 0.53) | .781 |
Data are presented as mean ± SE or median (CI).
Abbreviations: GH, growth hormone; IGF, insulin-like growth factor.
Body Composition and Resting Energy Expenditure
Body mass index remained unaltered after disease control (P = .311), whereas LBM (kg) decreased significantly by 7% after disease control (P < .001) and fat mass (kg) increased by 18% (P < .001). Both ΔIGF and ΔGH (excluding pegvisomant treated patients) correlated positively with ΔLBM [r = 0.60, P = .0080 (IGF-I); r = 0.70, P = .0236 (GH)]. Disease control significantly decreased REE [kcal/24 hours/kg (P < .001)], whereas the RQ (P = .985) and the calculated substrate oxidation rate of protein (P = .821) were unaltered after disease control (Table 3). ΔIGF-I correlated positively with ΔREE (r = 0.56, P = .0236).
Body composition, energy expenditure, and protein oxidation before (pre) and after (post) disease control
| Pre | Post | P-value | |
|---|---|---|---|
| Body mass index | 27.6 (25.4; 29.7) | 27.2 (25.0; 29.3) | .290 |
| Lean body mass (kg) | 64.8 (57.6; 72.0) | 60.3 (53.1; 67.5) | .001 |
| Total fat mass (kg) | 20.0 (15.4; 23.8) | 24.4 (20.1; 28.4) | .001 |
| Resting energy expenditure (kcal/24 hours) | 1900 (1817; 1983) | 1726 (1642; 1809) | .001 |
| Respiratory quotient (%) | 0.83 (0.81; 0.85) | 0.83 (0.81; 0.86) | .985 |
| Protein oxidation rate | 0.66 (0.53; 0.78) | 0.68 (0.05; 0.82) | .821 |
Data are presented as median (CI).
Whole-Body Protein Metabolism
The whole-body urea flux and the urine nitrogen excretion were unaltered after disease control (P = .149 and P = .388, respectively). Whole-body phenylalanine breakdown (Qphe) decreased after disease control (P = .005), accompanied by a decrease in both the degradation of phenylalanine to tyrosine (Qpt) (P = .005) and phenylalanine synthesis (Qs) (P = .030), (Fig. 1).
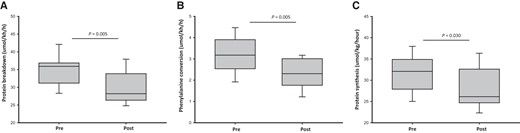
Whole body protein kinetics before (pre) and after (post) disease control in acromegaly. (A) Whole body protein breakdown (Qphe), (B) phenylalanine hydroxylation to tyrosine (Qpt), (C) whole body protein synthesis (Qphe_Qpt). Data are presented as median (CI).
Forearm Protein Kinetics
The net muscle protein loss (net balance of phenylalanine = NBphe, µg/min) and the muscle protein breakdown (phenylalanine rate of appearance = Raphe, µg/min) were unaltered after disease control. Forearm muscle protein synthesis (phenylalanine rate of disappearance = Rdphe, µg/min) tended to decrease after disease control (P = .122) (Table 4).
Whole body and muscle protein kinetics before (pre) and after (post) disease control
| Pre | Post | P-value | |
|---|---|---|---|
| Urine nitrogen excretion (g/day) | 13.2 (10.6; 15.8) | 14.1 (11.3; 16.9) | .388 |
| Urea flux, Qurea (µmol/kg/h) | 5.58 (5.41; 5.74) | 5.69 (5.52; 5.85) | .149 |
| Blood flow (ml(100 mL/min) | 2.42 (1.99; 2.85) | 1.94 (1.53; 2.36) | .082 |
| Muscle phenylalanine balance (µg/min) | −1.18 (−1.62; −0.73) | −1.43 (−1.87; −0.98) | .371 |
| Muscle phenylalanine Rd (µg/min) | 2.01 (1.14; 2.87) | 0.98 (0.12; 1.85) | .122 |
| Muscle phenylalanine Ra (µg/min) | 2.89 (1.91; 3.88) | 2.34 (1.35; 3.32) | .437 |
Isotopic 15N-phenylalanine was used in the forearm to investigate the phenylalanine netbalance, protein synthesis (Rd), and degradation (Ra) in skeletal muscle. Data are presented as median (CI).
Protein Metabolic Signaling Signatures in Skeletal Muscle
The mRNA expression of IGF-I was downregulated after disease control (P = .002), accompanied by a downregulation of CISH (P = .016) and SOCS2 (P = .001). Phosphorylation of mTOR and the downstream target 4EB-P1 were unaltered after disease control. ULK1 phosphorylation increased after disease control (P = .042) (Fig. 2), and LC3 mRNA expression, a marker of autophagy activity, tended to do the same (P = .088). Disease control did not alter the mRNA expression of either P62 or Murf1, both of which are activators of protein breakdown.
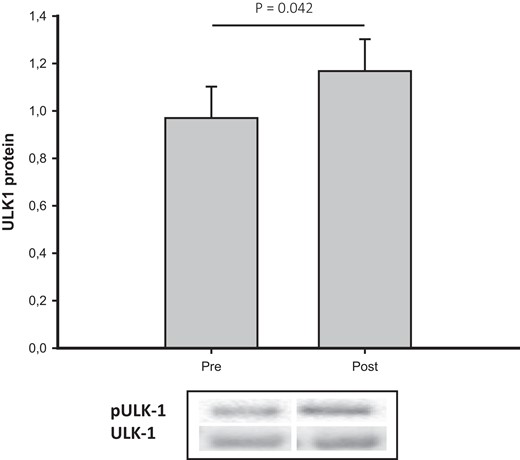
pULK-1/ULK-1 total before (pre) and after (post) disease control in acromegaly. Data are presented as median (CI).Abbreviations: ULK-1, Unc-51 like autophagy activating kinase 1.
Discussion
In the present study, we investigated protein metabolism by validated isotopic tracer techniques at the whole-body and forearm levels in concomitance with assessments of intramyocellular signaling signatures of muscle protein synthesis and breakdown in addition to estimation of body composition by DXA. Disease control in acromegaly decreased LBM accompanied by a balanced reduction in whole-body protein breakdown and synthesis without detectable concomitant alterations in forearm muscle protein turnover.
It is plausible that onset of active acromegaly prompts an initial increase in LBM, which subsequently reaches a plateau accompanied by a neutral protein balance at a higher turnover rate. This is in accordance with a previous study in acromegaly reporting a high turnover state in active acromegaly compared to both controlled disease and a control group (19). Gibney et al, however, also observed that leucine oxidation increased after short-term treatment (<6 weeks) but not after more prolonged treatment (>12 weeks) (19). In the present study, the patients had been disease controlled for least 16 weeks before undergoing the post-treatment assessment of protein metabolism. It would have added further information also to include an earlier post-treatment assessment to capture a period of ongoing changes in lean body mass.
In the current study, we also measured skeletal muscle protein kinetics across the forearm where we observed unaltered protein turnover after disease control. It is possible that organs with a high turnover, ie, liver and gut, are more susceptible to GH and account for the high flux condition. However, the discrepancy between whole-body and forearm protein turnover may also reflect low sensitivity and specificity of the forearm model, which depends on proper positioning of catheters, accurate assessment of blood flow, and the assumption that the arteriovenous substrate concentrations derive exclusively from skeletal muscle.
Previous studies have reported that GH decreases urinary urea excretion through a decrease in substrate supply, ie, increased protein synthesis or reduced breakdown, rather than urea synthesis per se (10, 11). We did not observe any effect of GH on either urea flux or excretion, which may indicate that amino acids are redistributed rather than catabolized in the high turnover state.
Circulating and local IGF-I constitute important GH-dependent anabolic signals in addition to GH itself together with secondary elevations in insulin (32, 33). The direct effect of GH is ascribed to stimulation of protein synthesis, whereas the most prominent effect of IGF-I and insulin is suppression of proteolysis (34, 35). Active acromegaly was associated with hyperinsulinemia, which may add to the suppressive effect on proteolysis. However, one study in acromegalic patients suggested that GH inhibits the insulin-dependent suppression of proteolysis (20), which has also been observed across the forearm (2). In the present study, it was not possible to discriminate between the effects of GH, IGF-I, and insulin, but the combination of GH and IGF-I has been shown to act synergistically as regards anabolism (36). Somatostatin analogues exert effects beyond suppression of GH secretion including suppression of insulin secretion (37–40), which was also evident in the present study as previously reported (21). However, subanalysis showed no impact of treatment modality on protein metabolism (data not shown), which may support that differences in insulin levels played a minor protein metabolic role in the present study. It is likely that the moderate suppression of insulin secretion was counterbalanced by suppression of glucagon.
Data from in vitro models and rodents suggest that GH affects the intramyocellular signaling cascades controlling protein synthesis and degradation (41, 42). Prolonged GH infusion in humans has been reported to increase mTOR phosphorylation (43), a key activator of protein synthesis (44), which is dependent on insulin-stimulated protein kinase B kinase activity (45), but in the present study we could not confirm an effect of GH on the level of mTOR. However, we did observe a GH-induced suppression of the autophagy-lysosome pathway at the level of ULK-1 suggestive of a GH-induced suppression of autophagy.
In the present study, we observed that LBM-adjusted REE was 14% higher in patients with active disease, which is in accordance with previous studies (46, 47). Interestingly, REE also increases after acute GH administration (48, 49), ie, before any change in LBM. LBM is indeed the most important REE determinant, but it has also been reported that resting muscle energy metabolism exhibits wide interindividual variation and accounts for a major part of residual REE variation (50). Thyroid function is a recognized determinant of resting energy expenditure, and we did observe elevated levels of triiodothyronine in patients with active disease (unpublished data) in accordance with the fact that GH stimulates the extra thyroidal conversion of thyroxine to triiodothyronine in a dose-dependent manner (48). In addition, cardiac output and blood flow at the whole-body level are elevated in active acromegaly, which may contribute to an LBM-independent increase in REE (51).
We observed a 7% decrease in LBM after disease control. This may on the one hand imply that the observed differences in turnover rates are overestimated in terms of differences in metabolic active tissue. However, adjusting protein kinetics for LBM did not affect the results. On the other hand, LBM does not provide an accurate estimation of metabolic active muscle mass as it includes the sum of all lean compartments, organs, and tissues except bone including extracellular water (52) of which the latter is increased in active acromegaly (52, 53). A recent study assessing active muscle mass (body cell mass) by means of total body potassium counting observed an increase in body cell mass in active acromegaly, which did not translate into an increase in muscle strength (54). As evident from the present study, disease control in acromegaly induces a less favorable metabolic phenotype in terms of decreased LBM and increased fat mass, which merits awareness in the follow-up of acromegaly.
Taken together, active acromegaly in the present study was associated with increased LBM in conjunction with a parallel increase in protein breakdown and synthesis indicative of a steady-state condition. The nature of the increased LBM in active acromegaly merits further scrutiny including studies of muscle fiber composition, size, and number in addition to the contribution of collagen formation. The latter is of particular relevance since GH treatment preferentially induces collagen formation in human subjects as GH stimulates the collagen synthesis in human tendon and skeletal muscle without affecting myofibrillar protein synthesis (55).
Acknowledgments
The authors thank Hanne Pedersen, Lone Kvist, Lisa Buus, Kirsten Nyborg Rasmussen, Lenette Pedersen, and Helle Zibrandtsen for excellent technical assistance during the study.
Funding
This work was supported by a grant from the Independent Research Fund, Denmark (7016-00303A) and Merck; the Grant for Growth Innovation.
Disclosures
J.O.L.J. and J.D. have received consultant fees and unrestricted research grants from Novartis, IPSEN, and Pfizer. M.C.A.S. has received lecture fees from IPSEN and Pfizer. The other authors have nothing to declare.
Data Availability
The dataset generated and analyzed during the current study is available from the corresponding author on request.
Clinical Trials Registration
NCT00647179.
