


Abstract
The neutral amino acid transporter SLC7A10/ASC-1 is an adipocyte-expressed gene with reduced expression in insulin resistance and obesity. Inhibition of SLC7A10 in adipocytes was shown to increase lipid accumulation despite decreasing insulin-stimulated uptake of glucose, a key substrate for de novo lipogenesis. These data imply that alternative lipogenic substrates to glucose fuel continued lipid accumulation during insulin resistance in obesity.
We examined whether increased lipid accumulation during insulin resistance in adipocytes may involve alter flux of lipogenic amino acids dependent on SLC7A10 expression and activity, and whether this is reflected by extracellular and circulating concentrations of marker metabolites.
In adipocyte cultures with impaired SLC7A10, we performed RNA sequencing and relevant functional assays. By targeted metabolite analyses (GC-MS/MS), flux of all amino acids and selected metabolites were measured in human and mouse adipose cultures. Additionally, SLC7A10 mRNA levels in human subcutaneous adipose tissue (SAT) were correlated to candidate metabolites and adiposity phenotypes in 2 independent cohorts.
SLC7A10 impairment altered expression of genes related to metabolic processes, including branched-chain amino acid (BCAA) catabolism, lipogenesis, and glyceroneogenesis. In 3T3-L1 adipocytes, SLC7A10 inhibition increased fatty acid uptake and cellular content of glycerol and cholesterol. SLC7A10 impairment in SAT cultures altered uptake of aspartate and glutamate, and increased net uptake of BCAAs, while increasing the net release of the valine catabolite 3- hydroxyisobutyrate (3-HIB). In human cohorts, SLC7A10 mRNA correlated inversely with total fat mass, circulating triacylglycerols, BCAAs, and 3-HIB.
Reduced SLC7A10 activity strongly affects flux of BCAAs in adipocytes, which may fuel continued lipogenesis during insulin resistance, and be reflected in increased circulating levels of the valine-derived catabolite 3-HIB.
Altered adipose tissue function, in close association with systemic insulin resistance, adipocyte hypertrophy, local and systemic low-grade inflammation and ectopic lipid accumulation, contributes to chronic metabolic diseases such as type 2 diabetes and cardiovascular diseases (1–4). New insight into the cellular and molecular processes underlying lipid storage and insulin resistance may enable novel strategies for prevention and therapy. Mature white adipocytes store excess energy primarily as triacylglycerols (TAG) (5), and fatty acids (FAs) required for TAG synthesis are sourced from exogenous FA uptake (6) and de novo lipogenesis (7). While approximately 60% of glycerol for TAG synthesis in the liver comes from pyruvate (8), TAG synthesis in adipocytes largely depends on glyceroneogenesis, a process functionally similar to hepatic gluconeogenesis (9, 10). Activity of pyruvate carboxylase (PC), phosphoenolpyruvate carboxykinase (PCK1/PEPCK), and other glyceroneogenic enzymes expressed in adipocytes can drive glycerol formation from, for example, lactate, pyruvate, and other TCA cycle intermediates, which partly also depends on the availability and metabolism of specific amino acids (11–14).
Metabolomic analyses have revealed altered circulating concentrations of amino acids and metabolites related to insulin resistance (15), including the branched-chain amino acids (BCAAs; leucine, isoleucine, and valine). Genetic variants associated with insulin resistance modulate BCAA catabolic pathways, and activation of BCAA catabolism has been shown to improve insulin sensitivity and lipid metabolism in rats and mice (16). Moreover, variants associated with BCAA catabolic pathways are associated with an increased risk of type 2 diabetes (17, 18). Elevated circulating BCAA levels partly depend on the loss of steps in BCAA catabolism and/or downregulation of enzymes responsible for BCAA oxidation in adipose tissue (15, 19–22). Increased catabolism of BCAAs during adipogenesis is associated with lipid accumulation (23, 24) and suggests that these essential amino acids provide carbon for lipid and/or glycerol synthesis (25). Altered blood concentrations of BCAA-related metabolites have been found to reflect metabolic changes and mediate insulin resistance, and an increased extracellular concentration of 3-hydroxyisobutyrate (3-HIB) (26), a valine catabolite, is shown to be strongly associated with insulin resistance and type 2 diabetes (27). Higher 3-HIB levels reflect adipocyte lipid accumulation, and also directly influence core metabolic processes in white as well as brown adipocytes (27).
Our recent studies revealed the sodium independent amino acid transporter SLC7A10 (also known as ASC-1), carrying small neutral amino acids such as serine, glycine, and alanine, as a novel player regulating adipocyte lipid accumulation and metabolism in obesity and insulin resistance (28, 29). SLC7A10 mRNA expression in adipose tissue is highly heritable and correlates inversely with risk alleles in the KLF14 type 2 diabetes risk locus; it is strongly associated with insulin resistance and adipocyte hypertrophy (30). In human primary and mouse 3T3-L1 adipose cultures, SLC7A10 impairment reduced serine uptake, production of the antioxidant glutathione, mitochondrial respiration, and insulin-stimulated glucose uptake, and increased reactive oxygen species generation and lipid accumulation (28). Another study, inhibiting the amino acid carrier in cultured human deep neck white adipocytes, confirmed reduction in serine uptake, but also found significantly reduced uptake of cysteine, glycine, and alanine compared to controls (31). SLC7A10 has recently also been implicated in thermogenesis and regulation of metabolism in different adipocyte subtypes (31–34). Therefore, understanding the effects of perturbed SLC7A10 activity in adipocytes in more detail may elucidate cellular and molecular pathways underlying the development of unhealthy adipose tissue expansion and insulin resistance. In particular, studying the means by which SLC7A10 inhibition promotes lipid accumulation while suppressing insulin-stimulated glucose uptake can identify alternate carbon sources for lipogenesis in adipocytes. Additionally, identifying circulating biomarkers that reflect these cellular changes may allow earlier detection of adipose-dependent development of insulin resistance.
In the present study, we examine changes in amino acid metabolism that may drive lipid accumulation in conditions of reduced insulin-stimulated glucose uptake, by profiling changes in the flux of amino acids and related metabolites in human adipocytes with and without pharmacologic inhibition of SLC7A10 activity. The clinical relevance of SLC7A10-dependent changes in the metabolism of BCAAs and other amino acids is supported by clinical cohorts showing strong correlations between adipose SLC7A10 mRNA, circulating amino acid and 3-HIB concentrations, adiposity traits, and systemic insulin resistance.
Materials and Methods
Ethics Approval
The study was approved by the relevant ethics committees (Regional Committee for Medical and Health Research Ethics (REC) West, Norway (Western Norway Obesity Biobank (WNOB), project 2010/502); REC North, Norway (MyoGlu, project 2011/882); and the Ethics Committee of the Helsinki University Central Hospital, Finland (Dnro 270/13/03/01/2008)). All study participants/sample donors gave written informed consent.
Cell Cultures
Human primary adipose cultures and adipogenesis
Human liposuction aspirates were collected with informed consent from the abdomen of donors operated at Plastikkirurg1 and Aleris medical center in Bergen, Norway. The donors were 10 women and 1 man, aged 21 to 68 years (mean ± SD; 46.3 ± 13.0), with body mass index (BMI) between 24 and 33 kg/m2 (28.5 ± 2.6) (Supplementary Table S1) (35). Following overnight incubation at 4 °C, subcutaneous liposuction aspirate was heated to 37 °C, the stromal vascular fraction (SVF) was isolated, and the cultures were differentiated as previously described (28, 36).
Murine cell line cultures and adipogenesis
Preparation, culturing, and differentiation of mouse 3T3-L1 preadipocytes was performed using standard protocols described in detail previously (27).
RNA Sequencing
RNA was isolated using RNeasy kit (QIAGEN) and cDNA-sequencing was performed using the Illumina HiSeq2000 platform. Reads were aligned using HiSat (Version 2.1.0), matrixed in featureCounts (Version 1.5.2) and analyzed using DESeq2 (Version 1.22.2) as described previously (28).
Gene Set Enrichment Analysis
For gene set enrichment analysis (GSEA), 47 gene sets for relevant metabolic processes were compiled from the publicly available databases KEGG (37), Reactome (38), Brenda (39), and HumanCyc (40) (Supplementary Dataset 1) (35). Using RNA sequencing data for vehicle (DMSO) and SLC7A10 inhibitor-treated human primary adipocytes, using the highly selective SLC7A10 inhibitor BMS-466442 (referred to as SLC7A10 inhibitor) (41, 42), we generated a ranked list of genes by multiplying -log10 (adjusted P) value with the sign of fold change (+ for log2FC > 0 and—for log2FC < 0) (28). Eight gene sets with fewer than 10 input genes were removed based on a minimum threshold of genes required per gene set. The remaining 39 gene sets were analyzed for enrichment using R package ՙfgsea՚ (version 1.14.0) and results were adjusted for multiple testing using false discovery rate (Benjamini-Hochberg method).
Western Blotting
Cells were lysed in RIPA buffer (Thermo Fisher Scientific) supplemented with PhosStop (Sigma Aldrich), EDTA, sodium orthovanadate and protease inhibitor cocktail (Roche). The DC protein assay (Bio-Rad) was used to measure protein concentration in cell lysates, and equal amounts of sample lysate (15-30 µg) were loaded onto 4% to 20% TGX gels (Bio-Rad) and resolved by sodium dodecyl sulfate–polyacrylamide gel electrophoresis (SDS-PAGE). Proteins were then transferred to a nitrocellulose membrane, which was blocked using 5% fatty acid-free milk or BSA. The following antibodies were used: β-actin (1:5000, Abcam, ab6276, AB_2223210), HIBCH (1:200, Sigma Aldrich, HPA036541, AB_2675182), and HRP goat anti-mouse IgG secondary antibody (1:7500, BD Biosciences, 554002, AB_395198) and HRP goat anti-rabbit IgG secondary antibody (1:10000, Thermo Fischer Scientific, 31460, AB_228341). Femto solution (Thermo Scientific) was used to produce luminescence, and densitometry was performed to calculate target protein amount relative to endogenous controls (β-actin).
Metabolite Analyses
Medium from cell cultures was collected at 48-hour intervals, and amino acid and related metabolite levels in medium were measured by gas chromatography–tandem mass spectrometry (GC-MS/MS) based on methyl chloroformate derivatization at Bevital AS (43). The method has been upgraded to include additional metabolites by adding ion-pairs for these analytes and authentic isotope-labeled internal standards to the existing assay. The within- and between-day coefficient of variation for the assay ranged from 0.7% to 4.5% and 1.1% to 4.7%, respectively. The measured concentrations were used to calculate the influx and efflux of amino acids and metabolites relative to the unconditioned medium.
Lipid Staining
Oil-red-O (ORO) staining was used to assess intracellular neutral lipid accumulation in cultured mature adipocytes (44). Intracellular ORO content was quantitated by measuring optical density absorbance at 500 nm using a spectrophotometer (SpectraMax PLUS384).
Fatty Acid Uptake and Intracellular Content of Glycerol and Cholesterol
Spectrophotometry-based kits were applied at 37 °C according to the manufacturer's protocols. For FA uptake (MAK156; Sigma Aldrich), 100 mL/well of Fatty Acid Dye Loading Solution was added, and data were normalized to cell number/well using Hoechst staining. For glycerol (J3150, Promega) and cholesterol (J3190, Promega) content, data were normalized to DNA content per well.
Hoechst Staining
Hoechst staining was performed by fixing cells in PBS containing 8% formaldehyde and Hoechst staining dye (1 µg/mg) for a minimum of 1 hour. Subsequently, cell counts were obtained by counting of nuclei using a BD Pathway 855 (BD Bioscience) microscope and CellProfiler software.
DNA Quantification
Double-stranded DNA (dsDNA) content per well was measured using QuantiFluor ONE dsDNA system (E4870, Promega) according to the manufacturer's protocol.
Human Cohorts
The MyoGlu study
The MyoGlu study was a controlled clinical exercise intervention trial (Clinical Trials Registration: NCT01803568) in sedentary (<1 exercise session/week) in men aged 40 to 65 years of Scandinavian origin, performed in 2011–2012 in Oslo, Norway and is described in detail previously (45). The dysglycemic group (n = 11) had fasting glucose ≥5.6 mmol/L and/or 2-hour glucose ≥7.8 mmol/L and BMI 27 to 32 kg/m2 (Supplementary Table S2) (35). Subjects with known hypertension, liver or kidney disease, chronic inflammatory disease, or on any medication expected to affect glucose metabolism (lipid-lowering, antihypertensive, aminosalicylic acids, corticosteroids, etc.) were excluded. The control group (n = 13) of normoglycemic men of healthy weight had fasting glucose <5.6 mmol/L and 2-hour oral glucose tolerance test (OGTT) <7.8 mmol/L and without a family history of diabetes, and BMI 20.9 to 26.7 kg/m2 (Supplementary Table S2) (35). Insulin sensitivity was measured by hyperinsulinemic euglycemic clamp, and body composition and fatty liver were analyzed by magnetic resonance imaging and proton magnetic resonance spectroscopy (MRI/MRS). Plasma amino acid concentrations were measured by liquid chromatography–tandem mass spectrometry (LC-MS/MS), and plasma 3-hydroxyisobutyrate (3-HIB), α-ketoglutarate, and glycine concentrations by GC-MS/MS (43) at Bevital AS. The mRNA from subcutaneous adipose tissue (SAT) was isolated and cDNA was deep sequenced using Illumina Hi-Seq 2000 (46). cDNA reads were aligned using Tophat v2.0.8. and quantified using HTSeq v0.6.1p.
Twin cohorts
A subset of 12 female and 7 male monozygotic twin pairs discordant for BMI (within-pair difference of BMI ≥ 3 kg/m2, n = 19 twin pairs; aged 22-36 years) were included from 2 population-based twin cohorts, FinnTwin16 (FT16) (47) and FinnTwin12 (FT12) (48) (Supplementary Table S3) (35). A BMI difference of BMI ≥ 3 kg/m2 translates to a 10 kg difference in body weight. In monozygotic twins, this was shown to exhibit significant within-twin pair differences in several clinical measures related to cardiometabolic health (49). Clinical data, adipose tissue transcriptomics, and serum metabolite data were obtained as described previously (49, 50). Briefly, body composition was assessed using dual-energy x-ray absorptiometry, abdominal subcutaneous and visceral adipose tissue volume was assessed by MRI, and liver fat percentage determined by MRS. Biochemical analytes were analyzed in fasting samples, including serum metabolites quantified by a high-throughput NMR metabolomics platform. In addition, Matsuda index was calculated from oral glucose tolerance tests (OGTT). The mRNA from the SAT biopsies was isolated and cDNA was sequenced using the Illumina HiSeq2000 platform. The cDNA reads were aligned using STAR v2.5.2b and quantified using HTSeq v0.6.1p.
Statistics
Results from cell culture experiments were assessed by a box and whiskers Tukey test to identify and discard outliers. Two-tailed unpaired Student t test was used to assess statistically significant differences between groups in cell culture assays. Correlations in the MyoGlu cohort were calculated by Spearman's rank correlation test. Differences between anthropometric and metabolic traits between twin pairs were assessed using matched- pairs signed-rank test for continuous variables. Regression analysis in twin individuals was performed using a linear model analysis (R package lme4). Metabolite levels and clinical traits were used as dependent variables, SLC7A10 mRNA expression as an independent variable, and twinship as a random factor with adjustment for age, sex, and BMI. Regression models for delta values calculated between lean and heavy twins were not adjusted for BMI to preserve the study design. For all experiments statistical details and the number of biological samples (n) are provided in the figure legends; n annotates the number of parallel wells per treatment in cell experiments and the number of patients in clinical cohorts.
Results
SLC7A10 Inhibition Increases Cellular Levels of Lipids and Glycerol in Adipocytes
We previously showed that pharmacological inhibition of SLC7A10 activity promotes lipid accumulation while suppressing insulin-stimulated glucose uptake in cultured primary human and 3T3-L1 mouse adipocytes, along with profound effects on global gene expression, including key lipid markers, TCA cycle, and glycolysis genes (28). We here investigated SLC7A10 inhibitor-induced effects on lipid metabolism more extensively. Short-term (24-hour) treatment of mature 3T3-L1 adipocytes with SLC7A10 inhibitor reduced intracellular glycerol content compared with controls (Fig. 1A), while there were no significant shorter-term differences in cellular fatty acid (FA) uptake or cholesterol content (Fig. 1A). On the other hand, more persistent reduction in SLC7A10 activity during differentiation increased all these measures significantly (Fig. 1A), suggesting a broad effect on lipid synthesis and storage.

SLC7A10 inhibition increases cellular levels of lipids and glycerol in adipocytes. Mouse 3T3-L1 preadipocytes and human primary adipose cultures were induced to differentiate for 8 days, and effects of pharmacological SLC7A10 inhibition on specific metabolic pathways were examined by functional assays (A) and gene expression analysis (RNA sequencing) (B-C). Global gene expression from human adipose cultures treated with DMSO or SLC7A10 inhibitor (BMS-10 µM) for 24 hours (days 7–8) was measured by RNA sequencing (n = 6 pairs of DMSO vs inhibitor from donors 1–6) (B-C). A, 3T3-L1 preadipocytes were treated with DMSO (control) or SLC7A10 inhibitor (BMS-10 µM) for short-term (days 7-8) and long-term (days 2-8) periods during adipogenic differentiation. Effect of SLC7A10 inhibition on fatty acid uptake (n = 18–20) and the intracellular content of glycerol (n = 16–20) and cholesterol (n = 16–18) are measured as described in the methods. Data are presented as median ± IQR. B, Gene set enrichment analysis (GSEA) based on gene sets of relevant metabolic pathways sourced mainly from Reactome and KEGG. The distribution of up- and downregulated genes are shown within the entire RNA sequencing dataset ranked by signed fold change multiplied by −log10(-P value) (the top-scoring up- and downregulated genes at the outer left and outer right, respectively). Pathways with significant enrichment of top-scoring genes for up- and downregulated genes combined are shown here. C, mRNA expression of the GSEA leading edge genes in selected processes (including classical adipogenic markers/transcription factors) are shown, with indication of significance levels from the RNA sequencing analysis adjusted for multiple testing. Data are presented as median ± IQR. Abbreviations: FA, fatty acid; FDR, false discovery rate; NES, normalized enrichment score; TF, transcription factor. *, P < 0.05; **, P < 0.01; ***, P < 0.001.
To uncover mechanisms contributing to the SLC7A10 inhibitor-mediated increase in fat storage in further detail, we examined effects of SLC7A10 inhibition on pathways of lipid and energy metabolism in human primary adipocyte cultures, using targeted GSEA with 47 manually curated comprehensive gene sets related to lipid and energy metabolism/substrate utilization. Consistent with the functional data, the transcriptome analysis showed significant enrichment of upregulated mRNAs in processes such as glycerophospholipid metabolism, TCA cycle, cholesterol biosynthesis, FA uptake, and TAG synthesis and catabolism (Fig. 1B-C). Key transcription factors known to regulate many of these genes were also upregulated (Fig. 1C).
Amino Acids Fuel Adipocyte Glyceroneogenesis and Lipid Biosynthesis
The reduced insulin-stimulated glucose uptake previously observed following SLC7A10 inhibition in mature cultured human and mouse adipocytes (28) suggests that carbon sources other than glucose contributed to increased TAG formation and lipid accumulation (7). In human primary adipocyte cultures, short-term inhibition during mid-differentiation upregulated key genes involved in glyceroneogenesis (eg, PC and PCK1) as well as glycerophospholipid metabolism (Fig. 2A and 2B). FAs, cholesterol, and glycerol can be synthesized de novo in fat cells using amino acids as precursors via the TCA cycle (51) (Supplementary Fig. S1) (35). To assess whether amino acid catabolism provided precursors fueling lipogenesis when SLC7A10 activity was reduced, we analyzed gene sets related to the metabolism of all the major amino acids using GSEA. The analysis revealed a significant enrichment of upregulated genes in the metabolism of BCAA, and to a lesser extent for metabolism of phenylalanine and tyrosine, aspartate and asparagine, and lysine (Fig. 3A).
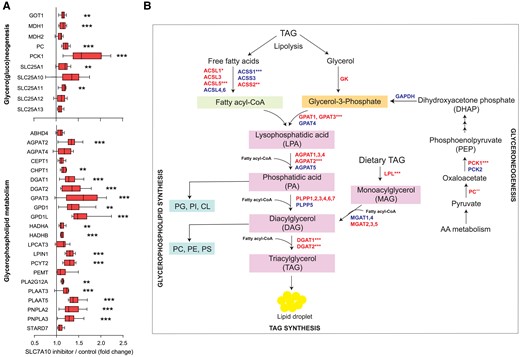
SLC7A10 inhibition upregulates genes involved in glyceroneogenesis and glycerophospholipid metabolism. Human primary adipose cultures were induced to differentiate for 8 days and treated with DMSO (control) or SLC7A10 inhibitor (BMS-10 µM) for 24 hours (days 7-8). Effects on specific metabolic pathways were examined using RNA sequencing (n = 6 pairs of DMSO vs SLC7A10 inhibitor from donors 1-6). A, mRNA expression of the GSEA leading edge genes for glycero(gluco)neogenesis and glycerophospholipid metabolism with indication of significance levels from the RNA sequencing analysis adjusted for multiple testing. Data are presented as median ± IQR. B, Schematic overview of glycero(gluco)neogenesis and glycerophospholipid metabolism. Red color indicates upregulated genes and blue color indicates downregulated genes. *, P < 0.05; **, P < 0.01; ***, P < 0.001.
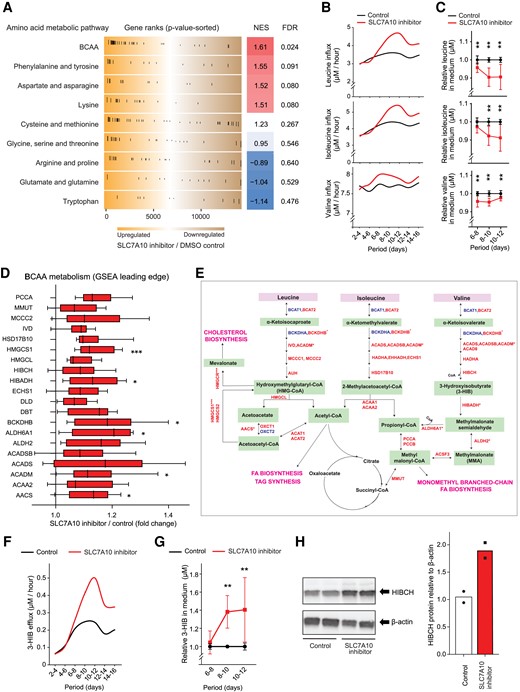
SLC7A10 inhibition in adipocytes increases BCAA consumption and release of 3-hydroxyisobutyrate. Human primary adipose cultures were induced to differentiate and effects of pharmacological SLC7A10 inhibition on amino acid (AA) metabolic pathways and fluxes were examined by gene expression analysis, GC-MS/MS, and Western blotting. A, Global gene expression was measured by RNA sequencing after treating the adipose cultures with either DMSO (control) or SLC7A10 inhibitor (BMS-10 µM) for 24 hours (days 7-8) (n = 6 pairs of DMSO vs SLC7A10 inhibitor from donors 1–6). Gene set enrichment analysis (GSEA) based on genes in AA pathways obtained mainly from Reactome and KEGG. The distribution of up- and downregulated genes is shown within the entire RNA sequencing dataset ranked by signed fold change multiplied by −log10(-P value) (the top-scoring up- and downregulated genes at the outer left and outer right, respectively). B, Average net hourly flux of BCAA for 48 hours was calculated by subtracting the concentrations in conditioned from concentrations in matched unconditioned medium, divided by 48 (n = 2 for a representative experiment, donor 9). C, Medium concentrations measured in duplicate were calculated for each 48-hour period normalized to the DMSO control. Data are presented as mean ± SD (n = 5 individuals for days 6-8 and 10-12, donors 7-11 and n = 3 individuals for days 8-10, donors 9-11). D, mRNA expression of the GSEA leading edge genes in the BCAA pathways are shown, with indication of significance levels from the RNA sequencing analysis adjusted for multiple testing. Data are presented as median ± IQR. E, Simplified schematic overview of the BCAA catabolic pathway. Red color indicates upregulated genes and blue color indicates downregulated genes by SLC7A10 inhibitor found by RNA sequencing. F, Average net hourly flux of 3-HIB for 48 hours was calculated by subtracting the concentrations in conditioned from concentrations in matched unconditioned medium, divided by 48 (n = 2 for a representative experiment, donor 9). G, Medium concentrations measured in duplicate were calculated for each 48-hour period normalized to DMSO (control) and relative values per period are shown. Data are presented as mean ± SD (n = 5 individuals for days 6-8 and 10-12, donors 7-11 and n = 3 individuals for days 8-10, donors 9-11). H, Protein levels of HIBCH (top) and the quantitative values of HIBCH relative to β-actin in human primary adipose culture treated with DMSO (control) or SLC7A10 inhibitor (BMS-10 µM) from days 3-12 during adipogenic differentiation and assayed on day 12. Data are represented as individual points (n = 2 from a representative experiment, donor 11). Abbreviation: BCAA, branched-chain amino acids. *, P < 0.05; **, P < 0.01; ***, P < 0.001.
To obtain more direct evidence of altered amino acid consumption, we next performed targeted metabolite analysis of all amino acids throughout differentiation of primary human adipose cultures from 5 different donors, to determine whether the SLC7A10 inhibition-mediated transcript changes may have translated into altered amino acid consumption. In line with the RNA sequencing data showing upregulated genes in BCAA metabolic pathways, the hourly uptake was increased for all 3 BCAAs when SLC7A10 activity was impaired (Fig. 3B), particularly in mid-to-late differentiation (Fig. 3C). Further analysis of the GSEA data from human primary adipocytes showed that the 20 leading edge genes in BCAA metabolism category included 7 significantly upregulated genes, encoding the catabolic enzymes AACS, ACADM, ACADSB, ALDH6A1, BCKDHB, HIBADH, and HMGCS1 (Fig. 3D and 3E). 3-hydroxyisobutyrate (3-HIB), a metabolite in the valine catabolic pathway implicated in adipocyte lipid accumulation and insulin resistance (27), showed a substantial efflux upon SLC7A10 inhibition during differentiation (Fig. 3F), with significant changes observed for days 8 to 12 in cultures from 5 different donors (Fig. 3G). In line with the increase in 3-HIB efflux, protein expression of the rate-limiting 3-HIB-forming enzyme HIBCH, which removes the CoA from 3-HIB-CoA, was higher in differentiated human primary adipocytes after longer-term SLC7A10 inhibition compared to control (Fig. 3H).
SLC7A10 Inhibition Affects Serine, Alanine, Aspartate, and Glutamate Flux and Catabolism in Human Adipocytes
To examine whether amino acids other than the BCAAs may have contributed to fuel the observed increase in lipid accumulation in SLC7A10-impaired cells, not necessarily reflected in gene expression changes, we screened the medium collected throughout differentiation of cultured adipocytes from 5 different human donors for changes in the remaining 17 natural amino acids. We found no significant effects of SLC7A10 inhibition on any amino acids during the first 4 days of differentiation (Supplementary Fig. S2) (35). This is in line with substantial increases in SLC7A10 expression during later stages of adipocyte differentiation (28). Serine levels in the medium were, as shown previously (28), increased in response to SLC7A10 impairment most notably from days 8 to 12 of adipocyte differentiation, reflecting decreased uptake (Fig. 4A, Supplementary Fig. S2) (35). The small neutral amino acid alanine, earlier reported to be transported by SLC7A10 in the opposite direction to serine (29), showed reduced efflux from day 8 to 16 of adipogenesis (Fig. 4A, Supplementary Fig. S2) (35).

SLC7A10 inhibition alters aspartate, glutamate, and α-ketoglutarate flux during differentiation of human primary adipocytes. Human primary adipose cultures were induced to differentiate and effects of pharmacological SLC7A10 inhibition on amino acid (AA) fluxes were examined by collecting culture medium every 48 hours, and its amino acid concentrations measured by GC-MS/MS. A, B, F, Medium concentrations measured in duplicate were calculated for each 48-hour period normalized DMSO (control) and relative values per period are shown. Data are presented as mean ± SD (n = 5 individuals for days 6-8 and 10-12, donors 7-11 and n = 3 individuals for days 8-10, donors 9-11). C, E, mRNA expression of the GSEA leading-edge genes in the indicated pathways are shown, with indication of significance levels from the RNA sequencing analysis adjusted for multiple testing. Data are presented as median ± IQR. D, Simplified schematic overview of amino acid metabolism related to the TCA cycle components oxaloacetate and α-ketoglutarate. Red color indicates upregulated genes and blue color indicates downregulated genes. *, P < 0.05; **, P < 0.01; ***, P < 0.001.
Interestingly, the cells switched from releasing more to taking up more aspartate throughout differentiation, and this switch was accentuated in the inhibitor-treated cells leading to more pronounced aspartate uptake than observed for controls (Supplementary Fig. S2) (35). The increased aspartate uptake was seen until day 12, followed by another switch to decreased uptake during days 12 to 16 (Fig. 4B, Supplementary Fig. S2) (35). Glutamate followed a similar pattern to that observed for aspartate, although without the initial decrease in uptake during day 4 to 6 (Fig. 4B, Supplementary Fig. S2) (35). These data indicate dynamic changes in the utilization of aspartate and glutamate in the metabolic situation of increased lipid accumulation and decreased insulin-stimulated glucose uptake upon SLC7A10 inhibition during adipogenesis. Both of these nonessential amino acids are precursors of the TCA cycle intermediates oxaloacetate and α-ketoglutarate, respectively (Supplementary Fig. S1) (35) and may have contributed to fueling glyceroneogenesis and FA synthesis. Looking back into our GSEA analysis of the RNA sequencing data, we found that 10 leading edge genes drove enrichment of the serine metabolism (Fig. 3A), where ALAS1, AOC2, DMGDH, and GRHPR were significantly upregulated (Fig. 4C). For aspartate and asparagine metabolism (Fig. 3A), there were 6 leading edge genes, including the significantly upregulated ASPA, GOT1, and NAT8L (Fig. 4C and 4D). Although no changes in the fluxes of phenylalanine and tyrosine were observed with SLC7A10 inhibition, enrichment of the metabolic pathway for these amino acids (Fig. 3A) was driven by 5 leading edge genes, including the significantly upregulated genes QDPR, GOT1, FAH, and AOC2 (Fig. 4C). Moreover, the gene encoding GLS, the enzyme that converts glutamine to glutamate, was strongly downregulated in response to SLC7A10 inhibition (Fig. 4E), and the medium concentration of α-ketoglutarate was markedly reduced in cultured adipocytes from 5 different donors (Fig. 4F), suggesting increased consumption of this TCA metabolite. Taken together, these data indicate that impaired SLC7A10 function exerts potent effects on TCA cycle activity linked to amino acid uptake and metabolism, representing mechanisms that contribute to accelerated lipid accumulation.
SLC7A10 mRNA in SAT Is Reduced in Dysglycemia and Correlates Inversely With Body fat Mass and Plasma Amino Acid Levels
We next sought to corroborate the link between adipocyte SLC7A10, body fat distribution, and amino acid metabolism in vivo. We first compared SLC7A10 mRNA in SAT from the MyoGlu study (46) between participants with normoglycemia and dysglycemia (n = 26) (45). SAT SLC7A10 mRNA expression was significantly lower in dysglycemic compared with normoglycemic participants (Fig. 5A). We found medium to strong inverse correlations between SAT SLC7A10 mRNA and BMI, total body fat mass, and fat mass of most adipose depots, as well as circulating leptin and TAG levels and TAG/high-density lipoprotein (HDL) ratio (a surrogate marker of insulin resistance) (Fig. 5B). Interestingly, similar inverse correlations were observed between SAT SLC7A10 mRNA and all the 3 BCAAs, 3-HIB, phenylalanine, and tyrosine, whereas insulin sensitivity (M value assessed using euglycemic clamp) was positively associated with SLC7A10 expression, although not significantly (Fig. 5B and 5C).
![SLC7A10 mRNA expression in subcutaneous adipose tissue correlates with adiposity, insulin resistance–related metabolic traits and circulating amino acid metabolites in vivo. Subcutaneous adipose tissue (SAT) was collected from people with or without dysglycemia in the MyoGlu study (baseline values, n = 26) and from BMI-discordant monozygotic twin pairs (n = 19 pairs). A, MyoGlu participants were divided into 2 groups: normoglycemia (NG), and dysglycemia (DG) based on the glucose infusion rate measured during hyperinsulinemic euglycemic clamp (n = 26). SLC7A10 expression was measured in SAT by mRNA sequencing and compared between both the groups. Data (RPKM normalized counts) are presented as median ± IQR. B-C, SAT SLC7A10 mRNA expression was correlated to adiposity traits and insulin resistance–related metabolic traits, as well as amino acids and amino acid metabolites. Data are presented as Spearman (rho) correlation coefficients (unadjusted), outlined circles indicate statistically significant correlations (P < 0.05). D, SAT SLC7A10 expression was measured in BMI-discordant monozygotic twin pairs by mRNA sequencing. Data (trimmed mean of M value [TMM] normalized counts) are presented with matched lines within twin pairs (n = 19). E, Association in twin individuals between SAT SLC7A10 mRNA expression and adiposity traits, insulin resistance–related metabolic traits and select amino acids was assessed using linear-mixed models adjusted for age, sex, twinship, and BMI. Data are plotted as standardized beta regression coefficients with standard error (β±SE), outlined circles indicate statistically significant correlations. F, Circulating amino acid levels of leucine, isoleucine, phenylalanine, and tyrosine measured in BMI-discordant monozygotic twin pairs by nuclear magnetic resonance (NMR) metabolomics are presented here with matched lines within twin pairs (n = 19). *, P < 0.05; ***, P < 0.001.](https://oup.silverchair-cdn.com/oup/backfile/Content_public/Journal/jcem/108/9/10.1210_clinem_dgad148/1/m_dgad148f5.jpeg?Expires=1750281508&Signature=cyEHTaojYpZ0vChf3ppZCyGE1yqilHnMwsBSN4FmFzQcrIEYZZhSnqeHCw9bszK2lgRQkd0e4NtqO~1U3iI3sVABC9ycdrubwNvE8cbVhuRBQiv11uBHPCF6VN3AXYXq~xlxvPSUEeasvwN2eYnz7tSMbv-NXJowNrVuFtG9kUrNw8s8piw7xiAL3UuOlfqWwrDg2po8VwoqMYjfbM9v8xdUikGXQCY~4KuXJg0bYZvQFL5TtihB4GvFBvsLFkT7lSf6nbZUbTosOEMwddwW7QDhrUp0C7TMIwbM-nklSXOo9t0P~dQrYRMtxs5R9mvPz-VRSN9MXj8LiLQ50mCwig__&Key-Pair-Id=APKAIE5G5CRDK6RD3PGA)
SLC7A10 mRNA expression in subcutaneous adipose tissue correlates with adiposity, insulin resistance–related metabolic traits and circulating amino acid metabolites in vivo. Subcutaneous adipose tissue (SAT) was collected from people with or without dysglycemia in the MyoGlu study (baseline values, n = 26) and from BMI-discordant monozygotic twin pairs (n = 19 pairs). A, MyoGlu participants were divided into 2 groups: normoglycemia (NG), and dysglycemia (DG) based on the glucose infusion rate measured during hyperinsulinemic euglycemic clamp (n = 26). SLC7A10 expression was measured in SAT by mRNA sequencing and compared between both the groups. Data (RPKM normalized counts) are presented as median ± IQR. B-C, SAT SLC7A10 mRNA expression was correlated to adiposity traits and insulin resistance–related metabolic traits, as well as amino acids and amino acid metabolites. Data are presented as Spearman (rho) correlation coefficients (unadjusted), outlined circles indicate statistically significant correlations (P < 0.05). D, SAT SLC7A10 expression was measured in BMI-discordant monozygotic twin pairs by mRNA sequencing. Data (trimmed mean of M value [TMM] normalized counts) are presented with matched lines within twin pairs (n = 19). E, Association in twin individuals between SAT SLC7A10 mRNA expression and adiposity traits, insulin resistance–related metabolic traits and select amino acids was assessed using linear-mixed models adjusted for age, sex, twinship, and BMI. Data are plotted as standardized beta regression coefficients with standard error (β±SE), outlined circles indicate statistically significant correlations. F, Circulating amino acid levels of leucine, isoleucine, phenylalanine, and tyrosine measured in BMI-discordant monozygotic twin pairs by nuclear magnetic resonance (NMR) metabolomics are presented here with matched lines within twin pairs (n = 19). *, P < 0.05; ***, P < 0.001.
To validate these findings and assess the relative genetic and environmental contributions to the associations, we additionally investigated SAT SLC7A10 expression in rare monozygotic twin pairs discordant for BMI (n = 19) and found significantly lower SLC7A10 mRNA expression in heavy compared to lean co-twins (Fig. 5D). Consistent with the MyoGlu cohort, we found strong significant inverse associations in twin individuals between SAT SLC7A10 expression and total, visceral, and hepatic fat, plasma glucose and insulin levels, homeostatic model assessment of insulin resistance (HOMA-IR), C-reactive protein, circulating TAG, TAG/HDL, and total and low-density lipoprotein cholesterol. The Matsuda index, reflecting whole body insulin sensitivity, and HDL-C were positively associated with SAT SLC7A10 expression (Fig. 5E). When investigating the differences within each BMI-discordant twin-pair (delta values of heavy-lean co-twins), delta SAT SLC7A10 mRNA correlated with deltas for visceral fat and clinical traits related to insulin resistance such as HOMA-IR and TAG/HDL, suggesting a strong environmental regulation of these clinical phenotypes (Supplementary Fig. S3) (35). Also consistent with the MyoGlu cohort, plasma levels of the BCAAs leucine, isoleucine, phenylalanine, and tyrosine showed strong significant negative correlations with SLC7A10 mRNA levels (Fig. 5E and 5F). Overall, we observed an inverse association between SLC7A10 expression and measures of body fat and clinical phenotype traits linked to insulin resistance, including plasma amino acid levels and the type 2 diabetes–associated valine catabolite 3-HIB.
Discussion
Our study provides new insights into substrate utilization and mechanisms underlying lipogenesis and fat storage in adipose tissue in conditions of impaired insulin-stimulated glucose uptake (considered a primary lipogenic substrate). We find that SLC7A10 impairment alters adipocyte flux and metabolism of several amino acids, most notably BCAAs, but also serine, alanine, aspartate, and glutamate. These changes are associated with effects on adipocyte FA uptake and intracellular glycerol and cholesterol levels. The physiological importance of SLC7A10-dependent alterations in adipocyte amino acid metabolism was supported by observations of strong inverse correlations between adipose SLC7A10 mRNA expression and adiposity and cardiometabolic risk traits, as well as with circulating amino acid levels in human cohorts.
A primary finding is the augmented BCAA influx upon inhibition of SLC7A10, which is not characterized as a BCAA transporter, during mid-to-late stages of differentiation, along with upregulation of BCAA catabolic enzymes and increased lipid accumulation. Our observations in cultured human primary adipocytes expand on previous knowledge of increased uptake and catabolism of the BCAAs during adipocyte differentiation in mouse adipocytes, fueling lipogenesis (23–25, 27, 52). Importantly, we provide novel data suggesting that the marked increase in BCAA catabolism contributed to increased fat storage during decreased insulin-stimulated glucose uptake in adipocytes. Differentiation of 3T3-L1 adipocytes was previously shown to involve a switch from consumption of glutamine and glucose to increased BCAA consumption in association with increased branched-chain fatty acid synthesis (24). Notably, during adipocyte differentiation, BCAA oxidation products appear to almost exclusively provide carbons for lipid synthesis as opposed to protein synthesis (52). Enhanced generation of amino acid catabolic intermediates (eg, propionyl-CoA and succinyl-CoA) can also shift their fate toward FA synthesis rather than beta-oxidation (53). Moreover, studies in 3T3-L1 adipocytes have shown that leucine and isoleucine account for 25% of the lipogenic acetyl-CoA, while valine and isoleucine contribute to 100% of propionyl-CoA that is used for lipogenesis (25). Of note, the BCAA catabolic enzyme BCKDH can generate high levels of mitochondrial reactive oxygen species (ROS) (54), linking our previous finding that SLC7A10 inhibition increases ROS generation (28) to an increase in BCAA breakdown. Given the possible causal role of increased ROS levels in lipid accumulation (55), such an effect of augmented BCAA catabolism on ROS might have also contributed to the higher lipid accumulation in adipocytes with impaired SLC7A10 function.
Concomitant with the increased lipid accumulation and BCAA catabolism, we found a novel link between SLC7A10 expression/function, and adipocyte release and plasma levels of 3-HIB, a valine catabolite. Although the rate-limiting enzyme for 3-HIB formation, HIBCH, did not show a significant change in mRNA expression, its protein expression was highly increased by SLC7A10 inhibition, uncovering a mechanism that could underlie the increased circulating 3-HIB observed in obesity and insulin resistance. The clinical importance of the valine degradation pathway and 3-HIB is supported by recent in vivo data linking high plasma 3-HIB levels to adiposity, prediabetes, and type 2 diabetes (27, 56). 3-HIB has also been shown to have potential paracrine functions, increasing the uptake of FAs in endothelial cells from skeletal muscle (26) and in adipocytes (27). In line with our findings, a study of intestinal epithelial cells from piglets showed a 3-HIB-mediated upregulation of proteins involved in fatty acid transport and synthesis, accompanied by an increase in TAG synthesis and lipid droplet formation (57). Thus, increased 3-HIB production may have contributed to higher FA uptake and lipid storage with SLC7A10 inhibition.
We also found that inhibition of SLC7A10 during adipocyte differentiation increased the total intracellular glycerol content. TAG synthesis in adipocytes largely depends on glyceroneogenesis (9, 10) where glycerol is synthesized de novo using pyruvate formed from amino acids and lactate (11–13). Consistently, mRNA expression for PC and PCK1 (PEPCK), key enzymes determining the rate of glyceroneogenesis (58, 59), were upregulated by SLC7A10 inhibition in primary human adipocytes. Different amino acids may have fueled glyceroneogenesis through pyruvate in our experiments. Although serine and alanine can be converted to pyruvate, reduced intracellular availability of these amino acids due to SLC7A10 inhibition suggests alternative substrates. In addition to reduced uptake of serine and alanine, Arianti and colleagues observed decreased uptake of cysteine, glycine, and threonine in SLC7A10-inhibited human deep neck area-derived adipocytes (31). We did not observe changes in the flux of these amino acids during SLC7A10 impairment, which could be explained by our human primary adipocytes being derived from abdominal subcutaneous fat and not deep neck tissue. Our data also show that SLC7A10 impairment affected medium concentrations of aspartate, glutamate, and α-ketoglutarate, which are linked to the biosynthesis of glycerol as well as lipids in adipocytes via the TCA cycle (60). Finally, although we observed no changes in tyrosine and phenylalanine flux in the in vitro differentiated human primary adipocytes, we found an enrichment of genes involved in the metabolism of these amino acids, as well as strong correlations between their circulating levels and adipose SLC7A10 mRNA in humans in vivo. Both tyrosine and phenylalanine are precursors for acetoacetyl-CoA (a substrate for cholesterol biosynthesis) and fumarate (a TCA cycle intermediate). Along with BCAAs, circulating levels of phenylalanine and tyrosine show associations with HOMA-IR (61, 62). A recent analysis from the METSIM study found elevated plasma levels of these aromatic amino acids to be associated with insulin resistance and low insulin secretion in type 2 diabetes, along with the other amino acids (BCAAs, aspartate, glutamate, and alanine) identified in our study (63).
Furthermore, we observed increased mRNA expression of enzymes required for the synthesis of glycerophospholipids, which are essential for the formation of lipid droplets and their expansion (64). Additionally, we found that SLC7A10 inhibition increased adipocyte cholesterol content. Cholesterol is essential for the maintenance of cell membrane structure and function as well as the formation of lipid droplets (65). Previous studies in rats show that de novo synthesis of cholesterol in adipocytes is as low as only 4% compared to that of liver (66). However, we observed a significant upregulation of enzymes involved in cholesterol biosynthesis in human adipocytes along with increased cholesterol content as measured in 3T3-L1 adipocytes after SLC7A10 inhibition. Adipocyte cholesterol content, largely incorporated in cell membranes, correlates positively with fat cell size and is highly proportional to adipocyte triglyceride content (67), which is in line with our previously reported findings linking reduced adipose SLC7A10 expression to increased adipocyte hypertrophy (28).
The alterations in BCAA metabolism upon SLC7A10 inhibition may be relevant for mechanisms affecting adipocyte beiging and thermogenesis, as BCAA metabolism has been implicated in brown adipocyte thermogenesis (32). Suwandi et al showed that Slc7a10 knockdown increased the expression of brown/beige markers (68), while Arianti and coworkers proposed that Slc7a10 may be important for brown adipocyte function (31). Although the present transcriptome analysis did not show any indications of altered adipocyte beiging upon SLC7A10 inhibition, further studies designed to explore the role of SLC7A10 perturbations in adipocyte beiging via altered amino acid metabolism should be performed.
Notably, a link between BCAAs and SLC7A10 transporter activity was reported in neurons, where D-isoleucine was shown to enhance SLC7A10-mediated release of serine and glycine, in turn affecting the activity of the N-methyl D-aspartate (NMDA) glutamate receptor (69). Adipose tissues express genes involved in neurotransmitter signaling (70), including NMDA receptors as shown in multipotent stromal cells from human adipose tissue (71). A possible link to NMDA receptors in adipose tissue could also be relevant for the potent effect we observed of SLC7A10 inhibition on glutamate transport.
Ongoing discussions regarding the role of carbohydrates and insulin in the development of adipocytes and obesity (72) underscore the importance of better understanding lipid storage mechanisms. In this regard, our study contributes with new mechanistic insights by elucidating potential amino acid-related mechanisms involved in lipid accumulation in the context of reduced insulin-stimulated glucose uptake in adipocytes. However, the study has limitations. Suwandhi and coworkers found D-serine accumulation in mouse preadipocytes with perturbed Slc7a10 function (32), but we were in this study not able to assess effects on intracellular amino acid concentrations or to separate between the D- and L-stereoisomers of the amino acids. Studies with radiolabeled amino acids could provide more direct evidence for the conversion of specific amino acids into TCA cycle intermediates and their subsequent incorporation into lipids and lipid droplets in adipocytes. The increased uptake of α-ketoglutarate, an important cofactor for enzymes regulating chromatin modifications (51), could also be further explored in relation to the large effect of SLC7A10 inhibition on adipocyte gene expression. Additionally, more research is needed to reveal the mechanisms by which SLC7A10 inhibition increases BCAA uptake and catabolism, and to describe how this relates to evidence of decreases in specific steps of BCAA catabolism in adipose tissue of humans with insulin resistance (46, 53, 62).
Conclusion
In conclusion, our data detailing SLC7A10-dependent gene expression and metabolite changes in human adipocytes and adipose tissue provide new insights into the mechanisms of continued lipid accumulation during insulin resistance. In particular, the increased uptake and catabolism of BCAAs during mid-to-late stages of adipocyte differentiation after SLC7A10 inhibition suggests that lipid accumulation during diminished insulin-stimulated glucose uptake involves diverting catabolism of BCAA and other amino acids toward FA and TAG synthesis, with efflux of 3-HIB as a potential measurable marker of these obesogenic processes.
Acknowledgments
We thank the patients/study participants for providing samples and data, and all the organizations that funded our research. We thank Laurence Lawrence-Archer for support with gene expression analyses and Christian Busch at Plastikkirurg1 for providing access to human liposuction aspirate.
Funding
We acknowledge the support from the Research Council of Norway (263124/F20), the Western Norway Regional Health Authority, the Norwegian Diabetes Association, the Trond Mohn Foundation, and NovoNordisk Scandinavia AS. We also acknowledge the support from the Academy of Finland, grant numbers 335443, 314383, 272376, 266286; the Finnish Medical Foundation; the Gyllenberg Foundation; the Novo Nordisk Foundation, grant numbers NNF20OC0060547, NNF17OC0027232, NNF10OC1013354; the Finnish Diabetes Research Foundation; University of Helsinki; Government Research Funds; and Helsinki University Hospital. The MyoGlu study was supported by grants from the University of Oslo, the Southeastern Regional Health Authorities, the Anders Jahre's Foundation for Medical Research, EU-financed FP7 project (NutriTech grant agreement no: 289511), the Freia Medical Research Foundation and the Johan Throne-Holst Foundation for Nutrition Research.
Author Contributions
R.Å.J., D.S.P.T., L.S., and S.N.D. designed the study, carried out the experiments, analyzed and interpreted results, and wrote the manuscript. M.S.B. assisted with experiments. S.L-Ø., K.I.B., and C.D. conducted the MyoGlu study, and S.L-Ø. analyzed the data. S.H. and K.H.P. contributed to sample/data collection in the twin cohorts; M.A. and P.P. to generation and analysis of RNA-seq data; and M.M. and K.H.P. to the design, transcriptomics and metabolite data analysis, and interpretation for these cohorts. A.M. performed metabolite analyses. S.N.D. and G.M. facilitated the laboratory work. All authors reviewed and edited the manuscript. S.N.D. is the guarantor of this work and had full access to all the data in the study and takes responsibility for the integrity of the data and the accuracy of all the analyses.
Disclosure
The authors declare no competing interests.
Data Availability
The datasets generated and/or analyzed during the present study are available from the corresponding author upon reasonable request and the RNA sequencing data are deposited in the National Center for Biotechnology Information (NCBI) Gene Expression Omnibus (GEO) (accession number GSE135156).
References
Abbreviations
- 3-HIB
3-hydroxyisobutyrate
- BMI
body mass index
- FA
fatty acid
- GC-MS/MS
gas chromatography–tandem mass spectrometry
- HDL
high-density lipoprotein
- HOMA-IR
homeostatic model assessment of insulin resistance
- LDL
low-density lipoprotein
- MRI
magnetic resonance imaging
- MRS
magnetic resonance spectroscopy
- NMDA
N-methyl D-aspartate
- PC
pyruvate carboxylase
- PCK1
phosphoenolpyruvate carboxykinase (PEPCK)
- ROS
reactive oxygen species
- SAT
subcutaneous adipose tissue
- TAG
triacylglycerol
Author notes
These authors contributed equally.
