


Abstract
Enteroendocrine N cells secrete neurotensin (NTS). NTS reduces food intake in rodents and may increase insulin release. In humans, postprandial NTS responses increase following Roux-en-Y gastric bypass, associating the hormone with the glucose- and body weight-lowering effects of these procedures.
We looked at N cell density and mucosal messenger RNA (mRNA) expression profiles of NTS and NTS receptors in type 2 diabetes (T2D) patients and healthy controls.
Using double-balloon enteroscopy, 12 patients with T2D and 12 sex-, age-, and body mass index–matched healthy controls had mucosa biopsies taken from the entire length of the small intestine (at 30-cm intervals) and from 7 anatomically well-defined locations in the large intestine. Biopsies were analyzed using immunohistochemistry and mRNA sequencing.
N cell density and NTS mRNA expression gradually increased from the duodenum to the ileum, while negligible NTS-positive cells and NTS mRNA expression were observed in the large intestine. NTS receptor 1 and 2 mRNA expression were not detected, but sortilin, a single-pass transmembrane neuropeptide receptor of which NTS also is a ligand, was uniformly expressed in the intestines. Patients with T2D exhibited lower levels of NTS-positive cells and mRNA expression than healthy controls, but this was not statistically significant after adjusting for multiple testing.
This unique intestinal mapping of N cell density and NTS expression shows increasing levels from the small intestine's proximal to distal end (without differences between patients with T2D and healthy controls), while negligible N-cells and NTS mRNA expression were observed in the large intestine. Sortilin was expressed throughout the intestines in both groups; no NTS receptor 1 or 2 mRNA expression were detected.
Neurotensin (NTS) is a 13 amino acid-peptide hormone released by enteroendocrine N cells in response to intraluminal lipids (1). NTS has been shown to regulate digestion of lipids, modify gut inflammatory responses, and promote gut mucosal healing (1). Based on studies in which NTS-deficient mice experienced less body weight gain when fed a high-fat diet than wild-type mice, NTS has been proposed to increase absorption and storage of fat (2). Further, NTS stimulates exocrine pancreatic secretion facilitating lipid digestion in rats (3). NTS may also influence glucose homeostasis as some studies have shown it to stimulate pancreatic insulin and glucagon release (4-6).
In humans, postprandial NTS responses increase after Roux-en-Y gastric bypass (RYGB) surgery (7, 8) associating the hormone with the beneficial effects of RYGB on glucose homeostasis and body weight. Interestingly, Jorsal et al (7) found NTS to be the most upregulated gene in small intestinal mucosal biopsies sampled after RYGB (vs preoperative). Furthermore, high circulating levels of the NTS precursor, pro-neurotensin, is associated with reduced spontaneous eating in rats, and treatment with an NTS receptor (NTSR) antagonist increased appetite in RYGB-operated rats alluding to NTS as a contributor to the appetite-reducing effect of RYGB (9). Furthermore, treatment of obese mice with an NTS analogue and the glucagon-like peptide 1 analogue liraglutide showed synergistic food intake, body weight, and glucose-lowering effects of the 2 compounds (10).
Current knowledge of the intestinal distribution of N cells originates from animal studies and from human gut specimens sampled sporadically from patients with various gastrointestinal pathologies or post mortem (11-13). From these studies, it appears that the highest number of N cells is found in the distal small intestine with lower numbers in the jejunal mucosa and only very few N cells in the duodenum and colon across species (with the exemption of mice showing considerable NTS radio-immunoactivity in the proximal colon (13)). To our knowledge, mucosal expression patterns of NTS have not previously been systematically evaluated in healthy individuals or in patients with type 2 diabetes (T2D).
NTS acts via two G protein–coupled receptors, NTSR1 and NTSR2, and sortilin (SORT1), a single-pass transmembrane neuropeptide receptor (14). NTSR2 is widely expressed in the brain and in the spinal cord but has not been found elsewhere (15). NTSR1 has previously been linked to intestinal stem cell proliferation as a nutrient-dependent regulator in drosophilae and rats (16), and messenger RNA (mRNA) expression has been detected in the large intestine of humans (15). SORT1 has previously been detected in various tissues including the brain and the gastrointestinal tract in deceased humans (14, 15). Based on in vitro and animal studies, NTSR1 and SORT1 seem to be involved in fatty acid absorption (2) and have been proposed to play roles in excess fat-induced weight gain and metabolic dysfunction (17). The expression pattern of the 3 NTSRs through the human intestinal tract has not previously been investigated.
To map the distribution of N cells and expression of NTSRs in the mucosal layer of the human small and large intestines and to better understand NTS’ potential role in T2D pathophysiology, we here subjected gut mucosal biopsies sampled with regular intervals along the entire intestinal tract from patients with T2D and matched healthy individuals to immunohistochemistry and N cell counting as well as expression analysis of NTS, NTSR1, NTSR2, and SORT1.
Materials and Methods
Participants
Gut mucosal biopsies collected by Rhee et al (18) from patients with T2D (n = 12) and healthy sex-, age-, and body mass index (BMI)-matched controls (n = 12) were examined. The inclusion criteria for patients with T2D were diagnosis of T2D at least 3 months prior, diabetes management using lifestyle counseling alone or in combination with metformin or sulfonylurea, White ethnicity, age older than 25 and younger than 70 years, negativity to glutamic acid decarboxylase and islet cell autoantibodies, and informed oral and written consent. Key exclusion criteria included use of glucose-lowering drugs other than metformin and sulfonylurea, use of medicine that could not be withheld for 12 hours, BMI greater than 35, and any condition that would contraindicate propofol sedation or enteroscopy. For healthy controls, inclusion criteria were normal fasting plasma glucose and 75-g oral glucose tolerance test, White ethnicity, and age older than 25 and younger than 70 years, and exclusion criteria were identical to those for participants with T2D with the addition of no first-degree relatives with type 1 or T2D (18).
Experimental Procedures
This study was approved by the scientific-ethical committee of the Capitol Region of Denmark on August 17, 2011 (journal No. H-3-2010-115) and was registered with clinicaltrials.gov (NCT03044860) and the Danish Data Protection Agency. The study conformed to the latest revision of the Declaration of Helsinki; all individuals agreed to participate and gave oral and written consent. Detailed procedures for the 2 experimental days were previously described by Rhee et al (18). In short, anterograde double-balloon enteroscopy was performed and subsequently, on another experimental day, a retrograde double-balloon enteroscopy was performed. Both procedures were performed under propofol sedation with an EN-450 T5 enteroscope from Fujinon Inc. Any antidiabetic agents were withheld for a week before each of the experimental days. On the first experimental day, when anterograde progression was no longer possible, the maximal scope depth was marked submucosally with ink. Two mucosal biopsies were then collected every 30 cm during scope retraction. Biopsies from areas of the duodenum, Treitz ligament, and the ileocecal transition were marked 1, 2, and 10, respectively (Fig. 1). On the second experimental day, retrograde progression aiming to reach the ink mark (or until no longer possible) was undertaken and biopsies were collected during withdrawal at every 30 cm of the small intestine and at the cecum [11], ascending [12], transverse [13], descending [14] and sigmoid large intestine [15], and the rectum [16] (see Fig. 1). The number of biopsy locations between Treitz ligament and the ileocecal transition was variable and was divided equally into 7 small intestinal segments corresponding to locations 3 through 9 in Fig. 1.
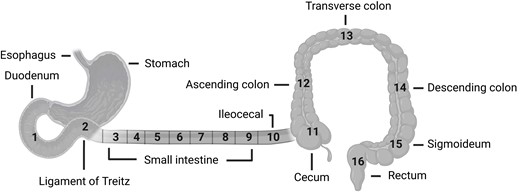
Anatomical locations of biopsy sampling sites 1 to 16. Samples from the small intestine were collected at an interval of 30 cm and divided into 7 groups (3-9). The other samples (10-16) were collected from anatomically well-defined areas. Illustration created with BioRender.com.
Immunohistochemistry
A biopsy from every site was immediately fixated in 4% formaldehyde and embedded in paraffin. Incubations with the primary antibody (obtained from J. J. Holst, University of Copenhagen; anti-NTS, catalog No. 3D97, RRID: AB_2909426; diluted 1:10.00; pH 9) were performed. Then, to amplify the reaction, the sections were incubated for 40 minutes with biotinylated secondary antibody immunoglobins (goat anti-rabbit; BA-1000, Vector Laboratories, diluted 1:200). After this, the sections were treated with preformed avidin and biotinylated horseradish peroxidase macromolecular complex (ABC) (code No. PK-4000, Vector Laboratories) for 30 minutes. Finally, the reaction was developed using 3,3-diaminobenzidine (KEM-EN-TEC, catalog No. 4170) for 15 minutes, followed by a 2-minute incubation in 0.5% copper sulphate (Merck, catalog No. 2790) diluted in TRIS buffer containing 0.05% Tween and counterstained with Mayer's hemalum (Vector Laboratories). The staining was performed using an autostainer with Elite ABC and DAB+ (Vector Laboratories). This procedure leads to NTS-specific staining.
Cell Counts
Digital images of biopsy slides at 20× objective were taken using the ScanScope scanner (Aperio). The cell count and the measurement of the area of the epithelial layer were performed using the newCAST system (Visiopharm). The epithelial area was measured using a grid-and-point-counting technique. The number of immunoreactive cells counted within the epithelial area was divided by the size of the epithelial area to estimate the density of NTS-positive cells. For biopsies with less than one NTS-positive cell, a lower detection limit was set to one cell per biopsy and normalized for the average area for each biopsy. Thus, the calculated lower detection limit was 0.5 cell/mm2 of biopsy.
Gene Expression Analysis
Full mRNA sequencing of mucosal biopsies was performed. The tissue was homogenized using a TissueLyzer (Qiagen) operated with 5-mm steel beads at 28 Hz for 6 × 60 seconds. Total RNA was extracted from the lysates using NucleoSpin 96 RNA (Macherey-Nagel). Afterward, mRNA was extracted using a NucleoSpin mRNA Plus kit (Macherey-Nagel). Using a Qubit mRNA BR Assay Kit (Thermo Fisher Scientific), the quantity of the purified mRNA was measured. The quality of purified mRNA was determined with a Bioanalyzer using Agilent mRNA 6000 Nano Kit (Agilent Technology). Then, a complementary DNA library was prepared with 25 to 100 ng of purified mRNA sample using TruSeq Stranded mRNA Library Prep Kit for NeoPrep (Illumina). The sequencing of complementary DNA libraries was performed with NextSeq 500/550 high Output Kit v2 (75 cycles) (Illumina) on the NextSeq 500 platform. The gene expression level is displayed in figures as reads per kilobase of transcript per million mapped reads (RPKM). RPKM values greater than 1 are considered to reflect robust expression. A lower detection limit in RPKM was set to 0.1.
Statistical Analysis
Clinical data were summarized as numbers or means with ranges and compared between groups using Fisher exact test or t test. NTS data were visualized in box and whisker plots. To evaluate whether N cell density and expression levels of NTS, NTSR1, NTSR2, and SORT1 mRNA differed between T2D patients and healthy controls, or changed along the small and large intestines, a linear mixed model was applied with group, localization, and the interaction between them as fixed effects, with an unstructured covariance pattern to account for repeated measurements in each study participant. Only anatomical locations where at least half of the participants had nonnegligible values (> 0.1 RPKM or > 0.5 cell/mm2) were included, and the small and large intestines were analyzed separately. Owing to skewed distributions, all outcomes were log-transformed, and results were reported as relative differences in medians with 95% CI. Differences between patients with T2D and healthy controls were reported for each location separately, and differences between locations were reported with the duodenum as reference for the small intestine and the rectum as reference for the large intestine. P values were adjusted for multiple testing using the method of Benjamini and Hochberg, which controls the false discovery rate. An adjusted P value less than .05 was considered statistically significant. Data were analyzed using SAS software (SAS Studio version 3.8). The statistics are in line with the original study protocol stating that the groups should be compared using paired t tests (19) but a reformed statistical methodology is used here (19, 20).
Results
Biopsies from 12 participants with T2D (9 men; mean age 51 years; mean BMI 26.8; mean glycated hemoglobin A1c 6.5%/48 mmol/mol; mean diabetes duration 5.0 years) and 12 healthy controls (8 men [P = 1.00]; mean age 50 years [P = .66]; mean BMI 27.1 [P = .92]; mean glycated hemoglobin A1c 5.3%/34 mmol/mol [P = .008]) were subjected to analysis. Detailed participant demographics can be found in the original methodology paper (18).
N-Cell Density
In both groups of participants, the density of N cells increased throughout the small intestine with the highest amounts found in the distal ileum (up to 10-fold higher density in the distal compared to the proximal parts of the small intestine) (Fig. 2A, and Supplementary Table S1) (21). A tendency to lower N cell density in patients with T2D was observed in the distal part of the small intestine but did not reach the level of statistical significance after adjustment for multiple testing (Fig. 2A, and Supplementary Table S2) (21). Moving from the distal small intestine into the cecum, an abrupt and large drop in N-cell density was observed in both groups, and few or no cells were found in biopsies from the large intestine in any of the groups (see Fig. 2A). No morphological differences between patients with T2D and healthy controls were observed (Fig. 2F).
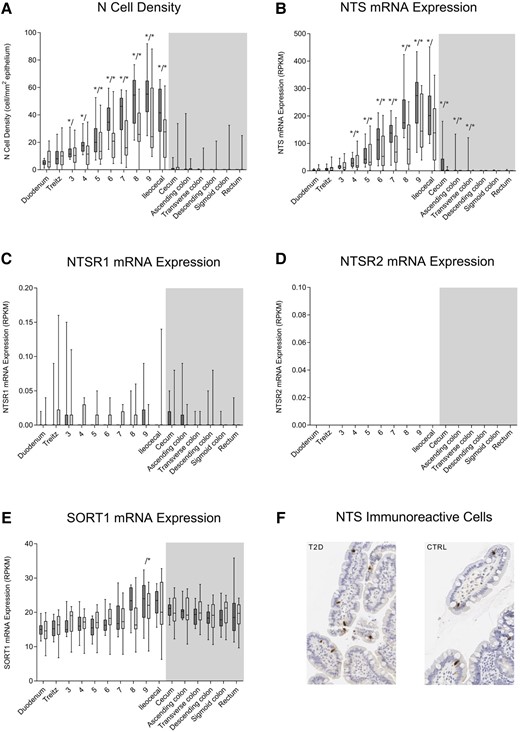
N cell density, neurotensin (NTS) messenger RNA (mRNA) expression, neurotensin receptor 1 (NTSR1) mRNA expression, neurotensin receptor 2 (NTSR2) mRNA expression, sortilin (SORT1) expression, and immunohistochemical neurotensin staining. A, N-cell density and B, mRNA expression of NTS; C, NTSR1; D, NTSR2; and E, SORT1 throughout the intestinal tract of healthy controls (CTRL) (dark bars, n = 12) and patients with type 2 diabetes (T2D) (light bars, n = 12) are depicted. No NTSR2 mRNA expression was observed. Locations in the small and large intestines are marked by white and gray background color, respectively. F, Enteroendocrine N cells in mucosal biopsies from a patient with T2D and a CTRL. Minimum to maximum ranges are shown as whiskers. An outlier (ileocecal N cell density of 275 cell/mm2) in the T2D group was omitted from plot A but kept in the analyses. No morphological differences between patients with T2D and CTRL were observed. Asterisks (left (*/) for CTRL, right (/*) for T2D) show statistically significant difference between location and reference (duodenum in small intestine and rectum in large intestine). RPKM, reads per kilobase of transcript per million mapped reads.
Expression of Neurotensin and Neurotensin Receptors
Both in patients with T2D and healthy controls, NTS mRNA expression was low in the most proximal part of the small intestine but increased gradually and significantly through the jejunum and ileum by up to almost 100-fold (Fig. 2B, Supplementary Table S3) (21). No significant differences in NTS mRNA expression in the small intestine were observed between patients with T2D and healthy controls (see Fig. 2B, Supplementary Table S4) (21). In the large intestine, NTS mRNA expression was very limited with some expression found in proximal parts of the large intestine in healthy controls (see Fig. 2B, Supplementary Table S5) (21). Expression of NTSR1 (Fig. 2C) and NTSR2 (Fig. 2D) mRNA was negligible or nonexistent throughout the intestinal tract both in patients with T2D and healthy controls. Robust and uniform expression of SORT1 mRNA was found in the small and large intestines of both groups (except for greater expression in location 9 compared to the duodenum in the T2D group) (Fig. 2E, and Supplementary Tables S6, S7, and S8) (21).
Discussion
Here we provide insights into how mucosal NTS-producing enteroendocrine cells, N cells, are distributed along the intestinal tract in patients with T2D and in matched healthy controls. We show a clear and gradual increase in the density of N cells through the small intestine ranging from less than 10 N cells per mm2 epithelium in the duodenum to more than 50 N cells per mm2 epithelium in the terminal ileum, whereas negligible numbers of N cells were observed in the large intestine, with no clear differences between the two groups. We demonstrate a similar pattern regarding expression of NTS mRNA through the small and large intestines of the two groups. The NTS receptor SORT1 was robustly expressed throughout the intestinal tract in both groups whereas no or negligible expression of NTSR1 and NTSR2 was observed.
We evaluated NTS distribution along the intestinal tract in volunteers specifically recruited for clinical examinations dedicated to investigating the distribution of enteroendocrine cells in the intestinal tract of healthy people and individuals with T2D. We used double-balloon enteroscopy to obtain high-quality fresh biopsies from the entire length of intestinal tract in living individuals, that is, from 9 anatomically specific regions and from 7 to 22 places throughout the jejunum and ileum (see Fig. 1). Because of the varying lengths of intubation and thus a varying number of biopsy sites between individuals, there is an increased uncertainty regarding biopsy locations in the jejunum and proximal ileum (see Fig. 1). To better compare results from the two groups, we divided biopsies sampled between the Treitz ligament and the ileocecal transition into 7 segments (location 3-9) (for detailed information, see our previous methodology paper (18)).
We subjected all biopsies to immunohistochemical staining for NTS and bulk mRNA sequencing. For immunohistochemical staining, we used an antibody highly specific for NTS to avoid cross-reactivity, and we counted only cells clearly located in the intestinal epithelium. Obviously, it remains speculative as to whether our mRNA findings translate to a similar pattern regarding the distribution of the NTS peptide, but the observed immunohistochemistry-based N cell density profiles along the intestinal tract support that gut expression of NTS mRNA and density of NTS-producing cells go hand in hand.
The distribution pattern of mucosal enteroendocrine N cells observed in the present study corresponds well with radioimmunoassay-assessed content of NTS in transmural tissue samples from the duodenum, proximal jejunum, distal ileum, cecum, proximal colon, and distal colon of mice, rats, dogs, and pigs (the mice, nevertheless, also show considerable content of NTS in the proximal colon) (12, 13, 22). Interestingly, in human fetuses the NTS gene is expressed in the colon at the 18th week of gestation but not one week after birth or in adulthood, where the highest degree of expression was observed in the distal ileum (the tissue samples from which these results originate were collected post mortem or during surgery for cancer) (12). Using immunohistochemistry and a radioimmunoassay based on antibodies raised in rabbits to synthetic NTS, Polak et al (11) investigated N cells and NTS content in fresh human samples from the stomach, duodenum, jejunum, ileum, and colon obtained during surgery for various disease states, and showed highest NTS levels in the ileal mucosa, with lesser amounts in the jejunal mucosa. Extractions of the wall of the stomach, duodenum, and colon showed far less NTS. Notably Polak and colleagues (11) found that N cells were restricted to the mucosa and not found in any other layers of the gut wall.
To elucidate the potential role of enteroendocrine cells, in this case N cells, in the pathophysiology of T2D, we obtained biopsies from patients with T2D and age-, sex-, and BMI-matched controls. We compared N cell density and NTS mRNA expression, respectively, in each intestinal location for the two groups. Based on raw P values, patients with T2D were characterized by a lower density of N cells in the distal portions of the small intestine, but after adjusting for multiple testing, P values were all greater than .05 (see Supplementary Table S1) (21). Larger cohorts or cohorts including more dysregulated patients and/or patients with longer T2D duration are warranted to dismiss reduced N cell density in the small intestine of patients with T2D. To our knowledge, comparisons between plasma concentrations of NTS during a meal test or during an oral glucose tolerance test in patients with T2D and healthy controls have not been reported. In contrast, circulating levels of NTS and its precursor pro-neurotensin before and after bariatric surgery are well described in obese individuals undergoing the bariatric surgical procedure RYGB, showing postoperative elevations in fasting (7, 23) as well as postprandial (14, 24) plasma levels. Additionally, Jorsal et al (7) found small intestinal mucosal NTS gene expression to be increased after RYGB. RYGB alters anatomy, resulting in ingested nutrients passing through the esophagus and a small remnant ventricle pouch directly into more distal parts of the small intestine, bypassing the duodenum and the proximal jejunum (25). Thus, the present results showing increasing density of N cells and NTS mRNA expression through the small intestine may explain why RYGB increases postprandial plasma NTS responses and substantiate small intestinal mucosal NTS as a candidate to explain the diminution of appetite, energy intake, and body weight after RYGB (14).
NTS has been shown to have multiple intestinal functions including stimulation of mucosal cell growth and healing and gut motility (1). We wanted to clarify the location of the 3 NTS receptors NTSR1, NTSR2, and SORT1 in the intestinal mucosa of healthy individuals and of patients with T2D. Both in healthy individuals and patients with T2D, NTSR1 and NTSR2 were not expressed, whereas SORT1 was robustly expressed throughout the intestinal tract. SORT1 has previously been found in various tissues including the brain and the gastrointestinal tract (15). Li et al (2) found that both NTSR1 and SORT1 were involved in fatty acid absorption in mice and human cultured intestinal cells. Our results may suggest that SORT1 constitutes the predominant intestinal NTS receptor in humans.
In conclusion, we provide the largest and most robust data set on the distribution of mucosal enteroendocrine N cells (producing NTS) and expression levels of NTS mRNA along the intestinal tract in humans to date and demonstrate 1) increasing density of N cells and expression of NTS mRNA through the small intestine with highest densities and mRNA levels in the distal ileum, 2) negligible numbers of N cells and expression of NTS mRNA in the large intestine, and 3) no clear perturbations in intestinal N cell densities or expression of NTS mRNA in individuals with T2D. We also show robust mucosal expression of the NTS receptor SORT1 throughout the human intestinal tract whereas expression of NTSR1 and NTSR2 mRNA was below the detectable limit.
Funding
This work was supported by Gentofte Hospital, University of Copenhagen and by an unrestricted grant from Overlæge Johan Boserup og Lise Boserups Legat and the Novo Nordisk Foundation.
Disclosures
The authors have nothing to disclose.
Data Availability
The data generated and analyzed in the present study are not publicly available but can be requested from the corresponding author.
Clinical Trial Information
Trial registration number (ClinicalTrials.Gov): NCT03044860 (registered February 7, 2017).
References
Abbreviations
- BMI
body mass index
- CTRL
healthy controls
- mRNA
messenger RNA
- NTS
neurotensin
- NTSR
NTS receptor
- RPKM
reads per kilobase of transcript per million mapped reads
- RYGB
Roux-en-Y gastric bypass
- SORT1
sortilin
- T2D
type 2 diabetes
