


Abstract
The Afirma® GSC aids in risk stratifying indeterminate thyroid nodule cytology (ITN). The 2018 GSC validation study (VS) reported a sensitivity (SN) of 91%, specificity (SP) of 68%, positive predictive value (PPV) of 47%, and negative predictive value (NPV) of 96%. Since then, 13 independent real-world (RW) postvalidation studies have been published.
This study's objective is to compare the RW GSC performance to the VS metrics.
Rules and assumptions applying to this analysis include: (1) At least 1 patient with molecular benign results must have surgery for that study to be included in SN, SP, and NPV analyses. (2) Molecular benign results without surgical histology are considered true negatives (TN) (as are molecular benign results with benign surgical histology). (3) Unoperated patients with suspicious results are either excluded from analysis (observed PPV [oPPV] and observed SP [oSP]) or assumed histology negatives (false positives; conservative PPV [cPPV] and conservative SP [cSP]) 4. Noninvasive follicular thyroid neoplasm with papillary-like nuclear features is considered malignant.
In RW studies, the GSC demonstrates a SN, oSP, oPPV, and NPV of 97%, 88%, 65%, 99% respectively, and conservative RW performance showed cSP of 80% and cPPV of 49%, all significantly higher than the VS except for SN and cPPV. There was also a higher benign call rate (BCR) of 67% in RW studies compared to 54% in the VS (P < 0.05).
RW data for the Afirma GSC demonstrates significantly better oSP and oPPV performance than the VS, indicating an increased yield of cancers for resected GSC suspicious nodules. The higher BCR likely increases the overall rate of clinical observation in lieu of surgery.
Thyroid cancer is the most common endocrine malignancy, with an estimated 43 800 expected new cases diagnosed in 2022 and representing the seventh most common cancer in women (1). Thyroid cancer almost always presents as a thyroid nodule, yet only 5% to 15% of thyroid nodules harbor thyroid malignancy (2). Approximately 20% to 25% of thyroid nodule aspirates result in indeterminate thyroid nodule (ITN) cytology, primarily in the Bethesda III (BIII) or IV (BIV) categories (3). The risk of malignancy of BIII and BIV ITN ranges from 6% to 40% depending on the institution and the categorization of noninvasive follicular thyroid neoplasm with papillary-like nuclear features (NIFTP) as benign or malignant (4).
Given an average risk of malignancy of approximately 25% in ITN, the Afirma® Gene Expression Classifier was developed as a molecular diagnostic test with a high negative predictive value (94% [CI, 87%-98%] across BIII and BIV nodules) designed to reliably rule out thyroid cancer in ITN and avoid unnecessary surgery (5). In 2018, the validation study (VS) of the updated Afirma Genomic Sequencing Classifier (GSC) was published. The 2018 GSC VS was based on a cohort of ITN samples collected prospectively from multiple community and academic centers for the Afirma Gene Expression Classifier (GEC) validation. All patients underwent surgery without known genomic information and were assigned a histopathology diagnosis by an expert panel blinded to all genomic information. The results showed (at a 24% cancer prevalence): sensitivity (SN) of 91% (CI, 79%-98%), specificity (SP) of 68% (CI, 60%-76%), negative predictive value (NPV) of 96% (CI, 90%-99%), and positive predictive value (PPV) of 47% (CI, 36%-58%) (6). Since then, 13 independent, single-center institution experiences utilizing the Afirma GSC have been published (7–19). A previously published meta-analysis by Vuong et al that included the Afirma GEC and GSC validation studies as well as 5 of the GSC postvalidation studies compared the respective performances and showed significantly improved performance of the Afirma GSC compared with the GEC (20). However, that analysis, as well as other recent meta-analyses of the Afirma GSC (21, 22), combine the VS data and exclude unoperated molecular benign results, which is a methodological limitation to a real-world (RW) assessment of the test performance. The primary value of the Afirma GSC is to identify molecular benign lesions in ITN and allow conservative clinical follow-up. The purpose of this meta-analysis is to compare the postvalidation, RW performance of the Afirma GSC to the VS metrics.
Methods
A Pubmed search using the search terms: (GSC OR Genomic Sequencing Classifier) OR Afirma AND Thyroid was conducted for studies published through March 2022. Key terms were explored, and we performed a “hand search” by reviewing the citations within the included studies and reviews. Figure 1 shows a Preferred Reporting Items for Systematic Reviews and Meta-Analyses (PRISMA) flow diagram describing the search process and selection of studies (23). Thirteen independent postvalidation experiences with the Afirma GSC were analyzed and data were extracted for performance in thyroid nodules with Bethesda III or IV cytology. Because in postvalidation studies not all patients undergo surgical excision of the molecularly tested index nodule, certain rules and assumptions are made for this analysis as outlined below:
At least 1 patient with Afirma GSC benign (GSC-B) results must have surgery for a study to be included in calculations of SN, SP, and NPV to mitigate the possible enhancement of these parameters by the assumption in #2 below.
In the studies referenced above, GSC-B results with benign surgical histology and those with no surgical histology are considered true negative (TN) results.
Patients with GSC suspicious (GSC-S) results that do not have surgery are analyzed in 2 ways:
They are excluded from analysis and an observed SP (oSP) and observed PPV (oPPV) is calculated.
They are considered histologically benign (false positives) generating a conservative SP (cSP) and conservative PPV (cPPV).
Noninvasive follicular thyroid neoplasm with papillary-like nuclear features (NIFTP) is considered malignant as these lesions require surgical excision to make the diagnosis and they are not categorized histologically as benign.
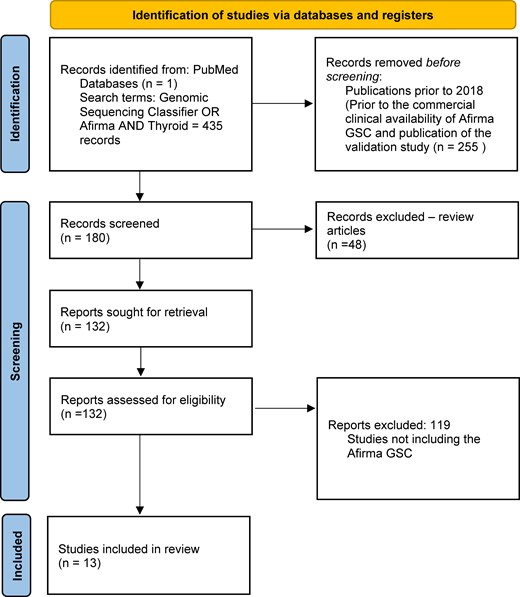
PRISMA flow diagram showing the study selection process.
San Martin et al (10) and Babazadeh et al (18) included cohorts from the same institution with 3 months of reported data collection overlap (May 2018 to September 2018). Given an inability to specify which, if any, patients had overlapping data in this brief time span, these studies were considered independent in terms of patient numbers and Afirma GSC performance. Data from all studies were pooled using a random-effects model and all analyses were performed with R package meta (version 4.18-2). Study heterogeneity was quantified using the I2 statistic. An I2 value of 0 indicates no observed heterogeneity between the meta-analyzed data. The degree of heterogeneity is considered to be low with a value of 26% to 50%, moderate with a value of 51% to 75%, and high with a value of >75% (24). A summary receiver operating characteristic (SROC) plot was generated to compare the accuracy of the postvalidation Afirma GSC experience to the validation study using R package meta version 0.5.10. 95% CIs of SN, SP, PPV, NPV, and benign call rate (BCR) were calculated based on the exact binomial Clopper-Pearson method.
Results
Livhits et al (14) had 5 subjects who were lost to follow-up and were excluded from the analysis of that study. Wei et al (11) and Gortakowski et al (15) had NIFTP reclassified as malignant for the purposes of this analysis. As no patients with ITN and GSC-B molecular result were described as going to surgery in the studies of Wei et al (11) and Babazadeh et al (18), those studies were excluded from analysis of SN, SP, and NPV.
A total of 1976 patients with ITN were included in this analysis. Of the 1325 patients with GSC-B results, 77 had surgical histopathology (6% [CI, 4.6%-7.2%]). Of the 651 patients with GSC-S samples, 505 had surgical histopathology (78% [CI, 74%-81%]). Figure 2 shows the percentage of results that are Afirma GSC-B, or the benign call rate (BCR), SP, oPPV, and percentage of patients who underwent surgery for all postvalidation studies. The SN and NPV are shown for the 11/13 studies that qualified for these analyses. The SN, SP, NPV, and oPPV along with the 95% CI for qualified studies are shown in Fig. 3. Heterogeneity for each metric is shown as well: Fig. 3A (SN) shows an I2 = 0% [0%; 60%], P = 1.00; Fig. 3B (SP) shows an I2 = 63% [30%; 81%], P < 0.01; Fig. 3C (NPV) shows an I2 = 0% [0%; 60%], P = 1.00; and Fig. 3D (oPPV) shows an I2 = 79% [64%; 87%], P < 0.01. Using meta-regression analysis, 6 factors were examined to explore heterogeneity in SP and oPPV, including publication year, Bethesda III percentage, cancer prevalence, percentage of patients operated, sample size, and BCR. Percentage of patients operated is significantly associated (P < 0.01) with heterogeneity in specificity, while cancer prevalence is significantly associated (P < 0.01) with heterogeneity in oPPV. After excluding studies with extreme values in percentage of patients operated, the I2 for SP dropped to 49% [0%; 76%], P = 0.05, while maintaining high SP at 85.5%. After excluding studies with extreme values in cancer prevalence, the I2 for oPPV dropped to 44% [0%; 75%], P = 0.09, while maintaining high oPPV at 58.8%. Table 1 summarizes the comparative meta-analysis data of the postvalidation studies to the clinical validation study, including the BCR, and shows the 95% CI for each metric. When unoperated GSC-S are excluded from analysis, the SN is not statistically significantly improved (97.2% vs 91.1%) and the SP (87.7% vs 68.3%), oPPV (64.9% vs 47.1%), and NPV (99.5% vs 96.1%) are all statistically significantly improved comparing RW to VS metrics. When unoperated GSC-S are considered as benign (false positives), specificity remains statistically significantly improved (80.4% vs 68.3%) and cPPV is not statistically different from the validation study PPV (49.3% vs 47.1%). Figure 4 shows the RW SN, SP (oSP and cSP), PPV (oPPV and cPPV), and NPV compared with the validation studies as described in Table 1 and depicts the BCR in the postvalidation RW studies of 67% (CI, 65%-69%) that is statistically higher than in the validation study (54% [CI, 47%-61%]). Figure 5 shows the SROC curve, bivariate 95% CI region, and area under the curve (AUC) for performance of the GSC RW studies as well as the performance of the validation study. The closer the SROC curve is to the top left-hand corner of the plot, the better the overall accuracy of the test. The postvalidation RW studies show consistently lower false positive rate (higher specificity) than the validation study.

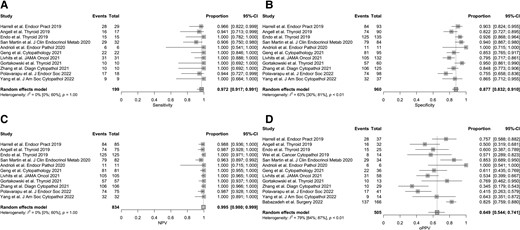
The SN, oSP, NPV, and oPPV are shown for qualified studies. Additionally, the random-effects model indicating the heterogeneity of the studies for each calculation as described by the I2 value. An I2 value of 0 indicates no observed heterogeneity, 26% to 50% represents low heterogeneity, 51% to 75% indicates moderate heterogeneity, and >75% is high heterogeneity.
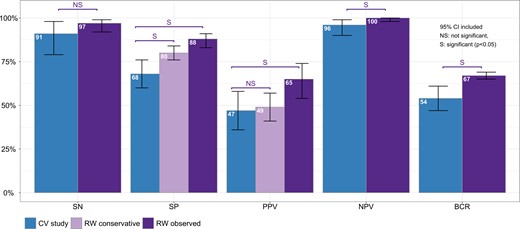
Performance analysis of the Afirma GSC RW studies compared to the VS, including the 2 methods of calculating SP and PPV (observed and conservative) as well as the BCR in the RW compared with the VS.
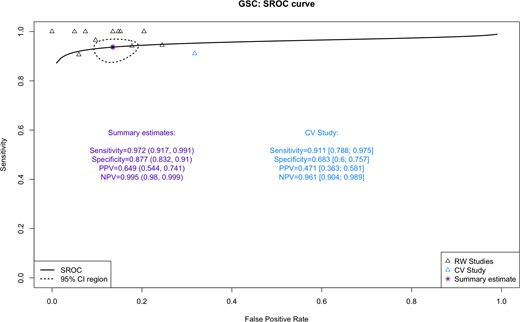
The SROC curve for the “observed” data from GSC postvalidation studies and validation study are shown. The closer the SROC curve is to the top left-hand corner of the plot, the better the overall accuracy of the test. The AUC (area under the curve) measure the classification performance, the higher the better.
Performance analysis of the Afirma GSC RW studies compared to the validation study when excluding unoperated GSC-S lesions or considering them benign
| Validation study | Meta-analysis excluding validation study GSC-S unoperated excluded | Meta-analysis excluding validation study GSC-S unoperated considered benign | Postvalidation vs CV P value of difference GSC-S unoperated excluded | Postvalidation vs CV P value of difference GSC-S unoperated considered benign | |
|---|---|---|---|---|---|
| Sensitivity | 0.911 (0.788, 0.975) | 0.972 (0.917, 0.991) | 0.972 (0.917, 0.991) | 0.122 | 0.122 |
| Specificity | 0.683 (0.6, 0.757) | 0.877 (0.832, 0.91) | 0.804 (0.759, 0.842) | 3.09e-06 | 0.004 |
| PPV | 0.471 (0.363, 0.581) | 0.649 (0.544, 0.741) | 0.493 (0.413, 0.574) | 0.019 | 0.748 |
| NPV | 0.961 (0.904, 0.989) | 0.995 (0.98, 0.999) | 0.995 (0.98, 0.999) | 0.018 | 0.018 |
| BCR | 0.542 (0.468, 0.614) | 0.669 (0.648, 0.69) | 0.669 (0.648, 0.69) | 5.608e−4 | 5.608e−4 |
Abbreviations: BCR, benign call rate; CV, coefficient of variation; GSC, Genomic Sequencing Classifier; GSC-S, GSC Suspicious; NPV, negative predictive value; PPV, positive predictive value; RW, real-world.
Discussion
By the seventh and eighth decades of life, more than 60% of the population will have a thyroid nodule that can be identified by imaging (2). Therefore, thyroid nodules are very common, a significant minority represent a thyroid malignancy, and it is incumbent upon physicians to detect and treat thyroid malignancies as is clinically appropriate and avoid unnecessary invasive procedures in patients with benign lesions.
The Afirma GSC uses next-generation RNAseq and whole transcriptome analysis combined with machine learning algorithms to provide a benign or suspicious result in nodules with ITN (6). The primary goal of the test is to allow patients to avoid unnecessary surgery by ruling out thyroid cancer. A cost-effectiveness modeling study of the Afirma GSC demonstrated overall healthcare cost savings in the United States relative to routine lobectomy, along with the avoidance of potentially unnecessary surgical complications, which was seen in more than 10% of thyroid surgeries in a national study (25, 26).
The validation study of the Afirma GSC showed improved SP compared to the first-generation GEC (5, 6), resulting in improved PPV while maintaining high SN and NPV. This study now analyses the performance of the Afirma GSC in 13 independent postvalidation studies. A high-quality diagnostic test validation study that is prospective, blinded, multicenter, and representative of the intended test population is critical to provide confidence in the test performance. Postvalidation RW studies are important for increasing confidence in a test's performance and providing evidence of benefit in clinical practice outside of the controls of a validation study.
Unlike other meta-analyses of molecular markers, where only samples with histologic correlates are considered (21, 22), we assume that unoperated ITNs with GSC-B results are true negative results, as is common in RW practice. This is a limitation as one cannot truly calculate test performance without final histology and disease prevalence (27). However, most patients with GSC-B molecular results are followed conservatively, as are patients with cytologically benign (Bethesda II) nodules, where there is up to a 3% risk of malignancy according to the Bethesda criteria (4). Therefore, assuming all Bethesda II nodules are true negatives will result in a no less than 97% NPV, similar to the Afirma GSC with a 96% NPV (6). To assess outcomes more conservatively with assumed true negative status of unoperated Afirma GSC-B nodules, we only evaluated studies that had at least 1 patient with GSC-B results with histopathologic correlation to increase detection of possible false negatives (molecular benign results in thyroid cancers). Although more patients may have had a recommendation for surgical intervention, only 6% of patients in the RW studies with GSC-B results had surgery, suggesting clinicians are generally comfortable with conservative monitoring of ITN with GSC-B results. We found a 97% sensitivity, which was not statistically different from the validation study and a 99.5% NPV, which was statistically improved.
In these RW studies, 78% of patients with GSC-S results underwent surgical resection. To consider the 22% of unoperated GSC-S patients as true positives would falsely inflate the SP and PPV performance. Therefore, for the oSP and oPPV, these patients were excluded from analysis and the RW studies showed an oSP of 88% and an oPPV of 65% (compared with 68% and 47% respectively in the VS). To help control for the bias of patient selection for surgical referral (more concerning clinical or ultrasound features, for example), we also calculated a cSP and cPPV where we made the extreme assumption that all unoperated GSC-S patients had benign nodules (false positives). The cSP was still significantly higher than the VS SP (80% vs 68%) and the cPPV was the same (49% vs 47%). This high SP (true negative rate) in RW practice is supported by the higher BCR in RW studies compared to the VS (67% vs 54%) where conservative follow-up is favored and patients with ITN can avoid unnecessary surgery. This high BCR also aligns with the BCR in the Veracyte Afirma CLIA lab for ITN which is 66% (28).
There are several possible reasons for the improved Afirma GSC performance in RW studies as compared with the VS. These include an overrepresentation of Hürthle subtypes in the VS (20% Hürthle carcinoma of malignant histology and 11% Hürthle adenoma of benign histology) relative to RW estimates of Hürthle carcinoma prevalence (< 7%) along with other histology subtype differences (29). Additionally, there may be enrichment of malignancy in the operated cohort in RW studies based upon the selection of patients with GSC-S nodules that have surgery (higher clinical risk or more worrisome ultrasound features compared with GSC-S nodules without surgery). Finally, 78% of patients with GSC-S results had surgical resection. It is possible that at these academic and thyroid centers of excellence, there was more comfort observing some GSC-S nodules with lower risk clinical and ultrasound features. If this reduced false positive samples, SP and PPV would be enhanced relative to the validation study where all patients had surgery.
There are several limitations to this study. As discussed above, the assumption that unoperated GSC-B nodules represent true negatives may inflate the SN and NPV figures, though clinical assessment of GSC-B results as benign disease is standard clinical practice. There are currently no long-term follow-up studies of the cohorts of unoperated GSC-B patients which may increase or decrease the confidence of the true negative designation for this cohort. The clinical indications (clinical risk, ultrasound features, patient preference) for recommending surgery in GSC-B or not recommending surgery in GSC-S lesions are not well known. Some may consider categorizing NIFTP as malignant is a limitation, given the conservative treatment recommendations after thyroid surgery. However, thyroid surgery is required to make a NIFTP diagnosis and the there is no consensus as to the proper follow-up strategy for patients with NIFTP since they are not categorized histologically as benign (30).
In summary, RW Afirma GSC data for ITN strongly supports the GSC test performance metrics from prior validation, and suggest that real-world performance may be superior, most notably on cSP, oSP, and oPPV. The data show a higher RW BCR and a high NPV to rule out thyroid cancer in ITN with GSC-B results. Additionally, the risk of malignancy in RW practice of GSC-S lesions that have thyroid surgery is 65%, significantly higher than the 47% PPV from the VS. Finally, in RW experience, the vast majority of nodules with GSC-B results avoid surgical resection. Important future studies will include long-term follow-up analyses of unoperated ITNs with Afirma GSC-B and GSC-S results.
Disclosures
XZ, RJ, YH, JH, JPK, RTK and GCK are employees and equity owners of Veracyte, Inc.
Data Availability
Original data generated and analyzed during this study are included in this published article or in the data repositories listed in References.
References
Abbreviations
- BCR
benign call rate
- BI-BIV
Bethesda I to Bethesda IV categories
- cPPV
conservative positive predictive value
- cSP
conservative specificity
- GEC
Gene Expression Classifier
- GSC
Genomic Sequencing Classifier
- GSC-B
GSC Benign
- GSC-S
GSC Suspicious
- ITN
indeterminate thyroid nodule
- NIFTP
noninvasive follicular thyroid neoplasm with papillary-like nuclear features
- NPV
negative predictive value
- oPPV
observed positive predictive value
- oSP
observed specificity
- PPV
positive predictive value
- RW
real-world
- SN
sensitivity
- SP
specificity
- SROC
summary receiver operating characteristic
- TN
true negative
- VS
validation study
