


Abstract
A two-way relationship between periodontitis and diabetes has been proposed. However, bidirectional epidemiological observation is limited and inconsistent.
Using the National Health Insurance Research Database of Taiwan (covering over 99% of the entire population), we aimed to estimate the development of diabetes in periodontitis patients or that of periodontitis in patients with type 2 diabetes mellitus (T2DM), respectively.
A total of 11 011 patients with severe periodontitis were recruited from 2000 to 2015. After matching by age, sex, and index date, 11 011 patients with mild periodontitis and 11 011 non-periodontitis controls were registered. Additionally, 157 798 patients with T2DM and 157 798 non-T2DM controls were enrolled, in whom the development of periodontitis was traced. Cox proportional hazards model was performed.
Periodontitis patients tended to have a statistically high risk for T2DM. The adjusted hazard ratio was 1.94 (95% CI, 1.49-2.63, P < .01) and 1.72 (95% CI, 1.24-2.52, P < .01) for severe and mild periodontitis groups, respectively. The patients with severe periodontitis had a higher risk of having T2DM relative to those with mild periodontitis (1.17 [95% CI, 1.04-1.26, P < .001]). Conversely, the risk of periodontitis increased significantly in patients with T2DM (1.99 [95% CI, 1.42-2.48, P < .01]). However, high risk was observed for the outcome of severe periodontitis (2.08 [95% CI, 1.50-2.66, P < .001]), but not for mild periodontitis (0.97 [95% CI, 0.38-1.57, P = .462]).
We suggest that the bidirectional association is between T2DM and severe but not mild periodontitis.
Diabetes mellitus is a metabolic disease characterized by an increase in the blood glucose level. Periodontal disease is a bacteria-induced chronic inflammatory condition characterized by the breakdown of the tooth's supporting tissues. Diabetes can be considered a pandemic, causing significant morbidity, mortality, and financial issues. In 2015, approximately 415 million individuals reportedly suffered from diabetes worldwide, and this number is expected to increase each year (1). Meanwhile, periodontal disease is recognized as the most prevalent inflammatory disease, with approximately 796 million cases of severe periodontitis recorded worldwide in 2017 (2). Links between diabetes and periodontitis have already been acknowledged. The majority of the studies have indicated that diabetes increases the risk of periodontal inflammation (3-5); however, some studies have presented no such results (6, 7). Clinical and epidemiological findings have suggested that periodontal infection contributes to a poorer glycemic control (8-10), whereas the benefits of periodontal therapy on glycemic conditions in periodontitis patients with diabetes remain ambiguous (11, 12). The two-way relationship between periodontitis and diabetes was advocated in the past (13) and broadly discussed. However, the bidirectional epidemiological observations in a general population have been limited and inconsistent (14-16). Two cohort studies suggested the bidirectional link (14, 15), but a third called into question the presence of a true bidirectional association (16). Therefore, the present study was designed to bidirectionally trace periodontitis in diabetes patients with type 2 diabetes mellitus (T2DM) and T2DM in periodontitis patients in a Taiwan population over 15 years.
Methods
Data Sources
In this study, we used the data from the Longitudinal Health Insurance Database in Taiwan (2000-2015), which is a subset database selected randomly from the National Health Insurance Research Database (NHIRD). The National Health Insurance (NHI) Program in Taiwan, which was launched in 1995, includes approximately 23 million beneficiaries or more than 99% of the entire population in Taiwan (17). The NHI program covers all necessary medical care (including outpatient and inpatient), dental care, Chinese medicine, and prescription drugs. The Longitudinal Health Insurance Database contains information on health service utilization for approximately 1 million beneficiaries who represent approximately 5% of the Taiwanese population. The NHIRD contains patient identification numbers, dates of birth, sex, ICD-9-CM diagnostic codes (up to 5 each), and outcomes.
Ethical Statement
Data access and ethical approval for this study were approved by the Institutional Review Board of the Taipei Tzu Chi Hospital (No. 09-W-043 approved with exempt review). The data were anonymized before they were obtained; thus, the need for informed consent was waived by the Taipei Tzu Chi Hospital Ethics committee. All experiment procedures complied with the ethical standards of the relevant national and institutional committees on human experimentation and with the guidelines of the Declaration of Helsinki.
Study Design and Sampled Participants
Direction 1, that is, tracing T2DM in patients with periodontitis, comprised patients who were newly diagnosed with periodontitis from January 1, 2000, to December 31, 2015, according to the ICD-9-CM code 523.4. Each enrolled periodontitis patient was required to have made at least 3 dental visits with the 523.4 code being filed within the previous 1 year. The periodontitis patients were then categorized into the mild and severe periodontitis groups as described previously (18-21). The patients who had NHI order code for sub-gingival curettage/root planning (91 006-91008C) or periodontal flap operation (91009B-91010B) were categorized into the severe periodontitis group, whereas those without these treatment codes were categorized into the mild periodontitis group (22). The exclusion criteria for the study were as follows: the patients with periodontitis from January 1, 1998, to December 31, 1999; the patients with T2DM from 1998 to 1999 or before their first visit during which periodontitis was diagnosed; the subjects aged <40 years; and those who had insufficient medical information or withdrawal from the NHI program throughout the 15-year study period (Fig. 1). Among the 1 936 512 individuals, there were 11 011 periodontitis patients enrolled in the severe periodontitis group. Propensity score matching was used in logistic regression. A matching algorithm was taken for nearest neighbor matching. The option for nearest neighbor was set as random matching order, non-replacement, no caliper, and 1 to 1 matching by age, sex, and index date. The tolerance of matching score was set 0.20. Therefore, 11 011 periodontitis patients were included in the mild periodontitis group (same exclusion criteria and one-fold propensity score) (Fig. 1). Additionally, another 11 011 dental patients who were not diagnosed with periodontitis were categorized into the non-periodontitis control group. We followed up with all the enrolled participants for the index date, until the onset of T2DM (ICD-9-CM code 250 and who were taking ≥2 antidiabetic medications) or the end of 2015.
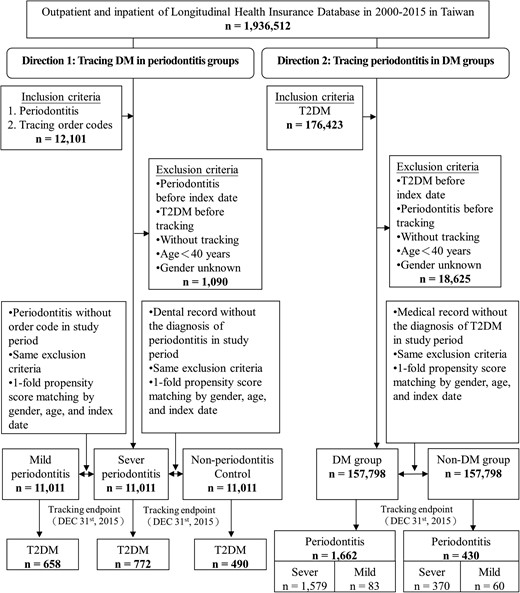
Flowchart of the sample selection procedure from the NHIRD in Taiwan. Diagnosis of periodontitis: ICD-9-CM 523.4 and ≥3 OPDs or IPDs in 1 year. Diagnosis of severe periodontitis: NHI order codes 91006C–91008C and 91009B–91010B. Diagnosis of type 2 diabetes mellitus: ICD-9-CM 250 and taking ≥2 antidiabetic drugs. Abbreviations: DM, type 2 diabetes mellitus; Non-DM, the nondiabetic controls.
Direction 2, that is, tracking periodontitis in patients with T2DM who were taking ≥2 antidiabetic medications (23), consisted of patients who were selected from the medical claim data according to the ICD-9-CM code 250. Patients who were diagnosed with T2DM or periodontitis from 1998 to 1999 and aged <40 years were excluded. In total, 157 798 patients with T2DM were enrolled in the diabetes group, whereas 157 798 participants were recruited in the nondiabetes group. The outcome of periodontitis was then tracked, and the outcome was subsequently categorized into the severe periodontitis subgroup and the mild periodontitis subgroup.
The covariates included gender, age, insurance premium (< 18 000, 18 000-34 999, and ≥35 000 NT$), urbanization level of residence (levels 1-4), and level of care (hospital center, regional, and local hospitals). The urbanization level of residence was based on the population and various other indicators. Briefly, the urbanization level 1 was defined as a population >1 250 000 and specific designation, while the levels 2, 3, and 4 were defined as populations between 500 000 and 1 249 999; 149 999 and 499 999; and <149999, respectively.
The baseline comorbidities included hypertension (ICD-9-CM codes: 401.1, 401.9, 402.10, 402.90, 404.10, 404.90, 405.1, and 405.9), hyperlipidemia (ICD-9 CM code: 272.x), coronary artery disease (CAD; ICD-9 CM code: 410-414), obesity (ICD-9 CM codes: 278.00-278.01), smoking (ICD-9-CM code: 305.1), chronic obstructive pulmonary disease (ICD-9-CM codes: 490-496), and alcoholism (ICD-9-CM codes: 303 and 305.0); additionally, the revised Charlson Comorbidity Index (CCI_R; CCI with removed diabetes mellitus, hypertension, and CAD) was included. The baseline comorbidities were also selected as the potential covariates in the following analysis.
Statistical Analysis
Chi-square and Fisher's exact tests were used to evaluate the differences between categorical variables, whereas the Mann-Whitney U-test and Kruskal-Wallis with Dunnett's post hoc test were used for continuous variables without normal distribution. Multivariate Cox proportional hazards regression analysis was used to determine the risk of T2DM and periodontitis after adjusting for covariates (gender, age, insurance premium, urbanization level of residence, and level of care) and baseline comorbidities (hypertension, hyperlipidemia, CAD, obesity, smoking, chronic obstructive pulmonary disease, alcoholism, and CCI_R). The results are presented as hazard ratios with 95% CIs. Sensitivity analysis was further used to exclude the diagnosis of T2DM or periodontitis in the first 1 or 5 years and to eliminate any potential protopathic bias. The difference in the risk of outcome disease between the study and reference groups was estimated using the Kaplan-Meier method and the log-rank test. A two-tailed P < .05 was considered statistically significant.
Results
Direction 1: Periodontitis, a Risk Factor for T2DM
At baseline, significantly different characteristics were noted between groups (Supplementary Table S1) (24). Differences were observed for all variables except gender and age. At the end of the follow-up, 772 (7.01%) and 658 (5.98%) patients with periodontitis developed T2DM in the severe and mild periodontitis groups, respectively, compared with 490 (4.45%) participants in the non-periodontitis control group (P < .001) (Fig. 1; and Supplementary Table S2, Direction 1) (24). The cumulative incidences for developing T2DM differed between groups (P < .001; Fig. 2a).
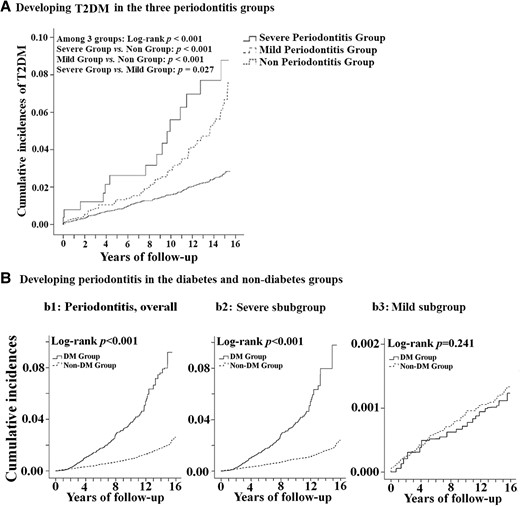
Kaplan-Meier analysis of the association between periodontitis and DM. The cumulative incidences of developing type 2 diabetes mellitus in the 3 periodontitis groups. (A) The cumulative incidences of developing periodontitis in the diabetes and nondiabetes groups. (B) the incidences of developing periodontitis, overall (b1), the outcome subgroups of severe periodontitis (b2) and mild periodontitis (b3). Abbreviations: DM, type 2 diabetes mellitus; Non-DM, the nondiabetic controls).
Risk Factors for T2DM in Patients With Periodontitis
The patients in the severe and mild periodontitis groups tended to have a significantly increased risk of developing T2DM (Table 1, Direction 1). The adjusted hazard ratios (aHRs) were 1.94 (95% CI, 1.49-2.63; P < .001) and 1.72 (95% CI, 1.23-2.53; P < .001) for the severe and mild periodontitis groups, respectively (Table 1). Besides, the participants who lived in places with high urbanization levels, who were treated in hospital centers/regional hospitals, and had hypertension, hyperlipidemia, CAD, obesity, smoking, alcoholism, and greater CCI_R values were associated with a higher risk of developing T2DM. Nevertheless, gender, insured premium, and comorbidity of chronic obstructive pulmonary disease among groups were not significantly associated with the risk of developing T2DM.
Risks of periodontitis in T2DM groups and of T2DM in periodontitis groups determined by Cox regression
| Direction 1: Periodontitis, risk of T2DM | Direction 2: T2DM, risk of periodontitis | |||||||
|---|---|---|---|---|---|---|---|---|
| Variables | aHR | P | Periodontitis, overall | P | Severe subgroup | P | Mild subgroup | P |
| (95% CI) | aHR (95% CI) | aHR (95% CI) | aHR (95% CI) | |||||
| Cohort, Non-P | Reference | |||||||
| Severe-P | 1.94 (1.49-2.63) | <.001 | ||||||
| Mild-P | 1.72 (1.23-2.52) | <.001 | ||||||
| Cohort, Non-T2DM | Reference | Reference | Reference | |||||
| T2DM | 1.99 (1.44-2.48) | <.001 | 2.08 (1.50-2.66) | <.001 | .97 (.38-1.57) | .463 | ||
| Male (F, ref) | .96 (.47-1.74) | .570 | 1.11 (.88-1.76) | .250 | 1.11 (.87-1.76) | .253 | 1.12 (.88-1.76) | .263 |
| Age (years) | 1.22 (1.08-1.36) | <.001 | 1.10 (1.01-1.22) | .044 | 1.11 (1.00-1.22) | .047 | 1.11 (1.01-1.23) | .042 |
| Insured premium (NTD 103) | ||||||||
| <18 | Reference | Reference | Reference | Reference | ||||
| 18-35 | 1.27 (.44-1.93) | .580 | 1.14 (.38-1.82) | .530 | 1.15 (.38-1.83) | .540 | 1.14 (.37-1.80) | .530 |
| >35 | 1.42 (.85-1.97) | .438 | 1.30 (.62-1.94) | .472 | 1.33 (.69-1.95) | .468 | 1.28 (.56-1.93) | .489 |
| Urbanization | ||||||||
| 1 (Highest) | 1.85 (1.24-2.24) | <.001 | 1.76 (1.26-2.18) | <.001 | 1.76 (1.25-2.24) | <.001 | 1.77 (1.28-2.27) | <.001 |
| 2 | 1.72 (1.18-2.06) | <.001 | 1.67 (1.23-2.11) | <.001 | 1.66 (1.21-2.12) | <.001 | 1.68 (1.25-2.12) | <.001 |
| 3 | 1.63 (1.16-2.02) | <.001 | 1.65 (1.18-2.06) | <.001 | 1.64 (1.15-2.05) | <.001 | 1.66 (1.19-2.08) | <.001 |
| 4 (Lowest) | Reference | Reference | Reference | Reference | ||||
| Level of care | ||||||||
| Center Hosp. | 2.40 (1.80-3.07) | <.001 | 2.24 (1.54-2.89) | <.001 | 2.26 (1.52-2.91) | <.001 | 2.23 (1.52-2.86) | <.001 |
| Regional Hosp. | 1.96 (1.43-2.63) | <.001 | 1.82 (1.23-2.40) | <.001 | 1.80 (1.21-2.78) | <.001 | 1.84 (1.18-2.06) | <.001 |
| Local Hosp. | Reference | Reference | Reference | Reference | ||||
| HTN | 1.97 (1.57-2.45) | <.001 | 1.83 (1.46-2.35) | <.001 | 1.80 (1.45-2.36) | <.001 | 1.85 (1.46-2.35) | <.001 |
| Hyperlip | 1.84 (1.41-2.18) | <.001 | 1.73 (1.27-2.37) | <.001 | 1.75 (1.28-2.35) | <.001 | 1.71 (1.26-2.38) | <.001 |
| CAD | 1.75 (1.27-2.17) | <.001 | 1.58 (1.33-2.10) | <.001 | 1.54 (1.24-2.14) | <.001 | 1.63 (1.43-2.07) | <.001 |
| Obesity | 4.87 (2.16-6.70) | <.001 | 1.95 (1.48-2.51) | <.001 | 1.94 (1.43-2.35) | <.001 | 1.95 (1.48-2.42) | <.001 |
| Smoking | 1.35 (1.11-1.51) | <.001 | 1.25 (1.20-1.64) | <.001 | 1.48 (1.21-1.67) | <.001 | 1.38 (1.19-1.61) | <.001 |
| COPD | 1.20 (.86-1.48) | .276 | 1.29 (.41-1.79) | .530 | 1.39 (.59-1.98) | .486 | 1.19 (.24-1.61) | .587 |
| Alcoholism | 1.53 (1.30-1.79) | <.001 | 1.85 (1.34-2.30) | <.001 | 1.85 (1.33-2.30) | <.001 | 1.85 (1.39-2.37) | <.001 |
| CCI_R | 1.25 (1.06-1.70) | <.001 | 1.30 (1.10-1.52) | <.001 | 1.38 (1.10-1.29) | <.001 | 1.30 (1.10-1.69) | <.001 |
Abbreviations: aHR, adjusted hazard ratio; the adjusted variables listed in the table; CAD, coronary artery disease; CCI_R, Charlson Comorbidity Index revised; COPD, chronic obstructive pulmonary disease; HTN, hypertension; Hyperlip, hyperlipidemia; Mild-P, mild periodontitis; Non-P, no periodontitis; NTD, New Taiwan dollar; Severe-P, severe periodontitis; T2DM, type 2 diabetes mellitus.
Sensitivity of Periodontitis as a Risk Factor for T2DM
The rates of T2DM were 13.40 and 10.12 per 103 person-years in the severe and mild periodontitis groups, respectively, which were significantly greater than that in the non-periodontitis group (6.31 per 1000 person-years; Table 2, Direction 1). It was also observed that patients in the severe and mild periodontitis groups tended to have a significantly increased risk of developing T2DM, even though the data from the first 1 or 5 years were excluded. Moreover, the severe periodontitis patients had a high risk of having T2DM if the mild periodontitis patients were used as the reference. After further excluding the first 1 or 5 years of follow-up, the risk of developing was similar. (1.17, 95% CI, 1.04-1.26, P = .001 for the non-excluded data).
Sensitivity of periodontitis or T2DM as the risk in the model
| Events | Years | Rate (/103 PYs) | aHR (95% CI) | aHR (95% CI) | |
|---|---|---|---|---|---|
| Direction 1: Periodontitis, risk of T2DM | |||||
| Severe-P group | 772 | 57 601 | 13.40 | 1.94 (1.49-2.63)* | 1.17 (1.04-1.26)** |
| Mild-P group | 658 | 65 012 | 10.12 | 1.72 (1.24-2.52)* | Reference |
| Non-P control | 490 | 77 656 | 6.31 | Reference | |
| Data in the first year excluded | |||||
| Severe-P group | 724 | 49 977 | 14.49 | 1.95 (1.49-2.64)* | 1.18 (1.06-1.31)* |
| Mild-P group | 631 | 59 701 | 10.57 | 1.74 (1.24-2.54)* | Reference |
| Non-P control | 465 | 70 987 | 6.55 | Reference | |
| Data in the first 5 years excluded | |||||
| Severe-P group | 509 | 32 402 | 15.71 | 1.96 (1.51-2.74)* | 1.18 (1.07-1.35)* |
| Mild-P group | 482 | 43 501 | 11.08 | 1.75 (1.26-2.54)* | Reference |
| Non-P control | 399 | 58 732 | 6.79 | Reference | |
| Direction 2: T2DM, risk of periodontitis | |||||
| T2DM group | 1662 | 1 599 752 | 1.04 | 1.99 (1.44-2.48)* | |
| Non-T2DM control | 430 | 2 756 716 | .16 | Reference | |
| Data in the first year excluded | |||||
| T2DM group | 1493 | 1 294 201 | 1.15 | 2.01 (1.47-2.57)* | |
| Non-T2DM control | 394 | 2 650 809 | .15 | Reference | |
| Data in the first 5 years excluded | |||||
| T2DM group | 1313 | 1 076 506 | 1.22 | 2.06 (1.50-2.65)* | |
| Non-T2DM control | 323 | 1 918 852 | 0.17 | Reference | |
| Subgroup A: T2DM, risk of severe periodontitis | |||||
| T2DM group | 1579 | 1 598 722 | 0.99 | 2.08 (1.50-2.66)* | |
| Non-T2DM control | 370 | 1 678 127 | 0.22 | Reference | |
| Data in the first year excluded | |||||
| T2DM group | 1422 | 1 287 843 | 1.10 | 2.10 (1.58-2.68)* | |
| Non-T2DM control | 339 | 1 370 244 | 0.25 | Reference | |
| Data in the first 5 years excluded | |||||
| T2DM group | 1254 | 1 065 244 | 1.18 | 2.16 (1.59-2.75)* | |
| Non-T2DM control | 278 | 1 083 751 | 0.26 | Reference | |
| Subgroup B: T2DM, risk of mild periodontitis | |||||
| T2DM group | 83 | 1 542 237 | 0.05 | .97 (.38-1.57) | |
| Non-T2DM control | 60 | 1 078 589 | 0.06 | Reference | |
| Data in the first year excluded | |||||
| T2DM group | 71 | 1 291 022 | 0.05 | .97 (0.44-1.62) | |
| Non-T2DM control | 55 | 972 682 | 0.06 | Reference | |
| Data in the first 5 years excluded | |||||
| T2DM group | 59 | 1 142 575 | 0.05 | .98 (0.49-1.66) | |
| Non-T2DM control | 45 | 835 101 | 0.05 | Reference | |
Abbreviations: aHR, adjusted hazard ratio; Mild-P, mild periodontitis; Non-P, no periodontitis; PY, person-year; Severe-P, severe periodontitis; T2DM, type 2 diabetes mellitus.
and bold: significant difference at P < .001; ** and bold: significant difference at P = .001.
Direction 2: T2DM, a Risk Factor for Developing Periodontitis
The general characteristics of the T2DM and non-T2DM groups at the baseline were different, except for gender, age, or insurance premium (Supplementary Table S1) (24). At the end of follow-up, 1662 (1.05%) patients with T2DM have reportedly developed periodontitis compared with 430 (0.27%) participants in the non-T2DM control group (P < .001) (Fig. 1, and Supplementary Table S2, Direction 2) (24). The difference was further noted in other variables, except gender and insured premium. The cumulative incidence of periodontitis in the T2DM group was significantly higher than that in the non-T2DM control group (Fig. 2b1). As per the outcomes of periodontitis subgroups, however, statistically different incidences between the groups of T2DM and non-T2DM were noticed for severe periodontitis subgroup, but not for mild periodontitis (Fig. 2b2 and 2b3).
Risks for Developing Periodontitis in Patients With T2DM
Using the non-T2DM group as the reference, the aHR of developing periodontitis in the T2DM group was 1.99 (95% CI, 1.44-2.48; P < .001; Table 1, Direction 2). The elder patients who lived in areas of high urbanization levels were attended to in the center/regional hospital; moreover, hypertension, hyperlipidemia, CAD, obesity, smoking, alcoholism, and high CCI_R values tended to have a high risk of developing periodontitis. However, the statistical significance for an increased risk of developing the outcome of periodontitis in patients with T2DM was observed for the severe periodontitis subgroup (aHRs: 2.08; 95% CI, 1.50-2.66; P < .001), but not for the mild periodontitis subgroup (aHRs: 0.97; 95% CI, .38-1.57; P = .462) (Table 2).
Sensitivity of T2DM as a Risk Factor for Periodontitis
The rate of having periodontitis in the T2DM group (1.04 per 1000 person-years) was determined to be significantly greater than that in the non-T2DM control group (0.16 per 1000 person-years; Table 2, Direction 2). The patients with T2DM tended to have a significantly increased risk of developing periodontitis. After subgrouping the outcome of periodontitis, the rate of developing severe periodontitis was significantly greater in the T2DM group than that in the non-T2DM group (0.99 vs 0.22 per 1000 person-years). The aHR was 2.08 (95% CI, 1.50-2.66; P < .001). After the exclusion of the data from the first 1 or 5 years, the greater rate and aHR in the T2DM group than that in the non-T2DM group were repeated. However, the rate of developing mild periodontitis in the T2DM group did not differ significantly from that in the non-T2DM group (0.05 and 0.06 per 1000 person-years, respectively). The aHR of 0.97 (95% CI, 0.38-1.57; P = .462) was obtained. No difference was also noticed after excluding the data from the first 1 or 5 years.
Discussion
This retrospective cohort study aimed to bidirectionally track the incidences of T2DM and periodontitis in aged adults (>40 years old) who were chosen from the base population of Taiwan (Table 1, Fig. 1). As per our results, it was found that the risk of developing T2DM increased in the patients with periodontitis compared to those in the non-periodontitis control group (Fig. 2a, Tables 1 and 2). In the same population, within the same observation period, the patients with T2DM also had an increased risk of developing periodontitis (significant greater risks noticed on the severe periodontitis subgroup only) (Fig. 2b, Tables 1 and 2). In brief, in this nationally representative sample, the bidirectional association between the 2 diseases was noticed during 15 years of tracking, similar to the previously reported community study (14). In that community study, T2DM was defined as having a history from the questionnaire or fasting plasma glucose, and the periodontal status was assessed by the Community Periodontal Index of Treatment Needs (CPITN). However, simple screening based on the fasting glucose alone might ineffectively detect an unacceptable number of subjects with glucose intolerance (25). Whether the Community Periodontal Index of Treatment Needs could accurately reflect the actual periodontal status of the sample population is also questioned (26). Further, the professional levels for those examiners were not clearly defined. In the present study, the diagnosis of T2DM and periodontitis was performed by board-certified endocrinologists and dentists. The accuracy and validity of the diagnoses in NHIRD in Taiwan were high (27). Strategies to reduce the diagnosis bias were further utilized (27), such as the triple diagnoses of periodontitis within the 1-year claim period and the taking of more than 2 antidiabetic medications required for patients with T2DM enrolling, besides the ICD-9-CM code of 250.
Periodontitis as a Risk Factor for T2DM
Detailed pathogenesis of the high risk of diabetes in periodontitis patients is still under investigation. However, it has been known that circulating mediators such as C-reactive protein (CRP), tumor necrosis factor (TNF)-α, and interleukin (IL)-6, are elevated in patients with periodontal diseases (28). A longitudinal study found an increase in glycated hemoglobin (HbA1c) levels over 5 years in patients with periodontitis, and this increase was highest in individuals with high levels of CRP (29). The role of systemic inflammation as a mediator of the linkage between periodontitis and impaired fasting glucose was found using mediation analysis (10). It has been proposed that hyperactive neutrophils in the periodontium may be an important source of reactive oxygen species, which then activates the pro-inflammatory pathways and promotes insulin resistance in patients with periodontitis and diabetes (30).
The impact of periodontal microorganisms on glycemic control or the diabetic state of the patient has also been examined. For instance, Porphyromonas gingivalis, especially clones with type II fimbriae, was detected more frequently in periodontitis patients with high HbA1c values following periodontal treatment (31). A recent animal study further demonstrated the translocation of P. gingivalis and their gingipains to the pancreas, with alterations in the morphology of the islets in the pancreas (32). Nevertheless, further detailed investigation is indeed required.
T2DM as a Risk Factor for Periodontitis
In the present study, we found T2DM as a risk factor for developing severe periodontitis, but not mild periodontitis (aHR 2.08, P < .001 and aHR 0.97, P = .462 for severe and mild periodontitis, respectively) (Table 2). The exact reason is not known. However, in this study, the patient enrollment was based on the ICD-9-CM codes according to the clinical and laboratory examinations. The diagnosis of diabetes is mainly relying on laboratory data, including serum glycemic or HbA1c level (33). On the contrary, the primary criteria for periodontal diagnosis are clinical observation and measurements, such as the gingival color, periodontal probing, bleeding upon probing, and radiographic bone loss (34). It is well known that diabetes pathology involves various tissue alterations, such as microvasculopathy (35). These alterations may result in the gingival color change and the weakening probing resistance and increase the severity of periodontitis diagnosis.
Moreover, the advanced glycation end products (AGEs) might be significantly associated with the extent of periodontitis in diabetic individuals (36). AGEs and hyperglycemia have been found to increase the lipopolysaccharide-induced production of IL-6 in human gingival fibroblasts (37). The interactions between AGEs and their receptors were significantly higher in the inflamed periodontal tissues of rats induced with hyperglycemia than in rats with normal blood glucose levels (38). Treatment using soluble receptors of AGE decreased the levels of TNF-α, IL-6, and metalloproteinases in gingival tissues and suppressed alveolar bone loss in diabetic animals (39). AGE accumulation in diabetes could aggravate periodontal inflammation by augmenting the pro-inflammatory response of host gingival fibroblasts to P. gingivalis (40). Besides, TNF-α and IL-6 were significantly increased in diabetic mice compared with those in normal mice after the inoculation of P. gingivalis (41). The experiments with TNF-α inhibitors in the diabetic animal models of periodontitis indicated that these changes might be the secondary effects of TNF-α (42). Nevertheless, the exact mechanism of the underlying risk factors is still unclear and needs further elucidation.
Limitations
This study has several limitations. First, like previous studies using the NHIRD on periodontal diseases, precise data on the severity of periodontitis were unavailable. Second, other factors such as genetic, psychosocial, physical activity, diet, waist-to-hip ratio, and detailed environmental factors were excluded from the dataset. Third, the claims dataset did not include detailed diabetes information about the patient, including diabetes complications, or glycemic control. Fourth, there were only a few patients in the mild periodontitis subgroup. Fifth, because the criteria for enrollment of the patients with T2DM, despite whether Direction 1 or 2, were ICD-9-CM diagnostic code combined with taking ≥2 antidiabetic medications, such limitations are likely to result in excluding a considerable proportion of diabetes patients and underestimation of the total sample of diabetes. Sixth, only NHIRD enrollees aged 40 and older were studied; thus, the results may not generalize to people younger than 40. Therefore, it is advisable to interpret the results of this study with caution. However, the strengths of the study are as follows: first, this study included a large population, which allowed the results from this analysis to be generalized to the population over the age of 40 in Taiwan. Second, because the NHIRD provides continued coverage, we could follow the population trend for 15 years. Third, the accuracy and validity of the diagnoses in this study are high.
Conclusion
Using the data from the NHIRD of Taiwan, the relationship between periodontitis and T2DM was examined bidirectionally. At the end of the 15-year follow-up, the cumulative incidences of T2DM among the 2 periodontitis groups and non-periodontitis control group were determined to be statistically different (Direction 1). The aHRs were 1.94 and 1.72 for the severe and mild periodontitis groups, respectively. Further, the risk of T2DM in the severe periodontitis group was greater than that in the mild periodontitis group. In Direction 2, T2DM as a risk factor for periodontitis was tested. An increased risk of developing periodontitis was observed among patients with T2DM (aHR = 1.99, the development of periodontitis in the control participants without T2DM as the reference). However, the greater risk was observed only for the outcome of the severe periodontitis subgroup but not of the mild periodontitis subgroup. Based on the findings of this retrospective cohort study, we suggested that the bidirectional association was present between T2DM and severe periodontitis, but not for the mild type.
Acknowledgments
This study was supported by the Tri-Service General Hospital Research Foundation (TSGH-B-112020), and the sponsor has no role in study design, data collection and analysis, decision to publish, or preparation of the manuscript. We also appreciate the Health and Welfare Data Science Center, Ministry of Health and Welfare (HWDC, MOHW), Taiwan, for providing the National Health Insurance Research Database (NHIRD).
Funding
This study was partially supported by a research grant from Tri-Service General Hospital Research Foundation (TSGH-B-112020).
Author Contributions
Professor W.C. Chien and Dr. E. Fu contributed to conception, design, data acquisition, analysis, interpretation, and drafted the manuscript; Dr. C.H. Chung contributed to conception, design, data acquisition, analysis, interpretation, drafted and critically revised the manuscript; Dr. C.M. Cheng contributed to data acquisition and interpretation for the study; assistant professor H.P. Tu contributed to data acquisition, analysis; Dr. W.C. Lee contributed to data interpretation for the study; Dr. W.L. Chen contributed to data acquisition, analysis, and interpretation for the study; and Dr. K.C. Shih contributed to conception, design, data acquisition, interpretation, drafted and critically revised the manuscript. All authors provided final approval for the submission.
Disclosures
The authors have no conflicts of interest to declare.
Data Availability Statement
Data are available from the National Health Insurance Research Database (NHIRD) published by Taiwan National Health Insurance (NHI) Bureau. Due to legal restrictions imposed by the government of Taiwan in relation to the “Personal Information Protection Act,” data cannot be made publicly available. Requests for data can be sent as a formal proposal to the NHIRD (https://nhird.nhri.org.tw/en/).
References
Abbreviations
- AGEs
advanced glycation end products
- aHR
adjusted hazard ratio
- CAD
coronary artery disease
- CCI_R
the revised Charlson Comorbidity Index
- CRP
C-reactive protein
- HbA1c
glycated hemoglobin
- IL
interleukin
- NHIRD
National Health Insurance Research Database
- NHI
National Health Insurance
- T2DM
type 2 diabetes mellitus
- TNF
tumor necrosis factor
Author notes
Wu-Chien Chien and Earl Fu contributed equally to this work.
