


Abstract
The association between remnant cholesterol (RC) and gestational diabetes mellitus (GDM) risk is unclear.
This study investigated the association between RC and GDM.
We used data from the Tongji Maternal and Child Health Cohort, a prospective cohort study in China. Fasting lipid concentrations were measured around 16 weeks’ gestation. RC was calculated as total cholesterol minus low-density lipoprotein cholesterol and high-density lipoprotein cholesterol. GDM was diagnosed by a 75-g oral glucose tolerance test at 24 to 28 weeks’ gestation. Log-Poisson regression models were performed to estimate relative risks (RRs) of GDM across quartiles of RC levels and triglyceride (TG) levels after adjustment for potential confounders. TG and RC were mutually adjusted.
Among 2528 women, 256 (10.1%) developed GDM. The adjusted RRs (95% CIs) for GDM across increasing quartiles of RC were 1.00 (reference), 1.35 (0.91, 1.99), 1.68 (1.16, 2.45), and 1.73 (1.19, 2.50), respectively. Compared to pregnant women without 3 risk indicators (TG <2.08 mmol/L, RC <0.40 mmol/L, and pre-BMI <24.0 kg/m2), the risk of GDM was elevated in those with normal pre-BMI but high RC (aRR: 1.54; 95% CI: 1.08, 2.19) or high TG (aRR: 2.15; 95% CI: 1.33, 3.49). For those with all 3 risk indicators, the risk of GDM was the highest (aRR: 4.80; 95% CI: 3.20, 7.18).
Elevated RC levels were associated with the increased risk of GDM and independent of traditional risk factors. Pregnant women with high pre-BMI, high TG, and high RC were at greatly increased risk of GDM.
Introduction
Gestational diabetes mellitus (GDM), one of the most common pregnancy complications, is characterized by any degree of glucose intolerance with onset or first recognition during pregnancy (1). Globally, in 2021, 21.1 million (16.7%) of live births were affected by hyperglycemia in pregnancy (2), with 80.3% due to GDM. Gestational diabetes mellitus is associated with multiple adverse pregnancy outcomes, such as cesarean delivery, pre-eclampsia, and macrosomia (3). Furthermore, women with GDM have an increased risk of obesity, type 2 diabetes mellitus, and cardiovascular disease later in life, as do their offspring (4-6). It is therefore crucial to identify modifiable risk factors that could contribute to the prevention of GDM.
Previous studies have shown hyperlipidemia, mainly markedly elevated triglyceride (TG) levels, are present throughout pregnancy in women with GDM compared to those without (7). Recently, a Mendelian randomization study found that TG showed significant bidirectional causal effects with fasting insulin (FI), while high-density lipoprotein cholesterol (HDL-C) and low-density lipoprotein cholesterol (LDL-C) had weaker or no effect on glycemic traits (8). Remnant cholesterol (RC), as a cholesterol content of triglyceride-rich remnant lipoproteins, is composed of very low-density lipoprotein cholesterol (VLDL-C) and intermediate-density lipoprotein cholesterol (IDL-C) in the fasting state and has been considered as a risk factor for type 2 diabetes mellitus and atherosclerotic cardiovascular diseases (9-12). Because it carries more cholesterol than low-density lipoprotein cholesterol (LDL-C) (13), RC was inferred to be more harmful to pancreatic β-cells. To date, no study has explored the association of RC with GDM risk.
In the present study, we set out to investigate the association between RC levels and subsequent GDM risk through a prospective cohort study. We hypothesized that a high serum RC concentration would be associated with an increased risk of GDM, and the association would be independent of TG.
Methods
Study Population
This study was embedded within Tongji Maternal and Child Health Cohort (TMCHC) study, which is a prospective, observational cohort with pregnant women and their offspring residing in Wuhan, Hubei province, China. Its primary purpose is to investigate the effect of maternal dietary, lifestyle, and genetic factors on the health of pregnant women and their offspring (14). The recruitment for the TMCHC study started in January 2013. Pregnant women prior to 16 gestational weeks were enrolled at their first antenatal visits and followed up regularly. Informed consents were obtained from all participants at enrollment. The Ethics Review Committee of Tongji Medical College, Huazhong University of Science and Technology approved this study (No. 201302).
All participants included in this study were from TMCHC and met the additional criteria: (1) with singleton fetus; (2) had complete demographics and anthropometric information; (3) provided blood samples for lipid profiles measurement before gestational week 20. Those who reported pre-existing diabetes, previous GDM, polycystic ovary syndrome, or infectious disease (eg, virus hepatitis) were excluded.
Lipid Measurements
Blood samples were collected after an overnight fast. Sample processing and storage procedures have been described previously (15). TG was measured by the GPO-PAP method, total cholesterol (TC) was measured with the CHOD-PAP method, HDL-C was measured by the catalase scavenging method, and LDL-C was measured with the surfactant scavenging method. Levels of TG, TC, HDL-C, and LDL-C were measured by using a Mindray BS-200 automatic biochemical analyzer machine (Shenzhen, China). Remnant cholesterol (mmol/L) was calculated as TC (mmol/L) minus LDL-C (mmol/L) minus HDL-C (mmol/L) (10, 11).
Ascertainment of GDM
During gestational weeks 24 to 28, a 75-g, 2-hour oral glucose tolerance test (OGTT) after an overnight fast was conducted. GDM was diagnosed when any of the 3 plasma glucose values of an OGTT met the criteria as follows: fasting blood glucose ≥5.1 mmol/L or 1-hour blood glucose ≥10.0 mmol/L or 2-hour blood glucose ≥8.5 mmol/L, according to the International Association of Diabetes and Pregnancy Study Groups (IADPSG) (16, 17).
Covariates
Maternal demographics, socioeconomic status, medical and obstetrical history, and lifestyle information were obtained through a structured questionnaire at enrollment, including maternal age, ethnicity, educational level, average income, family history of disease, smoking status, alcohol consumption, physical activity. The information on gestational week at the time of blood sampling, and the gestational weight gain at the time of blood sampling were obtained during subsequent prenatal care. Pre-pregnancy weight was self-reported at enrollment. Pre-pregnancy BMI (pre-BMI) was calculated by using pre-pregnancy weight (kg) divided by square of height (m2) and was categorized according to the Chinese adult BMI classification (18). Regular physical activity during pregnancy was defined as moderate intensity activity ≥30 minutes with frequency ≥3 times/week.
Statistical Analysis
Maternal baseline characteristics were presented as means ± SDs for continuous variables and frequency (percentage) for categorical or categorized variables. For comparisons of data between non-GDM and GDM groups, we tested for normality using D’Agostino's test; then the Mann-Whitney U test was used when the data were not normally distributed, while the Student t test was applied to compare continuous variables with normal distribution. The Pearson χ2 test was used to compare the rate or proportion for categorical or categorized variables. The Spearman correlation was calculated to examine the relationship between TG and RC. Log-Poisson regression model was performed to estimate relative risks (RRs) and 95% CIs of GDM across increasing quartiles of TG and RC levels. Potential covariates adjusted in models were selected a priori and included maternal age (years), ethnicity (Han Chinese, others), educational level (<16 years, ≥16 years), monthly average income per capital (<5000 Chinese yuan, ≥5000 Chinese yuan), pre-BMI (<18.5, 18.5–23.9, ≥24.0 kg/m2), nulliparous (yes, no), family history of diabetes (yes, no), habitual smoking before pregnancy (yes, no), habitual drinking before pregnancy (yes, no), regular physical activity during pregnancy (yes, no), and gestational weight gain (kg) at the time of blood sampling. TG and RC were also mutually adjusted. A restricted cubic spline transformation of RC was used to evaluate nonlinear associations between RC and the risk of GDM.
To further assess the impact of RC beyond the TG on GDM risk as well as considering the pre-BMI (one of the most important traditional risk factors of GDM), participants were assigned to 4 groups according to the cutoff points of RC or TG significantly associated with GDM (low TG/low RC, low TG/high RC, high TG/low RC, high TG/high RC). Power calculation shows that a sample size of 1870 participants with at least 560 in the low TG/low RC group and 190 in high TG/high RC group would support a power of 95% at the significance level of 0.05 to detect RRs. Then, we conducted a joint analysis using the log-Poisson regression model to estimate the RRs and 95% CIs for the association of TG, RC, and pre-BMI (<24.0, ≥24.0 kg/m2) with GMD.
All analyses were performed using SAS version 9.4 software (SAS Institute) and with a two-sided significance level of P < .05.
Results
General Characteristics of the Study Population
The present study involved 2528 participants in the final analyses (Fig. 1), of whom 256 (10.1%) developed GDM. The baseline characteristics and lipid profile are presented by presence or absence of GDM in Table 1. There were no significant differences in most characteristics, including ethnicity, education level, family income, family history of diabetes, physical activity during pregnancy, habitual drinking before pregnancy, and habitual smoking before pregnancy, between pregnant women with and without GDM. Women who developed GDM were older, with more overweight/obesity before pregnancy than the non-GDM group. Moreover, they had a lower proportion of nulliparity.
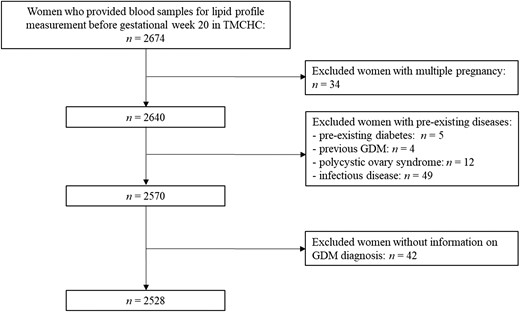
Flowchart of study population.
Participants characteristics and lipid profile according to presence or absence of GDMa
| Characteristics | Overall | Non-GDM | GDM | P value |
|---|---|---|---|---|
| n | 2528 | 2272 | 256 | |
| Age, y | 28.1 ± 3.4 | 28.0 ± 3.3 | 29.6 ± 3.7 | <.001 |
| Pre-pregnancy BMI, kg/m2 | 20.9 ± 2.8 | 20.7 ± 2.7 | 22.2 ± 3.4 | <.001 |
| Overweight (24.0 ≤pBMI <28.0 kg/m2) | 264 (10.4) | 214 (9.4) | 50 (19.5) | |
| Obesity (BMI ≥28.0 kg/m2) | 52 (2.1) | 35 (1.5) | 17 (6.6) | |
| Ethnicity (Han Chinese) | 2459 (97.3) | 2213 (97.4) | 246 (96.1) | .223 |
| Years of education | ||||
| ≥16 years | 1535 (60.7) | 1373 (60.4) | 162 (63.3) | .376 |
| Monthly income per capita, CNY | ||||
| ≥5000 | 1553 (60.7) | 1386 (61.0) | 167 (65.2) | .187 |
| Nulliparous | 2158 (85.4) | 1954 (86.0) | 204 (79.7) | .007 |
| Family history of diabetes | 227 (9.0) | 201 (8.9) | 26 (10.2) | .487 |
| Regular physical activity during pregnancyb | 489 (19.3) | 440 (19.4) | 49 (19.1) | .931 |
| Drinking before pregnancy | 49 (1.9) | 43 (1.9) | 6 (2.3) | .619 |
| Smoking before pregnancy | 85 (3.4) | 75 (3.3) | 10 (3.9) | .611 |
| GWG at the time of blood sampling, kg | 5.8 ± 5.1 | 5.8 ± 5.2 | 5.5 ± 4.6 | .346 |
| Gestational week at the time of blood sampling | 16.6 (16.0-17.3) | 16.6 (16.0-17.3) | 16.4 (16.0-17.0) | .013 |
| TG, mmol/L | 1.76 ± 0.72 | 1.72 ± 0.69 | 2.06 ± 0.91 | <.001 |
| TC, mmol/L | 4.88 ± 0.94 | 4.87 ± 0.94 | 5.00 ± 0.98 | .048 |
| HDL-C, mmol/L | 1.81 ± 0.46 | 1.82 ± 0.46 | 1.65 ± 0.46 | <.001 |
| LDL-C, mmol/L | 2.62 ± 0.83 | 2.61 ± 0.81 | 2.74 ± 0.92 | .016 |
| RC, mmol/L | 0.46 ± 0.36 | 0.44 ± 0.34 | 0.61 ± 0.49 | <.001 |
Abbreviations: BMI, body mass index; CNY, Chinese yuan; GDM, gestational diabetes mellitus; GWG, gestational weight gain; HDL-C, high-density lipoprotein cholesterol; LDL-C, low-density lipoprotein cholesterol; RC, remnant cholesterol; TC, total cholesterol; TG, triglyceride.
aData are presented as mean ± SD or median (IQR) for continuous variables. Categorical or categorized variables are presented as frequency (percentage). Student t test and the Mann-Whitney U test were used to compare continuous variable between non-GDM and GDM groups and Pearson χ2 test was used to compare rate or proportion for categorical variables.
bRegular physical activity during pregnancy was defined as exercise at moderate intensity ≥30 minutes once with frequency ≥3 times/wk.
Associations of TG and RC With GDM
The Spearman correlation coefficient between TG and RC was 0.257 (P < .001). The relative risks (RR) for GDM according to quartiles of TG and RC are presented in Table 2. After adjusting for potential confounders and mutually adjusting for TG and RC, the RRs (95% CIs) of GDM across the increasing quartiles of TG concentrations were 1.00 (reference), 0.92 (0.63, 1.34), 0.83 (0.56, 1.21), and 1.49 (1.05, 2.13), respectively. With respect to RC, the adjusted RRs (95% CIs) of GDM were 1.00 (reference), 1.35 (0.91, 1.99), 1.68 (1.16, 2.45), and 1.73 (1.19, 2.50), respectively. The regression splines demonstrated a continuous association between RC and the risk of GDM (Fig. 2).
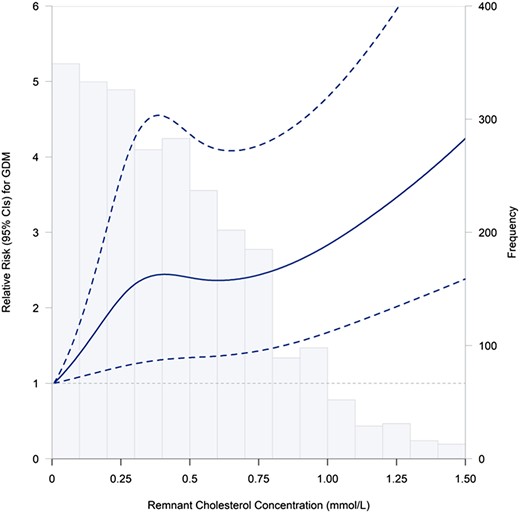
Relation between continuous RC and GDM risk. Splines represent adjusted RRs and 95% CIs of GDM in relation to RC concentrations (percentile 2.5%–97.5%). The solid line represents point estimates of RRs, and the dotted lines represent the 95% CI. The histogram represents frequency of participants according to RC concentrations. RRs were calculated by the restricted cubic spline log-Poisson regression model and were adjusted for maternal age (years), pre-pregnancy BMI (kg/m2), years of education (<16, ≥ 16), monthly average income per capita (<5000, ≥ 5000 CNY), nulliparous (yes, no), family history of diabetes (yes, no), smoking before pregnancy (yes, no), alcohol consumption before pregnancy (yes, no), regular physical activity during pregnancy (yes, no), and TG concentration. Abbreviations: CNY, Chinese yuan; GDM, gestational diabetes mellitus; RC, remnant cholesterol; TG, triglyceride.
Relative risk for GDM according to quartiles of TG and RC
| GDM | Crude RR (95% CI) | Adjusted RR (95% CI)a | |
|---|---|---|---|
| TG (mmol/L) | |||
| <1.27 | 49 (7.7) | ref. (1.00) | ref. (1.00) |
| 1.2–1.59 | 49 (7.9) | 0.93 (0.69, 1.48) | 0.92 (0.63, 1.34) |
| 1.60–2.07 | 49 (7.7) | 0.98 (0.67, 1.44) | 0.83 (0.56, 1.21) |
| ≥2.08 | 109 (17.1) | 2.21 (1.61, 3.04) | 1.49 (1.05, 2.13) |
| RC (mmol/L) | |||
| <0.19 | 38 (5.9) | ref. (1.00) | ref. (1.00) |
| 0.19–0.39 | 59 (9.3) | 1.57 (1.06, 2.33) | 1.35 (0.91, 1.99) |
| 0.40–0.63 | 77 (12.3) | 2.08 (1.43, 3.02) | 1.68 (1.16, 2.45) |
| ≥0.64 | 82 (13.2) | 2.24 (1.55, 3.23) | 1.73 (1.19, 2.50) |
Abbreviations: GDM, gestational diabetes mellitus; RC, remnant cholesterol; RR, relative risk; TG, triglyceride.
aAdjusted for maternal age, ethnicity, years of education, monthly average income per capita, pre-pregnancy BMI, nulliparous, family history of diabetes, smoking before pregnancy, alcohol consumption before pregnancy, regular physical activity during pregnancy, gestational week of blood sampling, and gestational weight gain at the time of blood sampling. In addition, TG and RC were also mutually adjusted.
The concentration of TG ≥2.08 mmol/L and RC ≥0.40 mmol/L were found to be independent risk factors for GDM and thus were applied as the cutoff points. Participants were hence arranged into discordant/concordant groups based on whether their TG and/or RC concentrations were higher than their respective cutoff points. The distribution of RC and TG by the discordant/concordant groups and the distribution stratified by pre-pregnancy BMI (pre-BMI) is shown in Figs. 3 and 4, respectively. Women with discordantly high TG and RC (low TG/high RC, high TG/low RC) accounted for a relatively large proportion (42.2%) of the participants, regardless of the pre-BMI (33.4% and 8.8% respectively).
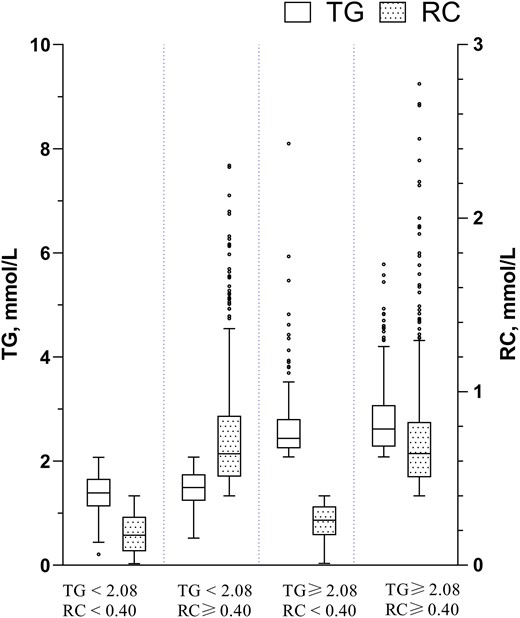
Box plot of RC and TG distributions.
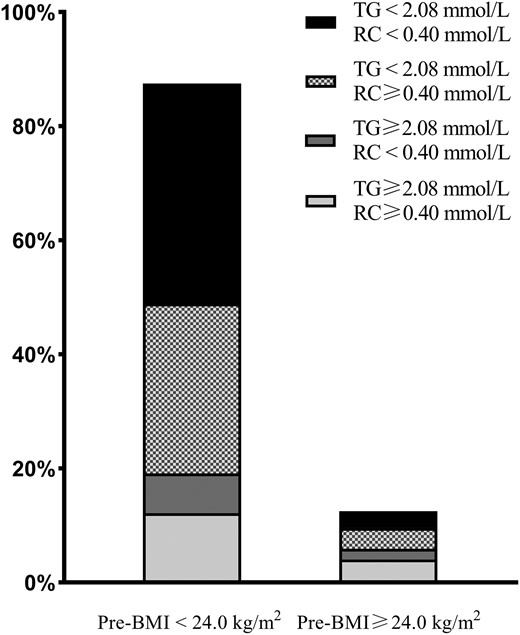
Accumulative bar diagram of RC and TG distributions stratified by Pre-BMI.
The RRs (95% CIs) of GDM associated with discordant/concordant TG and RC groups combined with pre-BMI were estimated and shown in Fig. 5. Among pregnant women without overweight/obesity before pregnancy, when compared with those in low TG/low RC group, the adjusted RR (95% CI) of GDM was 1.54 (1.08, 2.19) in low TG/high RC, 2.15 (1.33, 3.49) in high TG/low RC and 2.80 (1.94, 4.04) in high TG/high RC group. Of note, women with overweight/obesity before pregnancy had a significantly increased risk of GDM, and those combined with both high TG and high RC fall into the highest risk group (aRR: 4.80; 95% CI: 3.20, 7.18).
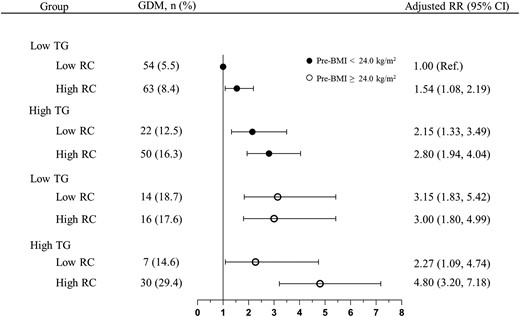
The combined effects of pre-pregnancy BMI, TG, and RC on GDM. Black circles: group with pre-BMI <24.0 kg/m2; White circles: group with pre-BMI ≥24.0 kg/m2. RRs were calculated by the log-Poisson regression model and were adjusted for maternal age, years of education, monthly average income per capita, nulliparous, family history of diabetes, smoking before pregnancy, alcohol consumption before pregnancy, and regular physical activity during pregnancy.Abbreviations: GDM, gestational diabetes mellitus; pre-BMI, pre-pregnancy BMI; RC, remnant cholesterol, TG, triglycerides.
Discussion
In a prospective cohort, we first found that (i) either elevated TG or RC levels were independently associated with increased risk of GDM; (ii) women with overweight/obesity before pregnancy combined with both high TG and high RC in early mid-pregnancy demonstrated the highest risk of GDM.
Elevated lipids level in pregnancy are generally considered to be normal physiological changes (19). We did find that the risk of GDM was not significantly elevated in the first 3 quartiles of the TG quartiles (7.7%, 7.8%, and 7.6%, respectively). However, in the fourth quartile group, the risk of developing GDM was significantly increased. Consistent with our findings, several studies (most of which were case-control studies) have shown that high TG concentrations in early pregnancy contribute to the development of subsequent GDM (7), implicating the role of TG in the pathogenesis of GDM (20).
Remnant cholesterol is the cholesterol content that consists of VLDL, IDL, and chylomicron remnants (13). Although plasma TG can be used as a surrogate measure of RC clinically, they represent different lipid disorders. Remnant cholesterol may contribute more directly to insulin resistance than TG. Thus, RC has been highlighted in lipid management in recent years. Previous studies found that RC was associated with type 2 diabetes mellitus and hyperglycemia (9, 10, 21-23). Although the mechanisms underlying RC-induced insulin resistance are not yet fully understood, the pro-inflammatory feature of RC may contribute to abnormal insulin resistance by increasing inflammation levels and affecting glucokinase translocation and activation (10, 15, 24, 25). Another possible explanation is the cholesterol-induced toxicity discussed in recent years (26). The accumulation of cholesterol in pancreatic β-cells also reduces glucose-stimulated insulin secretion and leads to the apoptosis of β-cells (27-29). Remnant cholesterol is larger and carries more cholesterol than LDL-C particles, so it can be more harmful to pancreatic β-cells.
Higher TG level was often observed before and during gestation in women with overweight/obesity (30-32). But in the present study, among women without overweight/obesity before pregnancy, either discordantly high TG or high RC was found to be associated with increased risk of GDM, and those with concordantly high TG and RC had the highest risk, although high TG is often accompanied by high RC. However, it is worth noting that 29.8% of pregnant women with normal pre-pregnancy BMI had discordantly high RC in relation to TG (low TG/high RC), which was associated with a 1.54-fold increased risk of GDM.
Our results showed that either elevated TG or RC levels were independently associated with an increased risk of GDM and these risks were more pronounced among women with concordantly high TG and RC, especially those who were overweight/obesity prior to pregnancy. It is suggested that along with traditional blood lipid markers like TG, RC should also warrant significant attention as an additional biomarker for identifying risk. Our results expand the current knowledge on the harm of RC and suggest it would help to recognize the residual risk factor of GDM and focus more attention on monitoring and management of RC beyond TG in the future. Given a relatively large proportion of pregnant women with low TG and discordantly high RC, our results support the importance of including RC for early monitoring factor of GDM risk. It is important to note that this study is an observational cohort study, which restricts its ability to make causal inferences. We cannot exclude the possibility that women with insulin resistance in early pregnancy may experience a surge in RC levels. Given the mutual dependence between insulin resistance and blood lipid levels (33, 34), it may be advisable to manage lipid disorders by adhering to a balanced diet and engaging in appropriate physical activity. Such interventions have been speculated to not only improve insulin sensitivity but also reduce levels of TG and RC (35, 36).
This study has several strengths. Firstly, this study was embedded in a large prospective, observational cohort study with the collection of standardized data and biological samples, and the use of available clinical and biochemical measures, thus able to show the independent predictive power of RC as a continuous measure. Secondly, the lipid profiles were measured in the fasting state, which could reduce the potential effect of food intake on lipid levels, and the concentration of all lipid profile indicators was measured directly in this study, avoiding the bias caused by using the Friedewald formula. Several limitations must be mentioned. First, as with all observational studies, we cannot completely exclude the possibility of residual confounding by unmeasured factors such as apo B, fasting glucose, and insulin concentrations prior to pregnancy or during early pregnancy. Second, the data on pre-pregnancy body weight were self-reported, which may be susceptible to bias. However, these were thought acceptable because we collected those data at enrollment in early pregnancy when body weight did not change significantly (37). Third, although we had a relatively large sample and the blood was primarily sampled during gestational week 16 to 17, the fact that only one-time lipid measurement occurred could lead to a small bias in the results. Last, it must be mentioned that the estimation of RC is not completely accurate. However, this method is readily available from the hospital lipid tests and without extra cost, making primary prevention more practicable. It is important to note that most of the participants in the study were of Han Chinese descent, so the application of the findings to other populations or countries should be carefully considered.
In conclusion, discordantly high levels of RC in relation to TG were associated with GDM. Early monitoring and management of RC and TG are helpful in preventing GDM. Those with high pre-BMI, high TG, and high RC may be at the highest risk and need more attention.
Acknowledgments
We thank the all the children, families, and hospital staff whose participation made this study possible. The authors thank Liangkai Chen (Tongji Medical College, Huazhong University of Science and Technology, Wuhan) for helpful discussions during the development of the study. Dr. Chen received no financial support for his participation.
Funding
This study was supported by the National Program on Basic Research Project of China (2019FY101003 and 2013FY114200). The funder had no role in the design and conduct of the study.
Author Contributions
W.W. researched data, contributed to discussion, and wrote, reviewed, and edited the manuscript. N.L. researched data and reviewed and edited the manuscript. X.W., X.Z., M.T., L.L., Q.L., H.Z., J.L., reviewed and edited the manuscript. X.Y., L.H., and N.Y. contributed to discussions and reviewed and edited the manuscript. All authors approved the final version of the manuscript. N.Y. is the guarantor of this work and had full access to all the data in the study and takes responsibility for the integrity of the data and the accuracy of the data analysis.
Disclosures
The authors declare that they have no conflicts of interest.
Data Availability
Data described in the manuscript, code book, and analytic code will be made available upon request.
References
Abbreviations
- FI
fasting insulin
- GDM
gestational diabetes mellitus
- HDL-C
high-density lipoprotein cholesterol
- IDL-C
intermediate-density lipoprotein cholesterol
- LDL-C
low-density lipoprotein cholesterol
- OGTT
oral glucose tolerance test
- pre-BMI
pre-pregnancy body mass index
- RC
remnant cholesterol
- RR
relative risk
- TC
total cholesterol
- TG
triglycerides
- TMCHC
Tongji Maternal and Child Health Cohort
- VLDL
very low-density lipoprotein cholesterol
