


Abstract
Prior to this study, it is known that type 2 diabetes is linked to obesity and a sedentary lifestyle, leading to inadequate β-cell function and insulin resistance. Limited research has explored the metabolic effects of combining exercise training with antidiabetic medications, particularly focusing on insulin secretion in patients with type 2 diabetes and moderately preserved β-cell function.
The effect of the interaction of semaglutide and physical training on pancreatic β-cell secretory function is unknown in patients with type 2 diabetes.
Thirty-one patients with type 2 diabetes underwent 12 weeks of aerobic training alone or concurrent to treatment with semaglutide. Patients randomly allocated to concurrent semaglutide and training were treated with semaglutide for 20 weeks before the training and evaluated at inclusion and again before and after the training intervention. Patients randomized to training were evaluated before and after training. The primary outcome was a change in insulin secretory capacity with training, evaluated by a 2-stepped hyperglycemic (20 and 30 mM) clamp.
Training increased the incremental area under the curve for insulin from 21 to 27 nM × 2 hours (ratio 1.28, 95% CI 1.02-1.60) during clamp step 1 and from 40 to 64 nM × 2 hours (ratio 1.61, 95% CI 1.25-2.07) during step 2. Semaglutide treatment increased insulin secretion from 16 to 111 nM × 2 hours (ratio 7.10, 95% CI 3.68-13.71), and from 35 to 447 nM × 2 hours (ratio 12.74, 95% CI 5.65-28.71), correspondingly. Semaglutide and training increased insulin secretion from 130 to 171 nM × 2 hours (ratio 1.31, 95% CI 1.06-1.63), and from 525 to 697 nM × 2 hours (ratio 1.33, 95% CI 1.02-1.72), correspondingly. The median increase in total insulin secretion with the combination was 134 nM × 2 hours greater (95% CI 108-232) than with training.
The combination of aerobic training and semaglutide treatment synergistically improved β-cell secretory function. (ClinicalTrials.gov number, ID NCT04383197).
Type 2 diabetes affects more than 422 million individuals worldwide (1) and dramatically increases the risk of both cardiovascular and microvascular disease and, ultimately, premature mortality (2). Obesity and a sedentary lifestyle are strongly and independently associated with type 2 diabetes development and progression (3).
Inadequate β-cell function and central and peripheral insulin resistance are core pathophysiological hallmarks of type 2 diabetes and are responsible for dysregulated blood glucose (4). Current guidelines for pharmacological management of type 2 diabetes target these hallmarks and cardiovascular risk factors directly and indirectly, in parallel with the promotion of weight loss and increased physical activity (5).
Aerobic training improves insulin-mediated glucose uptake and glycemic control in patients with type 2 diabetes (6, 7), dependent on the prevailing β-cell function (8, 9). In addition, β-cell function increases with physical training, but only in the subset of patients with a preserved β-cell function (10).
Few studies have investigated the metabolic effects of acute (11-13) and longer-term (14-18) exercise interventions combined with various antidiabetic medications in individuals with obesity or type 2 diabetes. Two effective treatments in combination sometimes (13, 17, 18) but not always (14, 15, 19) complement each other.
Previous studies using exercise training in patients with type 2 diabetes have predominantly focused on the effect on insulin sensitivity, and studies with combined exercise training and glucagon-like peptide-1 (GLP-1) receptor agonist treatment have focused on body weight (17) and glycemic control (18). Since both exercise training (10, 20, 21) and GLP-1 receptor agonist treatment (22, 23) increase insulin secretion in patients with type 2 diabetes, we found it physiologically and clinically relevant to study the combination of the 2. We hypothesized that aerobic exercise training with and without concurrent steady-state semaglutide treatment would improve insulin secretory capacity in patients with type 2 diabetes with a moderately preserved β-cell function.
Materials and Methods
General Study Overview
The trial was conducted at the Exercise Laboratories at the University of Copenhagen, Denmark. Patients with type 2 diabetes were randomly assigned (by drawing lots) to either 12 weeks of aerobic training or to treatment with semaglutide once weekly for 20 weeks before commencement of 12 weeks of aerobic training combined with continued semaglutide treatment. The regional ethics committee approved the study (H-19008233), and participants’ oral and written informed consent were obtained before enrollment. The study adheres to the principles of the Declaration of Helsinki.
A complete overview of the protocol is provided in Fig. 1.
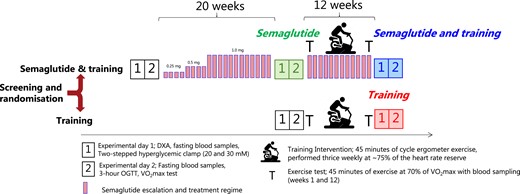
Outline of the protocol. Participants with type 2 diabetes were randomized to undergo either 12 weeks of aerobic training (“Training”) or to undergo treatment with semaglutide (“Semaglutide and training”) for 20 weeks before entering the 12 weeks training regimen while continuing semaglutide treatment. Before and after each intervention (“Semaglutide,” “Semaglutide and training,” and “Training”), 2 experimental days were carried out. The primary outcome was a change in β-cell secretory function assessed by a hyperglycemic (20 and 30 mM) clamp. Semaglutide was taken once weekly and escalated according to the guidelines. The follow-up 2-stepped hyperglycemic clamp (experimental day 1) was always performed 40 to 48 hours after the last bout of exercise and 7 days after the last dosage of semaglutide. The next dosage of semaglutide was postponed to completion of the oral glucose tolerance test. In weeks 1 and 12 of the training intervention, the participants performed a 45-minute exercise test at 70% of VO2max with blood sampling to investigate adaptations and interactions to the glucoregulatory and inflammatory response. The training was performed on a cycle ergometer 3 times weekly at an average intensity of 75% of the heart rate reserve (see Appendix (24)).
Participants
Participants were recruited through advertisements in newspapers and social media. Eligible participants were weight stable (<2 kg change in 6 months, by interview) and overweight or obese (body mass index, the weight in kilograms divided by the square of the height in meters >28) and comprised inactive men and women (age 40-70 years) diagnosed with type 2 diabetes (glycated hemoglobin ≥48 mmol/mol, if untreated) with moderately preserved β-cell function. The latter was defined by an increase in plasma C-peptide of 500 pM or more 6 minutes after intravenous administration of 1 mg of glucagon (10) (GlucaGen, Novo Nordisk, Bagsværd, Denmark) performed at the screening visit. Primary exclusion criteria were insulin treatment or any medical history of pancreatitis. A complete overview of inclusion and exclusion criteria is provided elsewhere (Appendix (24)).
Interventions
The training was carried out on a bicycle ergometer (Lode Corrival, Lode BV, Netherlands) 3 times per week for 12 weeks. Each session was supervised and lasted 45 minutes with an average heart rate reserve of 75% of maximum (see Fig. S3 for details (24)).
Semaglutide was administered once weekly by subcutaneous injection of the recommended starting dose of 0.25 mg (weeks 1-4), then escalated to 0.5 mg (weeks 4-8) until a maintenance dose of 0.5 mg or 1.0 mg was achieved (week 9-20), ensuring 12 to 16 weeks of steady-state treatment before training commenced (Fig. 1). Five patients were not escalated above 0.5 mg to avoid overtreatment, and 1 patient was reduced to 0.5 mg after a single dose of 1.0 mg due to unacceptable adverse effects (dizziness). Five patients had metformin dosing reduced or discontinued (all during semaglutide escalation, weeks 1-8), and 1 patient discontinued sodium–glucose cotransporter-2 inhibitor treatment (during the training period) to avoid overtreatment. Adjustments to antidiabetic medication were made solely in the semaglutide group.
Outcomes and Procedures
The primary outcome was the change in β-cell secretory function from baseline following training (12 weeks) and following the combination of steady-state semaglutide treatment and training (12 weeks). β-Cell secretory function was evaluated by the incremental area under the curve (AUC) for insulin obtained during the 2-stepped hyperglycemic clamp, performed before and after training and/or semaglutide treatment. Secondary outcomes were changes in glucose tolerance, β-cell glucose sensitivity, glycated hemoglobin, maximal oxygen uptake (V̇O2max), and body composition. Exploratory outcomes were a change in the proinsulin–insulin ratio during the hyperglycemic clamp and a change in GLP-1 and glucose-dependent insulinotropic polypeptide (GIP) secretion during oral glucose tolerance testing. We assessed changes in total cholesterol, low-density lipoprotein, high-density lipoprotein, triglyceride, glycerol and free fatty acids, high-sensitivity C-reactive protein, aspartate aminotransferase, alanine aminotransferase (ALAT), and alkaline phosphatase, along with the following inflammatory makers in plasma; interferon-γ, interleukin (IL)-2, IL-6, IL-10, IL-12p70, IL-17A, and tumor necrosis factor-α. We explored the glucoregulatory and inflammatory response to an acute bout of exercise (45 minutes at 70% VO2max) in weeks 1 and 12 of the training intervention, to provide a detailed picture of potential interactions of acute exercise and semaglutide and the adaptation to training.
Experiments
Before and after the interventions, participants were admitted to the laboratory at 8.00 Am for analysis of body composition by dual-energy x-ray absorptiometry scan followed by a 4-hour 2-stepped hyperglycemic clamp (plasma glucose concentrations of 20 and 30 mM). In the combination group, the hyperglycemic clamp was always performed 40 to 48 hours after the last bout of exercise and on day 7 following their last dose of semaglutide. On the following day, participants were readmitted to undergo an oral glucose tolerance test (3 hours, 75 g of glucose), with arterialized blood collected every 15 minutes. Detailed information is presented elsewhere; Appendix (24))
Sample Size and Power
Based on published data from previous studies, we assumed that training alone would increase AUC of insulin by 29 ± 30% during each hyperglycemic step, and that the β-cell secretory function would increase by a ratio of at least 2.16 (95% CI 1.91-2.43) with semaglutide (10, 22). Assuming that training would produce a similar relative increase in β-cell secretory function in the semaglutide-treated group, we calculated that 12 patients in each group would provide 82% power to detect a 2.2 times greater absolute change in glucose-stimulated insulin secretion with the combination of training and semaglutide, using a 2-tailed independent sample t-test with α=.05. The power calculation was performed with G*Power 3.1.9.3 (Heinrich-Heine-University, Düsseldorf, Germany).
Statistical Analysis
The primary outcome was assessed according to the intention to treat principle, and no participants withdrew following randomization. To detect within-group effects of training, we performed a 2-way analysis of variance for repeated measures or a mixed-effects model in the case of missing data. All missing data were assumed to be missing at random. The Šidák method was used to adjust for multiple comparisons and calculate the least-squares means with either 95% CI or ±SD, depending on the data distribution. Distribution was tested using the D’Agostino–Pearson test. When the distribution of the data was skewed (ie, endpoints containing insulin and ratios of proinsulin), data were log-transformed before analysis for repeated measures, and afterwards converted back to the original scale for presenting as geometric means with 95% CI and change reported in ratios of geometric means. Estimated treatment differences of outcomes with training between the 2 groups (postintervention values minus preintervention values) were tested using unpaired Student's t-test or the Mann–Whitney U test when the data were non-normally distributed. Effects of the initial semaglutide treatment were calculated using Student's t-tests, and not subjected to direct comparisons with the effects of training alone or with the combination of training and semaglutide. Graphpad Prism 9.4.1 (Dotmatics, San Diego, CA, USA) was used for statistical analysis of all outcomes.
Results
Participants
Thirty-one obese participants with type 2 diabetes were allocated to participate in this trial: 16 in the combined semaglutide and training group and 15 in the training group. Four participants in the semaglutide and training group were already in treatment with a GLP-1 receptor agonist before enrollment and were not included in the analysis of change from baseline (Fig. S1 (24)). All participants completed the training intervention. Accordingly, data from 16 participants (2 females and 14 males) in the combined semaglutide and training group (mean age, 59 ± 6 years; mean time since diagnosis of diabetes, 5.2 ± 3.0 years) and 15 participants (2 females and 13 males) in the training group (mean age, 56 ± 6 years; mean time since diagnosis of diabetes, 4.2 ± 4.1 years) were analyzed before and after the training intervention, while 12 of the 16 participants in the combined semaglutide and training group were analyzed before and after the initial 20-week semaglutide treatment. For a complete overview of participant characteristics, see Table 1.
Baseline and change in subject characteristics
| Variable | Group | Intervention | ETD | |||
|---|---|---|---|---|---|---|
| Training (n = 15) | Semaglutide and training (n = 16) | Semaglutide (n = 12) | Semaglutide and training (n = 16) | Training (n = 15) | ΔSemaglutide and training vs ΔTraining | |
| Change (95% CI) | Change (95% CI) | Change (95% CI) | Difference (95% CI) | |||
| Age, years | 56 ± 5.7 | 59 ± 6.2 | — | — | — | — |
| T2D duration, years | 4.2 ± 4 | 5.2 ± 3 | — | — | — | — |
| Body mass, kg | 110.3 ± 21.1 | 111.7 ± 22.3 | −6.7 (−9.9 to −3.5) | −2.2 (−4.2 to −0.2) | −1.2 (−3.3 to 0.9) | −1.0 (−3.5 to 1.5) |
| Height, m | 1.8 ± 0.1 | 1.8 ± 0.1 | — | — | — | — |
| BMI, kg/m2 | 34.6 ± 5.4 | 34.8 ± 4.8 | −2.1 (−3.0 to −1.2) | −0.7 (−1.3 to 0.0) | −0.4 (−1.0 to 0.3) | −0.3 (−1.1 to 0.5) |
| Lean mass, kg | 68.1 ± 11 | 67.3 ± 12.5 | −2.1 (−3.3 to −1.1) | 0.2 (−1.1 to 1.5) | 0.1 (−1.2 to 1.5) | 0.1 (−1.5 to 1.7) |
| Fat mass, kg | 42 ± 13.7 | 43.6 ± 10.9 | −5.2 (−7.8 to −2.5) | −2.1 (−4.0 to −0.2) | −2.4 (−4.3 to −0.5) | 0.3 (−2.0 to 2.7) |
| Visceral fat, kg | 3.4 ± 1.6 | 3.9 ± 1.6 | −0.8 (−1.3 to −0.4) | −0.5 (−0.9 to −0.1) | − 0.3 (−0.8 to 0.1) | −0.2 (−0.7 to 0.4) |
| Body fat percentage, % | 37.5 ± 6.8 | 39.3 ± 2.9 | −2.2 (−3.6 to −0.8) | −1.5 (−2.9 to −0.2) | −1.5(−2.8 to −0.1) | −0.1 (−1.7 to 1.6) |
| Systolic BP, mmHg | 129 ± 16 | 135 ± 13 | −4 (−9 to 0) | −5 (−10 to −1) | −3 (− 8 to 2) | −2 (−8 to 3.5) |
| Diastolic BP, mmHg | 83 ± 11 | 85 ± 9 | −4 (−6 to −1) | −4 (−8 to 1) | −4 (−9 to 0) | 0 (−5 to 6) |
| Resting heart rate, bpm | 66 ± 11 | 66 ± 7 | 4 (1 to 7) | −4 (−6 to −2) | −5 (−7 to −2) | 1 (−2 to 3) |
| HbA1c, mmol/mol | 57 ± 11 | 65 ± 15 | −16 (−25 to −7) | −6 (−10 to −1.4) | −5 (−9 to −0.4) | −1 (−6 to 4) |
| HbA1c, % | 7.4 ± 1.1 | 8.1 ± 1.3 | −1.4 (−2.2 to −0.6) | −0.5 (−0.9 to −0.1) | −0.4 (−0.8 to −0.04) | −0.1 (−0.5 to 0.4) |
| Fasting glucose, mmol/L | 8.6 ± 1 | 9.7 ± 2.7 | −3.2 (−4.4 to −1.9) | −0.5 (−0.9 to −0.1) | −0.7 (−1.2 to −0.3) | 0.3 (−0.3 to 0.8) |
| Fasting insulin, pmol/L | 158 ± 59 | 180 ± 54 | −1 (−26 to 24) | −22 (−47 to 4) | −18 (−44 to 8) | −3 (−34 to 28) |
| Fasting C-peptide, pmol/L | 1296 ± 313 | 1566 ± 484 | 61 (−91 to 213) | −101 (−229 to 27) | −44 (−176 to 88) | −57 (−217 to 103) |
| Δ 6 minute C-peptide, pmol/L | 989 ± 603 | 922 ± 567 | — | — | — | — |
| V̇O2max, L/min | 2.8 ± 0.49 | 2.68 ± 0.52 | −0.13 (−0.29 to 0.43) | 0.39 (0.20 to 0.58) | 0.37 (0.17 to 0.56) | 0.02 (−0.21 to 0.26) |
| V̇O2max, mL/min/kg | 25.9 ± 4.9 | 24.4 ± 2.9 | 0.2 (−1.8 to 2.1) | 4.2 (2.7 to 5.7) | 3.4 (1.9 to 5.0) | 0.8 (−1.1 to 2.6) |
Thirty-one participants with type 2 diabetes underwent randomization to either 20 weeks of semaglutide treatment (0.5-1.0 mg) followed by 12 weeks of semaglutide and aerobic training (n = 16) or directly to 12 weeks of aerobic training (n = 15). Change with semaglutide alone (20 weeks) was assessed in a subgroup (n = 12), and all subjects were assessed before and after training with and without concomitant semaglutide treatment. Data are presented as means ± SD, and changes with each intervention are reported as mean delta values and 95% CI. The within-group effects of training and combined semaglutide and training were analyzed using repeated measures 2-way ANOVA or mixed effects model approach. ETD denotes the difference in response to training in between the 2 groups and was calculated with a 2-sided unpaired t-test and reported as the response to training alone subtracted from the response to training in combination with semaglutide with 95% CI. Δ 6 minutes C-peptide is the increase in C-peptide concentration 6 minutes after administration of 1.0 mg of glucagon intravenously, performed at the screening visits. Changes in glycemic control and body composition are also shown in Fig. 2. To convert plasma insulin to µU/L, divide by 6.0.
Abbreviations: ANOVA< analysis of variance; BMI, body mass index; BP, blood pressure; ETD, estimated treatment difference; HbA1c, glycated hemoglobin; T2D, type 2 diabetes; V̇O2max, maximal oxygen uptake.
Intervention and Cardiorespiratory Fitness
The average workload through all sessions was 114 ± 24 W in the combined semaglutide and training group and 127 ± 32 W in the training group. From the first 2 weeks to the last 2 weeks (weeks 11 and 12) of the training intervention, the average workload increased by 18 ± 11% and 27 ± 18% in the combined semaglutide and training and the training group, respectively. The average exercise intensity was 73 ± 4% of the heart rate reserve in the combined semaglutide and training group, and 75 ± 6% in the training group.
The training intervention improved V̇O2max by ∼380 mL of O2 per minute in both groups (Table 1). The combined semaglutide and training group completed 35 ± 1 sessions, and the training group completed 35 ± 2 out of 36 training sessions. The average workload required to sustain 70% of V̇O2max through the last minute of the 45 minutes of the exercise test performed in weeks 1 and 12 of the training intervention increased from 84 ± 24 to 117 ± 28 W in the combination group and 94 ± 35 to 123 ± 28 W in the training group (both P < .01), with no group differences.
Glycemic Control and Body Composition
Glycated hemoglobin levels improved by −16 mmol/mol (95% CI −25 to −7) with 20 weeks of semaglutide treatment. The combination of semaglutide and training improved glycated hemoglobin similarly to training alone (−6 and −5 mmol/mol, respectively), albeit 12 of 16 participants in the combination group decreased below 48 mmol/mol compared with 5 of 15 participants in the training group (Table 1 and Fig. 2A). These changes were also reflected in the fasting plasma glucose, which improved with semaglutide by −3.2 mM (95% CI −4.4 to −1.9), with semaglutide in combination with training by −0.5 mM (95% CI −0.9 to −0.1), and with training alone by −0.7 mM (95% CI −1.2 to −0.3) (Fig. 2B and Table 1).
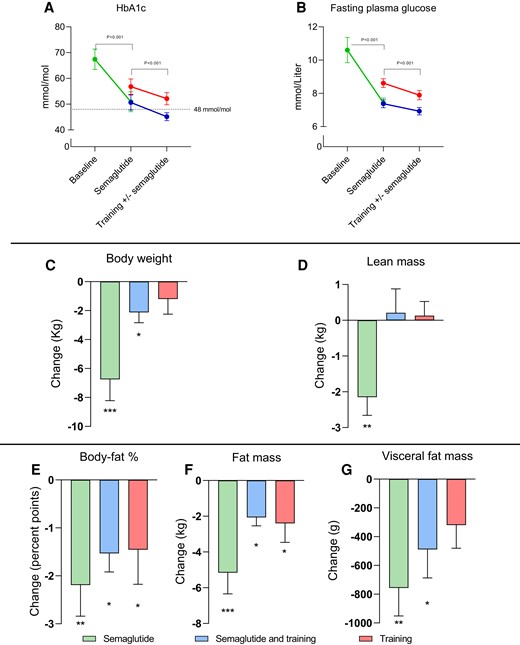
Change in glycemic control and body composition with 20 weeks of semaglutide treatment (green, n = 12), followed by 12 weeks of exercise combined with semaglutide (blue, n = 16), and corresponding change with exercise alone (red, n = 15), in patients with type 2 diabetes. In all panels, mean values are presented with standard errors (I bars). P values in A and B indicate the change with semaglutide and the main effect with the training intervention. Within group changes were analyzed by repeated measures 2-way ANOVA for Semaglutide + Training, and Training. A 2 sided paired Student’s t-test was used for evaluation of semaglutide alone. Fasting plasma glucose was lower with semaglutide alone and in combination with training than training alone before and after the training intervention (P = .022, repeated measures, 2-way ANOVA). Asterisks denotes change within the group: *P < .05, **P < .01, and ***P < .001.
Semaglutide treatment induced weight loss of −6.7 kg (95% CI −9.9 to −3.5). After training, the combination group had a minor weight loss of −2.1 (−95% CI −3.0 to −1.2), while training alone did not alter body weight significantly. Only weight loss with semaglutide was associated with a reduction in lean mass, while lean mass was maintained in both training groups. In all groups, fat mass and fat percentage decreased. Visceral fat content decreased with semaglutide and with combined semaglutide and training (Table 1 and Fig. 2G).
Hyperglycemic Clamp
Plasma insulin and C-peptide concentrations during hyperglycemic clamps are shown in Fig. 3 and Table 2.
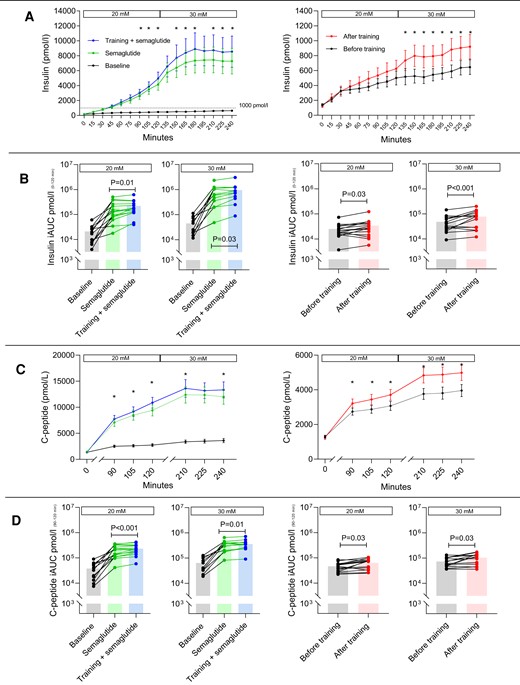
Hyperglycemic clamp. Effects of semaglutide and training on insulin and C-peptide. Concentrations of insulin and C-peptide obtained from the 2-step hyperglycemic clamp (20 and 30 mM) before and after 20 weeks of semaglutide treatment and before and after 12 weeks of aerobic ergometer training in combination with semaglutide (left chart) or alone (right chart) (A). Note the differing scale on the ordinate. (B) The incremental area under the curve of insulin, derived from A, using a logarithmic scale. Corresponding C-peptide concentrations are shown in C and D. P values on the iAUC (incremental area under the curve) bar plots (B and D) are within-group values calculated from repeated measures 2-way analysis of variance or mixed model, and individual changes are shown. iAUC values for insulin and C-peptide were always higher with semaglutide (P < .0001), and increased with training in both groups. In A and C, mean values are presented with standard errors (I-bars), and an asterisk indicates a difference (P < .05) in insulin or C-peptide concentration with training within the timepoint after adjusting for multiple comparisons by Šidák correction.
Hyperglycemic clamp, β-cell secretory function
| Variable | Semaglutide (n = 12, 20 weeks) | Semaglutide and training (n = 16, 12 weeks) | Training (n = 15, 12 weeks) | ||||||
|---|---|---|---|---|---|---|---|---|---|
| Glucose-stimulated insulin iAUC | Total (240 minutes) | 20 mM (120 minutes) | 30 mM (120 minutes) | Total (240 minutes) | 20 mM (120 minutes) | 30 mM (120 minutes) | Total (240 minutes) | 20 mM (120 minutes) | 30 mM (120 minutes) |
| Before, nmol/L × X min | 52 (29 to 92) | 16 (9 to 26) | 35 (22 to 56) | 658 (335 to 1291) | 130 (75 to 225) | 525 (268 to 1030) | 61 (40 to 94) | 21 (15 to 31) | 40 (26 to 60) |
| After, nmol/L × X min | 562 (269 to 1178) | 111 (62 to 202) | 447 (211 to 947) | 873 (501 to 1519) | 171 (111 to 261) | 697 (393 to 1232) | 91.4 (56.0 to 149.3) | 27 (18 to 43) | 64 (38 to 104) |
| Change from before (ratio) | 10.89 (4.16 to 24.20) | 7.10 (3.68 to 13.71) | 12.74 (5.65 to 28.71) | 1.33 (1.04 to 1.69) | 1.31 (1.06 to 1.63) | 1.33 (1.02 to 1.72) | 1.50 (1.19 to 1.90) | 1.28 (1.02 to 1.60) | 1.61 (1.25 to 2.07) |
| ETD vs training, nmol/L × X min | — | — | — | 134 (108 to 232) | 19 (−12 to 40) | 118 (12 to 200) | — | — | — |
| Glucose-stimulated C-peptide iAUC | Total (60 minutes) | 20 mM (30 minutes) | 30 mM (30 minutes) | Total (60 minutes) | 20 mM (30 minutes) | 30 mM (30 minutes) | Total (60 minutes) | 20 mM (30 minutes) | 30 mM (30 minutes) |
| Before, nmol/L × X min | 101 ± 65 | 38 ± 26 | 64 ± 38 | 532 ± 261 | 205 ± 104 | 324 ± 152 | 124 ± 48 | 48 ± 18 | 75 ± 30 |
| After, nmol/L × X min | 466 ± 221 | 205 ± 104 | 334 ± 150 | 596 ± 268 | 233 ± 103 | 359 ± 159 | 176 ± 69 | 66 ± 26 | 108 ± 46 |
| Change from before, nmol/L × X min | 365 (214 to 516) | 141 (82 to 200) | 226 (143 to 308) | 64 (22 to 106) | 28 (12 to 44) | 35 (8 to 63) | 52 (12 to 93) | 18 (2 to 35) | 33 (7 to 60) |
| ETD vs training, nmol/L × X min | — | — | — | 11 (−39-62) | 10 (−10 to 30) | 2 (−31 to 35) | — | — | — |
| Proinsulin | Baseline | 20 mM | 30 mM | Baseline | 20 mM | 30 mM | Baseline | 20 mM | 30 mM |
| Before, pmol/L | 24 ± 12 | 34 ± 14 | 48 ± 26 | 14 ± 9 | 63 ± 27 | 113 ± 44 | 13 ± 8 | 25 ± 14 | 32 ± 16 |
| After, pmol/L | 15 ± 10 | 62 ± 29 | 115 ± 54 | 13 ± 11 | 70 ± 27 | 120 ± 47 | 11 ± 8 | 25 ± 16 | 33 ± 20 |
| Change from before, pmol/L | −9 (−5 to −13) | 22 (7 to 38) | 70 (39 to 102) | −1 (−2 to 4) | 7 (1 to 13) | 7 (−4 to 18) | −2 (−5 to 2) | 2 (−9 to 12) | 0 (−10 to 10) |
| ETD vs training, pmol/L | — | — | — | 1 (−3 to 4) | 6 (−2 to 14) | 5 (−8 to 18) | — | — | — |
| Proinsulin/insulin ratio | Baseline | 20 mM | 30 mM | Baseline | 20 mM | 30 mM | Baseline | 20 mM | 30 mM |
| Before, (pM/pM) × 103 | 126 (83 to 192) | 76 (53 to 109) | 96 (63 to 145) | 65 (46 to 96) | 19 (12 to 29) | 20 (12 to 33) | 81 (60 to 109) | 50 (38 to 66) | 50 (38 to 67) |
| After, (pM/pM) × 103 | 75 (46 to 120) | 20 (12 to 33) | 21 (12 to 36) | 67 (42 to 104) | 17 (11 to 26) | 17 (9 to 30) | 82 (59 to 113) | 41 (31 to 54) | 38 (26 to 56) |
| Change from before (ratio) | 0.59 (0.47 to 0.74) | 0.27 (0.19 to 0.38) | 0.24 (0.17 to 0.33) | 1.02 (0.80 to 1.31) | 0.88 (0.74 to 1.05) | 0.84 (0.66 to 1.08) | 1.01 (0.78 to 1.31) | 0.82 (0.69 to 0.98) | 0.76 (0.60 to 0.96) |
| ETD vs training, (pM/pM) × 103 | — | — | — | 2 (−28 to 23) | 9 (−6 to 16) | 14 (−2 to 17) | — | — | — |
| Proinsulin/C-peptide ratio | Baseline | 20 mM | 30 mM | Baseline | 20 mM | 30 mM | Baseline | 20 mM | 30 mM |
| Before, (pM/pM) × 103 | 15.4 (9.9 to 23.9) | 12.0 (8.7 to 16.6) | 15.3 (10.2 to 22.8) | 7.3 (4.8 to 11.1) | 6.7 (5.1 to 8.8) | 9.2 (6.9 to 12.4) | 8.4 (6.0 to 12.0) | 7.0 (5.3 to 9.1) | 7.4 (5.8 to 9.6) |
| After, (pM/pM) × 103 | 8.9 (5.6 to 14.2) | 6.8 (4.8 to 9.7) | 9.7 (6.9 to 13.5) | 6.9 (4.3 to 10.9) | 6.7 (4.8 to 9.3) | 8.8 (5.9 to 13.0) | 7.4 (5.8 to 9.4) | 6.1 (4.6 to 8.0) | 6.0 (4.4 to 8.3) |
| Change from before (ratio) | 0.58 (0.46 to 0.73) | 0.57 (0.46 to 0.70) | 0.64 (0.47 to 0.88) | 0.94 (0.73 to 1.21) | 1.00 (0.85 to 1.18) | 0.94 (0.79 to 1.15) | 0.88 (0.67 to 1.16) | 0.87 (0.73 to 1.03) | 0.81 (0.68 to 0.97) |
| ETD vs training, (pM/pM) × 103 | — | — | — | 0.5 (−1.0 to 3.0) | 2.1 (−0.2 to 2.4) | 0.1 (−0.6 to 2.9) | — | — | — |
Effects of semaglutide, training, and the combination of the 2 on plasma markers of β-cell function and glucose tolerance, derived from a 2-stepped hyperglycemic clamp and an oral glucose tolerance test. Results from before and after each intervention (“Semaglutide,” “Semaglutide and training,” and “Training”) are presented as either means ± SD or geometric means with 95% CI. Change from before is presented as means with 95% CI or ratios of geometric means with 95% CI and represents the within group change calculated by repeated measures 2-way ANOVA or by mixed model. ETD denotes the estimated treatment difference between the Semaglutide and training group compared with the Training group, calculated using a 2-sided unpaired t-test or the Mann–Whitney U-test and reported as the response to training alone subtracted from the response to training in combination with semaglutide with 95% CI. The “X” in the unit, nmol/L × X min, refers to the specific time period denoted in each column.
Abbreviations: ETD, estimated treatment difference; iAUC, incremental area under the curve.
Plasma insulin concentrations, expressed as geometric means of the incremental AUC, improved markedly (P < .0001) with 20 weeks of semaglutide treatment at step 1 from 16 to 111 nM × 2 hours (ratio 7.10, 95% CI 3.68-13.71) and step 2 from 35 to 447 nM × 2 hours (ratio 12.74, 95% CI 5.65-28.71). The combination of semaglutide and 12 weeks of training further improved insulin secretory capacity, at step 1 from 130 to 171 nM × 2 hours (ratio 1.31, 95% CI 1.06-1.63, P < .01), and step 2 from 525 to 697 nM × 2 hours (ratio 1.33, 95% CI 1.02-1.72, P < .03). With 12 weeks of training alone, insulin secretory capacity improved at step 1 from 21 to 27 nM × 2 hours (ratio 1.28, 95% CI 1.02-1.60, P < .03), and at step 2 from 40 to 64 nM × 2 hours (ratio 1.61, 95% CI 1.25-2.07, P < .001).
Correspondingly, C-peptide secretion increased with all interventions at both hyperglycemic steps.
Compared with training alone, the absolute change in incremental insulin area was greater with the combination of training and semaglutide treatment during 30 mM glucose stimulation with a median difference of 118 nM × 2 hours (95% CI 12-200, P < .05, Mann–Whitney U test) and with a median difference of 134 nM × 4 hours (95% CI 108-232, P < .05) in total for both hyperglycemic steps. We found no group-dependent difference in the change of insulin secretion during 20 mM glucose stimulation, and the increase in incremental C-peptide area with training was comparable in the 2 groups (Table 2).
Proinsulin to insulin and proinsulin to C-peptide ratios decreased markedly with semaglutide treatment in the baseline condition and during both hyperglycemic conditions (Table 2). Combining training with semaglutide did not alter any of these measures of insulin processing, while training alone improved the proinsulin to insulin ratio during both hyperglycemic stimulations from 50 to 41 and 50 to 38 (proinsulin/insulin) × 103 during steps 1 and 2, respectively, corresponding to geometric mean ratio changes of 0.82 (95% CI 0.69-0.98) and 0.76 (95% CI 0.60-0.96) (Table 2). This was also reflected in a decrease in the proinsulin to C-peptide ratio at step 2 with training alone (ratio change 0.81, 95% CI 0.68-0.97).
Whole-body glucose disposal increased with semaglutide treatment and with training alone. The improvement with training was greater in the combination group, during the first hyperglycemic step (estimated treatment difference, 2.9, 95% CI 1.2-4.7 mg/min/kg) but was similar during the second step (Table 3).
Hyperglycemic clamp, glucose disposal
| Variable | Semaglutide (n = 12, 20 weeks) | Semaglutide and training (n = 16, 12 weeks) | Training (n = 15, 12 weeks) | |||
|---|---|---|---|---|---|---|
| 20 mM | 30 mM | 20 mM | 30 mM | 20 mM | 30 mM | |
| Glucose infusion rate, mg/min/kg (corrected for urinary loss) | ||||||
| Before | 3.3 ± 1.1 | 6.4 ± 3.3 | 9.8 ± 5.2 | 18.6 ± 6.1 | 3.8 ± 1.4 | 8.0 ± 3.1 |
| After | 8.8 ± 4.7 | 17.9 ± 5.6 | 13.4 ± 5.9 | 23.7 ± 4.9 | 5.5 ± 2.3 | 13.5 ± 6.9 |
| Change from before | 5.5 (2.9 to 8.3) | 11.5 (8.0 to 15.0) | 4.6 (3.2 to 6.1) | 5.1 (1.8 to 8.4) | 1.7 (0.3 to 3.1) | 5.5 (2.4 to 8.5) |
| ETD vs training | — | — | 2.9 (1.2 to 4.7) | −0.3 (−4.0 to 3.4) | — | — |
| Urinary glucose excretion, mg/min/kg | ||||||
| Before | 1.14 ± 0.40 | 2.99 ± 0.56 | 1.40 ± 0.42 | 4.15 ± 0.64 | 1.14 ± 0.52 | 3.08 ± 0.99 |
| After | 1.24 ± 0.37 | 3.99 ± 0.93 | 1.51 ± 0.52 | 4.31 ± 0.92 | 1.4 ± 0.57 | 3.45 ± 1.05 |
| Change from before | 0.10 (−0.34 to 0.55) | 1.00 (0.62 to 1.38) | 0.11 (−0.11 to 0.33) | 0.16 (−0.53 to 0.86) | 0.15 (−0.08 to 0.39) | 0.37 (−0.30 to 1.04) |
| ETD vs training | — | — | −0.04 (−0.33 to 0.24) | −0.21 (−1.04 to 0.62) | — | — |
Effects of semaglutide, training, and the combination of the 2 on glucose disposal from the 2-stepped hyperglycemic clamp. Results from before and after each intervention (“Semaglutide”, “Semaglutide and training” and “Training”) are presented as means ± standard deviation (SD). Change from before is presented as means with 95% CI and represents the within group change calculated by repeated measures 2-way ANOVA. ETD denotes the estimated treatment difference between the Semaglutide and training group compared with the Training group, calculated using a 2-sided unpaired t-test and reported as the response to training alone subtracted from the response to training in combination with semaglutide with 95% CI. Change with semaglutide alone, was calculated using a 2-sided paired Students t-test.
Abbreviations: ETD, estimated treatment difference.
Oral Glucose Tolerance Test
Glucose tolerance, estimated as the AUC, improved in all groups (Table 4). When corrected for fasting plasma glucose (ie, as incremental area) no effect of training was seen, while the reduction remained apparent with semaglutide treatment (Table 4).
Oral glucose tolerance test
| Variable | Semaglutide (n = 12, 20 weeks) | Semaglutide and training (n = 16, 12 weeks) | Training (n = 15, 12 weeks) |
|---|---|---|---|
| Glucose AUC 0-180 minutes | |||
| Before, mmol/L × 180 minutes | 2968 ± 410 | 2055 ± 391 | 2682 ± 424 |
| After, mmol/L × 180 minutes | 2089 ± 421 | 1853 ± 375 | 2495 ± 406 |
| Change from before, mmol/L × 180 minutes | −878 (−1172 to −585) | −202 (−344 to −60) | −188 (−339 to −36) |
| ETD vs training, mmol/L × 180 minutes | — | −15 (−165 to 194) | |
| Glucose iAUC 0-180 minutes | |||
| Before, mmol/L × 180 | 1039 ± 188 | 657 ± 255 | 998 ± 252 |
| After, mmol/L × 180 | 653 ± 273 | 545 ± 268 | 927 ± 307 |
| Change from before, mmol/L × 180 | −386 (−602 to −169) | −112 (−259 to 35) | −70 (−223 to 82) |
| ETD vs training, mmol/L × 180 | — | −41 (−225 to 142) | — |
| Insulin iAUC 0-180 minutes | |||
| Before, nmol/L × 180 minutes | 36 (24 to 54) | 81 (58 to 115) | 29 (20 to 42) |
| After, nmol/L × 180 minutes | 70 (48 to 103) | 89 (71 to 112) | 34 (24 to 46) |
| Change from before (ratio) | 1.94 (1.50 to 2.53) | 1.09 (0.88 to 1.36) | 1.15 (0.91 to 1.44) |
| ETD vs training, nmol/L × 180 minutes | — | 10 (−13 to 17) | — |
| Insulin iAUC/glucose iAUC 0-180 minutes | |||
| Before, nmol/mmol | 34 (23 to 49) | 134 (87 to 206) | 30 (20 to 46) |
| After, nmol/mmol | 114 (65 to 202) | 185 (128 to 266) | 38 (27 to 55) |
| Change from before (ratio) | 3.37 (2.31 to 4.90) | 1.38 (1.03 to 1.84) | 1.26 (0.93 to 1.70) |
| ETD vs training, nmol/mmol | — | 43 (6 to 83) | — |
| Total GLP-1 AUC 0-180 minutes | |||
| Before, pM × 180 minutes | 2047 ± 713 | 8144 ± 2728 | 2172 ± 489 |
| After, pM × 180 minutes | 7662 ± 2690 | 7753 ± 2617 | 2133 ± 434 |
| Change from before, pM × 180 minutes | 5615 (3917 to 7317) | −391 (−1359 to 577) | 39 (−1046 to 969) |
| ETD vs training, pM × 180 minutes | − | −395 (−1609 to 818) | |
| Total GIP AUC 0-180 minutes | |||
| Before, pM × 180 minutes | 4638 ± 1124 | 4759 ± 929 | 4282 ± 876 |
| After, pM × 180 minutes | 4646 ± 967 | 4649 ± 829 | 4275 ± 782 |
| Change from before, pM × 180 minutes | 8 (−745 to 760) | −110 (−776 to 557) | −7 (−697 to 683) |
| ETD vs training, pM × 180 minutes | — | −102 (−933 to 728) |
Effects of semaglutide, training, and the combination of the 2 on plasma markers of β-cell function and glucose tolerance, derived an oral glucose tolerance test. Results from before and after each intervention (“Semaglutide”, “Semaglutide and training” and “Training”) are presented as either means ± standard deviation (SD) or geometric means with 95% confidence intervals (95% CI). Change from before is presented as means with 95% CI or ratios of geometric means with 95% CI and represents the within group change calculated by repeated measures 2-way ANOVA. ETD denotes the estimated treatment difference between the Semaglutide and training group compared with the Training group, calculated using a 2-sided unpaired t-test or the Mann–Whitney U-test and reported as the response to training alone subtracted from the response to training in combination with semaglutide with 95% CI. Abbreviations: ETD, ETD, estimated treatment difference; GLP-1, glucagon-like peptide-1; iAUC, incremental area under the curve.
We assessed β-cell glucose sensitivity by the ratio of incremental insulin area to incremental glucose area and found that it improved with semaglutide treatment by a ratio of 3.37 (95% CI 2.31-4.90) and with the combination of semaglutide and training by a ratio of 1.38 (95% CI 1.03-1.84), but did not change significantly with training alone (ratio 1.26, 95% CI 0.93-1.70). The absolute improvement was greater with combined semaglutide treatment and training than with training alone, with an estimated median increase in incremental insulin per incremental glucose of 49 pM insulin/mM glucose in the combined group vs 5 following training alone (mean difference 43, 95% CI 6-83 pM insulin/mM glucose, P < .05 Mann–Whitney U test) (Table 4).
Total GIP and total GLP-1 secretion during the oral glucose tolerance test were not affected by exercise training in any of the 2 groups. However, an increase in the AUC of total GLP-1 from 2047 at baseline to 7662 pM × 180 minutes after 20 weeks of semaglutide was seen, and GLP-1 concentrations remained elevated in the combination group before and after training (Table 4; Fig. S2 (24)).
Liver-Specific Markers and Lipid Profile
High-sensitivity C-reactive protein concentrations were not influenced by either semaglutide treatment or training alone, but the concentrations were lowered by −0.48 mg/L (95% CI −0.78 to −0.05) with the combination of the 2 (Table 5). ALAT was reduced with all interventions (training alone, semaglutide alone) and was further reduced with the combination of the 2. Twenty weeks of semaglutide was also associated with a reduction in aspartate aminotransferase, low-density lipoprotein, triglycerides, and total cholesterol. High-density lipoprotein cholesterol increased and alkaline phosphatase decreased only with the combination of semaglutide and training (Table 5).
Liver-specific markers and lipid profile
| Variable | Group | Intervention | |||
|---|---|---|---|---|---|
| Training (n = 15) | Semaglutide and training (n = 16) | Semaglutide (n = 12) | Semaglutide and training (n = 16) | Training (n = 15) | |
| Geometric mean (95% CI) | Geometric mean (95% CI) | Change (95% CI) | Change (95% CI) | Change (95% CI) | |
| High-sensitivity C-reactive protein, mg/L | 1.45 (1.0 to 2.1) | 1.75 (0.94 to 3.3) | −0.35 (−0.91 to 0.61) | −0.48 (−0.78 to −0.05) | −0.35 (−0.67 to 0.13) |
| Free fatty acids, µmol/L | 518 (619 to 434) | 631 (564 to 706) | −38 (−164 to 120) | −87 (−168 to 6) | −36 (−119 to 62) |
| Triglycerides, mmol/L | 1.64 (1.35 to 1.99) | 1.82 (1.35 to 2.47) | −0.71 (−0.95 to −0.42) | −0.08 (−0.26 to 0.12) | −0.08 (−0.33 to 0.23) |
| Total cholesterol, mmol/L | 4.13 (3.54 to 4.82) | 4.06 (3.38 to 4.87) | −0.53 (−0.81 to −0.24) | 0.03 (−0.14 to 0.24) | −0.12 (−0.33 to 0.12) |
| Low-density lipoprotein, mmol/L | 2.59 (2.09 to 3.21) | 2.49 (1.9 to 3.23) | −0.35 (−0.62 to −0.05) | −0.02 (−0.18 to 0.17) | −0.1 (−0.33 to 0.12) |
| High-density lipoprotein, mmol/L | 1.03 (0.93 to 1.15) | 0.98 (0.87 to 1.10) | 0.02 (−0.06 to 0.12) | 0.06 (0.01 to 0.12) | 0.02 (−0.03 to 0.08) |
| Glycerol, µmol/L | 43 (34 to 53) | 48 (42 to 55) | −3.8 (−14.9 to 11.1) | −6 .1(−13.8 to 3.0) | −5.1 (−12.9 to 5.1) |
| Alanine aminotranseferase, U/L | 34.4 (28.2 to 42.0) | 38.7 (29.8 to 50.4) | −8.5(−13.6 to −2.7) | −6.7(−9.8 to −2.5) | −4.8 (−9.0 to −0.1) |
| Aspartate aminotransferase, U/L | 23.2(20.1 to 26.8) | 29.2 (23.1 to 36.9) | −4.4 (−7.3 to −0.9) | −2.8 (−5.3 to 0.5) | −1.6 (−4.2 to 1.4) |
| Alkaline phosphatase, U/L | 60.8 (50.5 to 73.2) | 70.2 (57.7 to 85.4) | 0 (−6.3 to 7.0) | −4.2 (−7.7 to −0.7) | −1.8 (−4.9 to 1.8) |
| Bilirubin, µmol/L | 6.46 (4.71 to 8.85) | 6.29 (4.99 to 6.29) | 0.8 (−0.6 to 2.6) | −0.6 (−1.8 to 0.8) | −0.78 (−1.73 to 0.39) |
Changes in liver-specific plasma markers and lipid profile with semaglutide, training, and the combination. Baseline data are geometric means and changes are converted ratios of geometric means with 95% CI. Within-group changes with semaglutide alone (20 weeks) were assessed in a subgroup (n = 12), using a paired Student’s t-test, while within-group changes with Semaglutide and training and with training were evaluated by repeated measures Two-way ANOVA. No difference between combined semaglutide and training and training alone were detected when tested by unpaired analysis of the delta values from before and after the intervention (values not shown).
Training decreased resting IL-6 in the combination group and tended to decrease in the training group, but was unaffected by semaglutide treatment. IL-2, IL-10, tumor necrosis factor-α, and IL-12p70 were not significantly altered in any group. Interestingly, IL-17A was increased with training alone, but not affected by semaglutide or the combination.
Acute Exercise Test
Acute exercise suppressed insulin release and increased plasma concentrations of lactate, epinephrine (adrenaline), and IL-6 independent of semaglutide treatment and this was unaltered with 12 weeks of training (Fig. 4). Norepinephrine (noradrenaline) concentrations increased with exercise in both groups, but the concentrations were lower in combination with semaglutide (998 ± 295 and 1233 ± 231 pg/mL, weeks 1 and 12, respectively) than with training alone (1733 ± 444 and 2293 ± 1122 pg/mL, weeks 1 and 12, respectively) and the response to acute exercise was further elevated with 12 weeks of training, but only in the group without semaglutide (Fig. 4).
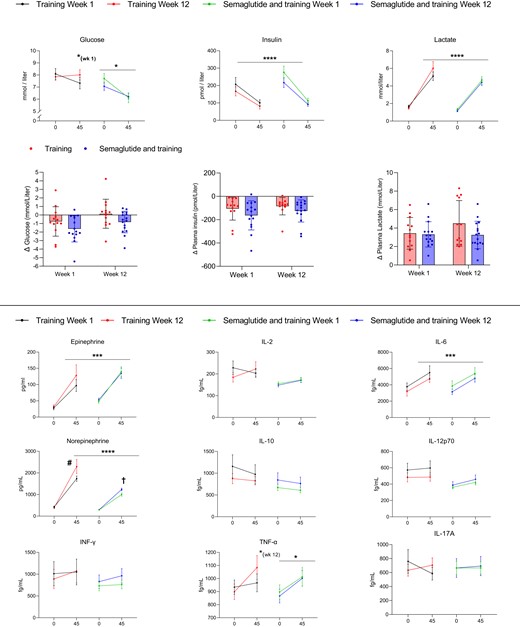
Response to an acute 45 minute bout of exercise in the first week and in the last week of the training intervention. The intensity was adjusted to 70% of V̇O2max. Black lines are the first week of training alone, and red bars are the 12th week. Green lines are the first week of combined training and semaglutide, and blue lines are the 12th week of combined training and semaglutide. Asterisks indicate a change with acute exercise within the group and time point. *P < .05, ***P < .001, and ****P < .0001. #Difference in response to acute exercise from week 1 to 12 within the group (P < .05). †Difference in response to acute exercise between the groups in weeks 1 and 12 (P < .001). Changes were evaluated by mixed-effects analysis and the Šidák method was used to adjust for multiple comparisons. Mean values are presented with standard errors (I-bars) or individual values with bars for comparison between the groups.
Discussion
We evaluated the effects of 12 weeks of aerobic training concurrent to steady-state semaglutide treatment and compared head to head with the effects of aerobic training alone on glucose-stimulated insulin secretion, β-cell glucose sensitivity, and glucose tolerance, exploring changes in resting plasma markers of metabolic health and inflammation in individuals with obesity and type 2 diabetes. We described the effects of 20 weeks of semaglutide treatment and evaluated these parameters before commencing the training intervention.
Primary Outcome: β-Cell Secretory Function
Semaglutide increased insulin secretion by ratios of ∼7 and 13 from baseline, with the 2 hyperglycemic steps, confirming its highly effective glucose-dependent potentiation of insulin secretion, as reported in previous studies (22, 23). Furthermore, insulin secretion improved with training regardless of concurrent semaglutide treatment; however, the absolute increase in total insulin secretion was approximately 7 times greater with the combination of semaglutide and training than with training alone. This main finding suggests that training and semaglutide synergistically improved insulin secretory capacity in this cohort of patients, implying that training potentiates the effect of semaglutide or vice versa, and that changes in insulin secretory capacity from training and semaglutide originate from different mechanisms.
Altered β-cell glucose sensitivity may partially explain the possible synergistic effect that training and semaglutide exhibited on insulin secretory capacity, as we noted an increased β-cell glucose sensitivity derived from the oral glucose tolerance test in this group. We observed an increase with semaglutide by a ratio of ∼3 from baseline. However, more notable β-cell glucose sensitivity was further enhanced after training in the combination group by approximately ∼6 times more than the moderate and insignificant increase (P = .15) in β-cell glucose sensitivity found with training alone. The improved β-cell glucose sensitivity with training in the combination group was not due to changed plasma concentrations of total GLP-1 or total GIP, as we saw no changes in incretin hormone secretion after training in any of the groups. However, it has previously been reported that improved oral glucose–stimulated insulin secretion, brought about by 3 months of training and a weight loss of 5 kg, was associated with an increased total GIP response (21). The higher plasma GLP-1 concentrations after semaglutide and semaglutide and training are most likely explained by analytical cross-reactivity with the semaglutide molecule in the assay.
With training, the proinsulin to insulin and C-peptide ratios were reduced during the hyperglycemic clamp, which indicated improved proinsulin processing efficiency. A reduction in the fasting proinsulin to insulin ratio has been described earlier with 6 weeks of high-intensity training (9). With semaglutide alone, the reduction in the ratios before hyperglycemic stimulation was similar to reductions reported in the SUSTAIN-1 trial (25). To our knowledge, the reductions found with hyperglycemic stimulation have not been described before. Interestingly, no further reduction was seen with the combination of semaglutide and training with either fasting or hyperglycemic stimulation.
Physical Fitness and Workloads
Notably, the training consistently significantly increased V̇O2max. In the semaglutide-only group, we observed a nonsignificant decline in absolute V̇O2max, along with a nonsignificant increase in relative V̇O2max (Table 1). The combined semaglutide and training group had a reduced average and a reduced increase in the progression of workloads through all sessions compared with the training-only group. We have no explanation for this, but we cannot rule out that a reduced caloric intake and/or gastrointestinal side effect in the combined group impaired the ability to exercise.
Glucose Disposal
Following all interventions, we found improvements in glucose disposal rates at both hyperglycemic steps. The marked increase seen with semaglutide was caused by the vastly elevated insulin concentrations. The improvement in glucose disposal rate at the 20 mM hyperglycemic step seen with the combination of training and semaglutide was greater than with training alone. This could be attributed to the much higher levels of insulin in the combination group and a training-induced improvement of skeletal muscle insulin sensitivity (6). However, the absolute improvements in glucose disposal rates at the 30 mM hyperglycemic step were not different between the combined semaglutide and training group and the training group despite a ∼7-fold greater increase in mean insulin concentrations in the former compared with the latter group. Thus, additional increases in insulin concentrations did not further enhance glucose disposal rates in the combination group because the insulin concentration was most likely already exerting maximum stimulation with semaglutide alone. The improvement seen with training alone at the 30 mM hyperglycemic step could be attributed to the higher concentrations of insulin and improved insulin sensitivity, and perhaps to an enhanced glucose-mediated glucose uptake.
Mechanisms for the Effects on β-Cell Secretory Function
A modest number of studies have investigated the effects of physical training on β-cell function in humans. In patients with type 2 diabetes, most studies find an improvement in β-cell function, using variables derived from an oral glucose tolerance test (9, 21, 26-28), mixed meal tolerance test (29), and the hyperglycemic clamp (10, 28, 29). A few studies reported improvements in the disposition index, a measure of β-cell function (the product of insulin secretion and insulin sensitivity) but found no change in insulin secretion (28, 30). In a secondary analysis of the U-turn study by Johansen et al (30), the authors found no correlation between insulin secretion and volume of training. However, 19% of the patients received liraglutide at the study start; and in the primary analysis (31), it was reported that 73.5% of the patients had reduced glucose-lowering medication at follow-up, potentially discommoding the analysis of the training effects on insulin secretion per se. In the studies by Heiskanen et al (26) and Arciero et al (32), it should be noted that the groups were mixed obese participants with or without type 2 diabetes.
The distinction between obesity with or without type 2 diabetes is important because insulin secretory capacity decreases with training in healthy (33) and obese (21, 34) individuals, as opposed to the increase in individuals with type 2 diabetes (10, 20, 21). This effect is seen in particular in those with partially sustained insulin secretory capability (10, 21), as we confirm in the present study.
The improvement of β-cell function induced by training in patients with type 2 diabetes is likely the result of ameliorated gluco-lipotoxic stress and low-grade inflammatory status, brought about by an augmented peripheral and central insulin sensitivity, and reduced ectopic triglyceride storages in the liver (35) and the pancreas (26). In support of this, training reduced fat mass and ALAT, while training in the combination group reduced visceral fat content, fasting concentrations of high-sensitivity C-reactive protein, and IL-6, and improved concentrations of high-density lipoprotein and markers of hepatic health. The mechanism may also include oscillations in energy stores, similar to improvements brought about by a caloric deficit (36). Combining training and weight loss do not potentiate glucose-stimulated insulin secretion (29), implicating that the synergistic effect of semaglutide and training seen in our study was unlikely to be attributable to the ∼2 kg weight loss seen with training in this group. In fact, none of the 3 groups shows a significant correlation between ΔiAUC for insulin and Δbody weight (data not shown). Consequently, energy restriction and training may act through similar mechanisms and display a ceiling effect on improving β-cell secretory function in patients with type 2 diabetes.
An appealing explanation for the marked increment of glucose-stimulated insulin secretion in the combination group could be an improvement in β-cell GLP-1 sensitivity, recently described with moderate training and caloric restriction, compared with caloric restriction alone (29), with endurance training in overweight women (37), and on the day after a single bout of exercise (38) in patients with type 2 diabetes.
The suppression of insulin secretion during exercise is predominantly due to the exercise-induced release of catecholamines. Insulin suppression was similar in the 2 groups during the exercise test, thus unaltered by semaglutide treatment. Intriguingly, the release of norepinephrine was lower with combined semaglutide and training before and after the training intervention, and only the training group increased the norepinephrine response from week 1 to 12 (Fig. 4). A lower increment in norepinephrine throughout all exercise sessions of the intervention means that there would be an overall reduced accumulation of inhibitory signaling to β-cells. It has been proposed that frequent exposure to norepinephrine introduce a memory in the β-cells that reduces the insulin secretory capacity (39); the lower norepinephrine concentrations seen with combined exercise and semaglutide may, therefore, partly explain the enhanced insulin secretory capacity in this group.
It is interesting that the exercise-induced increase in norepinephrine concentrations was reduced in the combined semaglutide and training group compared with the training-only group, because the 2 groups performed the exercise test at a similar absolute workload and intensity. To our knowledge, this is the first study to report that semaglutide treatment may diminish the exercise-induced norepinephrine release. In support of this observation of a diminished sympaticus activity by an GLP-1 receptor agonist, it has previously been shown that, during hypoglycemia, the counterregulatory release of norepinephrine and cortisol is diminished in semaglutide-treated patients with type 2 diabetes (40).
Training and semaglutide treatment additively improved glycated hemoglobin levels, which is in accordance with a previous study (18). In the present study, however, we separated the immediate glucose-lowering effects of semaglutide from that of training by allowing 20 weeks of semaglutide treatment before the start of the training intervention, as the lowest level of glycated hemoglobin is usually reached within 16 weeks of semaglutide treatment (25). The latter indicates that improvement in β-cell function with semaglutide does not progress beyond this time frame. A previous study demonstrated that discontinuing liraglutide fully abolishes the effects on glucose-stimulated β-cell secretory function (41), implying that high concentrations of GLP-1 receptor agonists in plasma do not improve the underlying β-cell health, per se.
Conclusion and Perspectives
Because physical activity, weight loss, and glucose-lowering medication are used in combination in the management of type 2 diabetes, interactions of these treatment modalities must be elucidated. In the present study, we find that semaglutide treatment and physical training positively and synergistically improve β-cell secretory function in patients with sustained β-cell function. This finding underscores the importance of early initiation of physical exercise after diagnosing type 2 diabetes and supports using semaglutide as a cotherapy to lifestyle intervention.
Limitations
We did not prescribe placebo treatment to the training group or assign an additional group to account for this. Although unlikely, we cannot completely rule out that part of the additional effect of combined semaglutide and training that we report on β-cell secretory function is caused by a placebo effect.
The influence of the order of the interventions was not explored in this study, as the training-only group was not assigned to a 20-week follow-up semaglutide treatment.
We escalated and treated the combination group with semaglutide for 20 weeks prior to the training intervention. By doing so, we separated the immediate and medium-term effects of the drug, such as the effects on insulin secretion, blood glucose, glycated hemoglobin, and initial weight loss, from the effects of training. Thus, there is a small risk that the estimated treatment difference (the relationship between the delta values of the combination strategy vs training alone) for parameters that naturally exhibit a ceiling effect, such as fasting glucose and glycated hemoglobin, is underestimated with the combination strategy. Also, the unavoidable better glycemic control in the semaglutide-only group may have been an advantage (less glucotoxicity) when the physical training was added compared with the training-only group.
Acknowledgments
The authors would like to thank all the participants for their efforts in this trial. We thank Jeppe Bach, Thomas Bech, Dorthe Riis, Zuzanna Jachowics, and Regitze Kraunsøe for their expert technical assistance. Morten Pilegaard is thanked for professional, scientific editing. Nida Gauri, Christina Gallø, and Peter Sørensen are thanked for assisting with supervising exercise sessions.
Funding
The study was supported by the Novo Nordisk Foundation, Copenhagen Health Sciences Partners, and Fonden til Lægevidenskabens Fremme.
Author Contributions
Conceptualization: F.D., and A.I. Methodology: F.D., J.W.H., J.J.H., and A.I. Investigation: A.I., M.S., C.A., B.G., T.T., J.B., J.W.H., and F.D. Writing, Original Draft: A.I. and F.D. Writing, Review, and Editing A.I., M.S., C.A., B.G., T.T., J.B., J.J.H, J.W.H., and F.D; Funding Acquisition: F.D. and A.I. Resources:, F.D. and J.W.H. Supervision: F.D. and A.I. F.D. takes full responsibility for the work as a whole, including the study design, access to data, and the decision to submit and publish the manuscript.
Disclosures
J.J.H. is a member of advisory boards for Novo Nordisk and has given paid lectures for Novo Nordisk. No other potential conflicts of interest are relevant to this article.
Data Availability
Some or all datasets generated during and/or analyzed during the current study are not publicly available but are available from the corresponding author on reasonable request.
Clinical Trial Information
The study is registered at clinicaltrials.gov, ID NCT04383197 (registered May 4, 2020).
References
Abbreviations
- AUC
area under the curve
- GLP-1
glucagon-like peptide-1
- GIP
glucose-dependent insulinotropic polypeptide
- IL
interleukin
- V̇O2max
maximal oxygen uptake
