


Abstract
Cross-sectional studies have identified an increased risk of metabolic syndrome (MetSyn) in women with polycystic ovary syndrome (PCOS), but longitudinal data are limited and primarily include White and European cohorts.
To compare the longitudinal risk of MetSyn in Black and White women with PCOS and to identify potential factors mediating the risk of MetSyn.
Longitudinal cohort study with a follow-up of 5.3 years at an academic medical center
247 adult women with hyperandrogenic PCOS phenotype with 2 or more visits at least 3 years apart. The main outcome measure was incidence of MetSyn in Black and White women with PCOS.
Using a mixed-effects model over time, the incidence of MetSyn was higher in Black women (45.9 ± 4.74 per 100 person-years) than in White women (31.3 ± 3.03 per 100 person-years) (P < .01) after adjusting for age and medication status. This difference persisted among women under age 30. Among Black women who did not have MetSyn at their prior visit, 28.0% had MetSyn at the next visit, compared with 12.1% of White women after adjusting for age and medication status (P < .01). In both races, the model-based estimated rates of MetSyn increased significantly with increase in body mass index and free testosterone.
We describe a persistent higher incidence of MetSyn in Black than in White women with PCOS. In addition to early cardiometabolic screening at the time of diagnosis, our findings highlight the need for ongoing and frequent screening in this population.
Polycystic ovary syndrome (PCOS) is a common endocrine disorder characterized by oligo-ovulation, hyperandrogenism, and polycystic ovaries on ultrasound (1). PCOS is associated with many metabolic comorbidities such as an increased risk of insulin resistance, obesity, dyslipidemia, hypertension, and type 2 diabetes (T2DM) (2). Metabolic syndrome (MetSyn) is a constellation of such cardiometabolic risk factors affecting 23% to 34% of adults in the United States, with a rising prevalence over the last 3 decades and a disproportionate increase among younger age groups and women (3, 4). MetSyn is an important prognostic marker of cardiovascular health correlating with risk of T2DM, coronary artery disease, stroke, and all-cause mortality (3, 5, 6). In addition, MetSyn is more predictive of cardiovascular mortality than isolated components such as insulin resistance or hyperlipidemia (7). Furthermore, the financial impact of MetSyn is high, as it increases an individual’s annual healthcare utilization costs by at least 1.6-fold (8).
Data on increased prevalence of MetSyn in women with PCOS are primarily based on cross-sectional studies. A retrospective cohort study of 129 women with PCOS and 177 healthy controls demonstrated an 11-fold increased risk of MetSyn in women with PCOS (47.3% vs 4.3% in controls, P < .01), and this increased risk was observed across the reproductive age spectrum (9). Several studies across the globe have supported these findings, with a recent meta-analysis including 7807 women with PCOS and 7232 controls reporting an odds ratio (OR) of 3.35 (95% CI 2.44-4.59) for MetSyn (10). Some studies have shown an impact of race on the prevalence of MetSyn such that Black women in the United States with PCOS have an increased risk of MetSyn compared with White counterparts (11, 12). In addition, hyperandrogenism has been implicated as a risk factor, and in a meta-analysis specifically assessing the impact of PCOS phenotype, women with the hyperandrogenic (HA) phenotype (n = 4185) were at higher risk of MetSyn when compared with non-HA women (n = 1783) with an OR of 2.21 (95% CI 1.88-2.59) (13).
While longitudinal studies have examined the persistence of T2DM, obesity, hypertension, and other metabolic abnormalities in women with PCOS, very few studies have examined the longitudinal risk of MetSyn in this population (14, 15). One study of 118 women with PCOS found that over 20 years, the prevalence of MetSyn did not change (7% at baseline, 6% at 20 years) (16). Another study suggested that the risk may in fact decrease over time, though these findings may have been confounded by treatment of metabolic abnormalities (17). However, a study that followed women with PCOS-like features over a mean of 11 years found that they developed MetSyn on average 3 years earlier than healthy controls (18). Overall, these studies are limited by their small sample sizes, self-reported PCOS diagnoses, unclear PCOS phenotypes, and lack of racial and ethnic diversity with primarily White and European cohorts.
When considering racial differences in the risk of MetSyn, a longitudinal study may provide a more dynamic understanding of health disparities. The Institute of Medicine defines health disparities as “differences in the quality of health care that are not due to access-related factors or clinical needs, preferences, and appropriateness of intervention.” (19) Racial and ethnic health disparities are pervasive but especially pronounced in cardiovascular health. Black patients are disproportionately affected by myocardial infarction, stroke, and heart failure (20). Black patients also have a higher prevalence of cardiovascular disease (CVD) risk factors such as MetSyn, and these are frequently underrecognized (21). Furthermore, prior studies have shown that when treating Black patients, clinicians focus less on prevention, identify disease later, recommend less rigorous therapy, and are less likely to adhere to clinical guidelines (22).
Given the conflicting data on the risk of MetSyn over time in women with PCOS and the notable racial health disparity related to CVD, the primary aim of our study was to compare the longitudinal risk of MetSyn in Black and White women with HA PCOS defined by the Rotterdam criteria in a large, well-defined cohort. We also sought to identify potential factors mediating the persistence of MetSyn and to compare the risk of hypertension and T2DM between groups.
Materials and Methods
We performed a longitudinal retrospective cohort study of women seen at the Penn PCOS Center between 2008 and 2019. The Institutional Review Board of the University of Pennsylvania approved the study.
Adult women with 2 or more visits at least 3 years apart were eligible for inclusion. Chart review was performed to ensure that each patient met the Rotterdam criteria for diagnosis of PCOS (2 of 3 features: oligo-ovulation, clinical or biochemical hyperandrogenism, and polycystic ovaries on ultrasound) and that other mimicking conditions were excluded (1). Data on demographic variables and medical history were collected at baseline and all laboratory values and medications commonly prescribed in women with PCOS (combined oral contraceptives [COCs], metformin, and spironolactone) were collected both at baseline and all follow-up visits. Medication status was determined by whether any of the pertinent medications were prescribed during the study period. Women without evaluation of all components of MetSyn were excluded. As the HA phenotype is associated with MetSyn and this phenotype typically had complete metabolic screening in our population (96.1%), only these participants were included in the analysis (13). Black or White race was self-reported by patients and documented in the electronic medical records. Main reasons for exclusion included not having 2 visits 3 years apart or not having complete metabolic testing.
MetSyn was defined as having at least 3 of the 5 criteria listed in Table 1. Body mass index (BMI) ≥30 kg/m2 was used as a surrogate for increased waist circumference as BMI was available for all participants. Prior studies have found a high correlation between waist circumference and BMI, and both are similarly associated with diabetes (23, 24). Furthermore, the International Diabetes Foundation states that if BMI is over 30 kg/m2, central obesity can be assumed and it is not necessary to measure waist circumference (25). In addition, BMI over 30 kg/m2 was 1 of the criteria for MetSyn in the WHO criteria (26).
Adult Treatment Panel III diagnostic criteria for metabolic syndrome in women
| Criterion | Description |
|---|---|
| Elevated waist circumferencea | ≥35 in (88 cm) |
| Elevated triglyceride level | ≥150 mg/dL or use of drug therapy for elevated triglyceride levels |
| Reduced high-density lipoprotein (HDL) cholesterol level | <50 mg/dL or use of drug therapy for reduced HDL cholesterol level |
| Elevated blood pressure | ≥130 mm Hg systolic or ≥85 mmHg diastolic or use of drug therapy for hypertension |
| Elevated fasting glucose level | ≥100 mg/dL or use of drug therapy for elevated glucose concentration |
aBody mass index of ≥30 kg/m2 was used as a surrogate for elevated waist circumference as a criterion for metabolic syndrome.
Presence or absence of MetSyn was determined at each visit. Data were also collected on the prevalence of T2DM (defined as fasting glucose ≥126, hemoglobin A1c ≥6.5, or history of T2DM) and hypertension (defined as systolic blood pressure ≥130 or diastolic blood pressure ≥80, or history of hypertension) (27).
Statistical analysis was performed using SAS (13). Two-tailed t-tests or rank sum tests were used for continuous variables and chi-squared tests for categorical variables. Mixed-effects models were used for longitudinal data to accommodate repeated measures per person and the varying amount of data and spacing between assessments per person. Estimated proportions were used to calculate the primary outcome—incidence of MetSyn in Black vs White women. Incidence was adjusted for age and medication status (documented prescription of COCs, metformin, or spironolactone at the index visit). BMI was not included in adjustments due to potential collinearity, but its association with MetSyn was separately investigated. The association between testosterone (free and total) and MetSyn was evaluated by comparing the incidence of MetSyn for women with testosterone level at the mean minus 1 SD, at the mean, and at the mean plus 1 SD for Black and White women separately. Prevalence of hypertension and T2DM were contrasted between Black and White women, adjusting for age, BMI, and medication status. Due to the low prevalence of T2DM in the study population, the mixed-effects model was unable to evaluate longitudinal risk. P values below .05 were considered statistically significant.
Results
There were 2314 unique patients seen at the Penn PCOS Center during the study period. Two hundred and fifty-seven adult women met the inclusion criteria: diagnosis of PCOS based on Rotterdam criteria, 2 or more visits at least 3 years apart, and complete evaluation of MetSyn. Of these women, 247 (96.1%) had a HA phenotype and were included in the analyses. The study population was followed for a mean of 5.7 ± 2.8 visits over 5.3 years with a mean interval of 1.3 ± 0.65 years between visits, with no difference between groups. The age range of the study group was 18-54 years (Fig. 1). The baseline clinical features and metabolic parameters in Black and White women with PCOS are shown in Table 2. There was no difference in distribution of the 3 HA phenotypes between groups (P = .30). At baseline, Black women with PCOS had higher BMI as well as higher serum testosterone, hemoglobin A1c, and insulin levels. Use of PCOS-related medication predating the initial visit was similar between groups—40.8% in Black women and 55.0% in White women (P = .10). On-average rate of medication use during the study period was 51.3% (39/76) for Black women and 70.2% (120/171) for White women (P < .01).
Clinical features and metabolic parameters at initial visit
| White (n = 171) | Black (n = 76) | P value | |
|---|---|---|---|
| Age (years) | 27.0 (6.6) | 27.2 (6.2) | .73 |
| PCOS phenotype | |||
| H + O phenotype (%) | 35 (33.7) | 11 (23.9) | .23 |
| H + P phenotype (%) | 8 (7.7) | 3 (6.5) | .80 |
| H + O + P phenotype (%) | 59 (56.7) | 32 (69.6) | .14 |
| Total testosterone (ng/dL) | 51.1 (26.8) | 71.3 (40.8) | <.01 |
| Free testosterone (pg/dL) | 5.6 (4.6) | 8.8 (6.8) | <.01 |
| Ferriman–Gallwey score | 10.3 (6.9) | 10.2 (7.5) | .81 |
| Antral follicle count | |||
| Right | 15.6 (6.4) | 16.5 (6.8) | .55 |
| Left | 15.1 (5.8) | 13.8 (6.0) | .24 |
| Use of PCOS-related medication | 94 (55.0) | 31 (40.8) | .10 |
| Oral contraceptive | 66 (38.6) | 21 (27.6) | .15 |
| Spironolactone | 13 (7.6) | 3 (3.9) | .41 |
| Metformin | 32 (18.7) | 13 (17.1) | .99 |
| Weight (kg) | 84.8 (25.1) | 105.3 (29.2) | <.01 |
| BMI (kg/m2) | 31.7 (8.9) | 38.3 (8.9) | <.01 |
| Systolic blood pressure (mmHg) | 123.4 (15.3) | 126.1 (14.8) | .21 |
| Diastolic blood pressure (mmHg) | 73.7 (8.7) | 77.0 (9.7) | .01 |
| Prevalence of hypertensiona | 66 (41.8) | 39 (54.9) | .06 |
| Fasting glucose (mg/dL) | 85.3 (16.6) | 89.0 (15.4) | .12 |
| Fasting insulin (mIU/L) | 13.6 (10.3) | 22.5 (15.9) | <.01 |
| Hemoglobin A1c (%) | 5.4 (0.7) | 5.8 (0.7) | <.01 |
| Prevalence of type 2 diabetesb | 9 (5.3) | 5 (6.6) | .68 |
| High-density lipoprotein cholesterol (mg/dL) | 55.1 (14.0) | 49.2 (11.0) | <.01 |
| Triglycerides (mg/dL) | 122.3 (76.1) | 83.8 (35.2) | <.01 |
Data are mean (SD) or number (%). P values in bold are statistically significant.
Abbreviations: H, hyperandrogenism; O, oligo-ovulation; P, polycystic ovarian morphology on ultrasound; BMI, body mass index; PCOS polycystic ovary syndrome.
aHypertension defined as blood pressure ≥130/80 or listed in medical history.
bType 2 diabetes defined as fasting glucose ≥126, hemoglobin A1c ≥6.5, or listed in medical history.
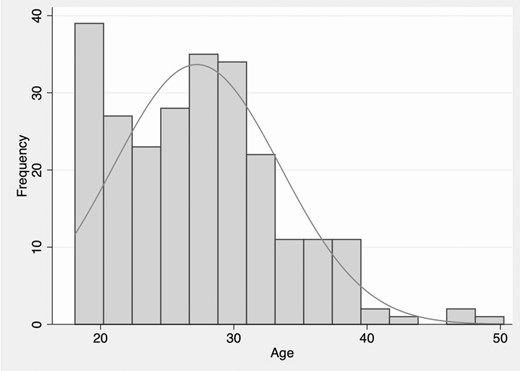
Distribution of age at initial visit.
Metabolic Syndrome
The unadjusted prevalence of MetSyn at the initial visit was 35.6% in the overall study population, with a higher prevalence among Black vs White women (44.7% vs 31.6%, P < .05) (Table 3). Compared with White women, Black women were more likely to meet the individual criteria for MetSyn except high triglyceride levels.
Fulfillment of metabolic syndrome criteria at initial visit
| Criteriona | Total (n = 247) | White women (n = 171) | Black women (n = 76) | P value |
|---|---|---|---|---|
| Elevated BMI ≥30 | 138 (59.2) | 81 (50.3) | 57 (79.2) | <.01 |
| Elevated triglyceride level | 45 (19.1) | 41 (25.3) | 4 (5.4) | <.01 |
| Reduced HDL cholesterol level | 104 (44.4) | 62 (38.8) | 42 (56.8) | <.01 |
| Elevated blood pressure | 85 (37.3) | 53 (33.8) | 32 (45.1) | .10 |
| Elevated fasting glucose level | 59 (26.9) | 27 (18.5) | 32 (43.8) | < .01 |
| Metabolic syndrome | 88 (35.6) | 54 (31.6) | 34 (44.7) | <.05 |
Data are number (%).
aUsing Adult Treatment Panel III guidelines.
Using the mixed-effects model over time, we calculated the incidence of MetSyn after adjusting for age and medication status. During the study period, incidence was significantly higher in Black women (45.9 per 100 person-years, SE 4.74) than in White women (31.3 per 100 person-years, SE 3.03) (P < .01). We also examined the prevalence of MetSyn during different time points in the study and found that the increased prevalence noted in Black women at the initial visit persisted up to 90 months after adjusting for age and medication status (44.0% in Black and 27.4% in White at 90 months, P = .01) (Fig. 2).
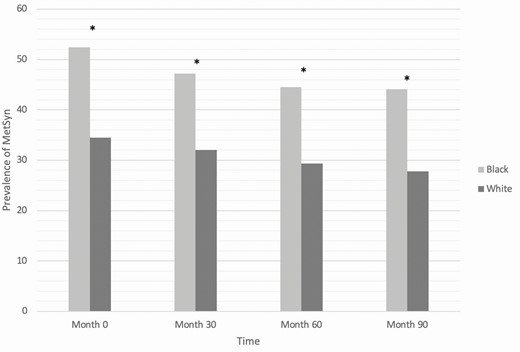
Longitudinal prevalence of metabolic syndrome in Black and White women adjusted for age and medication status (*P = .01).
We also calculated the rate of conversion to MetSyn during the study period. Among Black women who did not have MetSyn at their prior visit, 28.0% had MetSyn at the next visit, compared with 12.1% of White women having MetSyn at the subsequent visit if they did not have MetSyn at their prior visit after adjusting for age and medication status (P < .01). At the time that these women converted to MetSyn, the most common criteria fulfilled were elevated BMI (93.2%), followed by reduced high-density lipoprotein (HDL) (70.5%) and elevated blood pressure (63.6%) (Table 4). Black women were more likely to have reduced HDL and White women were more likely to have elevated triglycerides, with no difference between groups in the other criteria. Among women who had MetSyn at the prior visit, Black and White women had a similar prevalence of MetSyn at the next visit (70.7% vs 69.7%, P = .83).
Fulfillment of MetSyn criteria upon conversion to MetSyn
| Criteriona | Conversion to MetSyn (n = 44) | White women (n = 25) | Black women (n = 19) | P value |
|---|---|---|---|---|
| Elevated BMI ≥30 | 41 (93.2) | 22 (88.0) | 19 (100) | .25 |
| Elevated triglyceride level | 15 (34.1) | 12 (48.0) | 3 (15.8) | .03 |
| Reduced HDL cholesterol level | 31 (70.5) | 14 (56.0) | 17 (89.5) | .04 |
| Elevated blood pressure | 28 (63.6) | 16 (64.0) | 12 (63.2) | 1.00 |
| Elevated fasting glucose level | 16 (36.4) | 9 (36.0) | 7 (36.8) | 1.00 |
| Metabolic syndrome | 44 (100) | 25 (100) | 19 (100) | — |
aUsing Adult Treatment Panel III guidelines.
Data are number (%).
We performed a subanalysis of women under age 30, including 52 Black women (30.4% of all Black participants) and 24 White women (31.6% of all White participants). There remained a significant difference between groups in the adjusted incidence of MetSyn—51.1 per 100 person-years (SE 5.29) in Black women compared with 27.4 per 100 person-years (SE 3.57) in White women (P < .01). Similar to the overall study population, the women under 30 who did not have MetSyn at their prior visit were more likely to develop MetSyn by the following visit if they were Black (28.7% vs 11.6%, P < .01). Among the young women with MetSyn at the previous visit, there was a similar rate between races of persistent MetSyn at the subsequent visit (75.7% vs 66.2%, P = .47).
Role of BMI
As BMI was not included in adjustment calculations due to collinearity with MetSyn, separate analyses were performed to identify the specific relationship between BMI and MetSyn. Black women had a significantly higher BMI than White women, with an average difference during the study period of 5.7 ± 1.2 kg/m2. Using model-based estimated rates of MetSyn, the incidence of MetSyn adjusted for age and medication status increased significantly from low to high BMI in both races (Fig. 3). There was no significant differential impact of race on the association between BMI and MetSyn (P = .94).
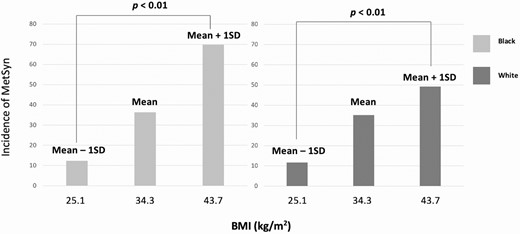
Association between BMI and incidence of MetSyn in Black and White women.
Association Between Testosterone and MetSyn
All participants included in the statistical analyses had the HA phenotype. Using the mixed-effects model, Black women had higher free testosterone than White women, with a mean difference of 3.0 ± 0.6 ng/dL, and higher total testosterone, with a mean difference of 17.8 ± 3.7 ng/dL. After adjusting for BMI, the mean difference in free testosterone was 2.3 ± 0.6 ng/dL (P < .001), and the mean difference in total testosterone was 16.3 ± 3.8 ng/dL (P < .001). We sought to identify if there is a dose–response relationship between serum androgen levels and incidence of MetSyn and found that model-based estimated rates of MetSyn adjusted for age and medication status increased with both testosterone and free testosterone levels but was statistically significant for free testosterone only (Fig. 4). There was no significant differential impact of race on the association between total testosterone (P = .78) or free testosterone (P = .97) with MetSyn.
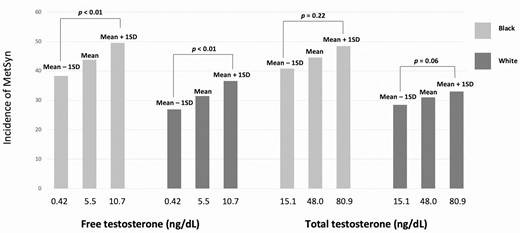
Association between total and free testosterone and incidence of MetSyn in Black and White women.
Hypertension
During the study period, the overall prevalence of hypertension was 43.5% in Black women and 40.9% in White women after adjusting for age, medication status, and BMI (P = .58). There was no statistically significant difference in prevalence of hypertension when including only women under 30 (51.3% vs 25.7%, P = .09). A similar trend was found when the analysis was limited to women 30 and older (39.0% vs 44.1%, P = .39). Among women without hypertension at the previous visit, there was no difference between races in development of hypertension at the subsequent visit (35.9% in Black vs 35.2% in White, P = .90) and similarly no difference in persistent hypertension if present at the previous visit (75.4% vs 67.5%, P = .61).
Type 2 Diabetes
The prevalence of T2DM during the study period was similar in Black (6.7%) and White women (3.9%) after adjusting for age, medication status, and BMI (P = .19). A similar pattern was noted among women under 30 (10.7% in Black women, 3.8% in White women, P = .23) and women over 30 (7.6% vs 4.7%, P = .27). Due to the low prevalence of T2DM, the mixed-effects model was unable to evaluate longitudinal risk.
Discussion
In this longitudinal cohort study of reproductive age Black and White women with PCOS, we found a high prevalence of MetSyn, hypertension, and T2DM in both groups. Throughout the study period, the incidence of MetSyn after adjusting for age and medication status was significantly higher in Black women than in White women. This difference was marked even in women under age 30. The incidence of MetSyn correlated significantly with BMI and free testosterone levels in both races. In addition to early cardiometabolic screening at the time of diagnosis, our findings highlight the need for ongoing and frequent screening in this high-risk population.
Prior cross-sectional studies have established an increased risk of MetSyn among Black women with PCOS. A retrospective cohort study reported a higher risk of MetSyn in the Black women (n = 106) compared with White women with PCOS (n = 413) (relative risk [RR] 1.44, 95% CI 1.21-2.6), with the effect being more pronounced in adolescents with PCOS (RR 2.65, 95% CI 1.29-5.4) (11). In that study, all components of MetSyn except for triglycerides were significantly abnormal in Black women; these findings were also noted in our study. An additional study of women with PCOS residing in 5 different countries reported that US Black women were at the highest risk of MetSyn after adjusting for age (OR 4.52, 95% CI 2.46-8.35) compared with women residing in Brazil, India, Norway, and Finland (12). Our findings significantly add to the literature as they are the first to examine racial differences in the incidence of MetSyn over time. The higher incidence and conversion rate to MetSyn in Black women irrespective of age identifies a potential opportunity for early and targeted intervention to slow the progression of long-term complications such as T2DM and CVD.
International guidelines published in 2018 recommend screening of all women with PCOS for CVD risk factors at the time of diagnosis (2). This includes testing for dyslipidemia and glucose tolerance at the time of diagnosis and assessing weight and blood pressure at each visit, at least every 6 to 12 months. In general, it is recommended that screening tests should only be performed if it leads to earlier recognition of modifiable cardiometabolic risk factors and if treatment leads to better health outcomes (28). Our study, by demonstrating a high and persistent risk of MetSyn over the reproductive years, provides support for frequent screening for cardiometabolic risk factors, at least in HA women with PCOS. In addition, this may be an opportunity to re-evaluate screening frequency and early interventions with a focus on decreasing health disparity.
Based on our findings, BMI is an important driver for the increased risk of MetSyn in both races. Currently, lifestyle modifications (LSMs) are recommended as first-line therapy for all women with PCOS to improve reproductive, metabolic, and psychological endpoints (2). Unfortunately, results of a National Health and Nutrition Examination Survey study indicate that the majority of healthcare providers do not counsel overweight and obese patients to control or lose weight, increase exercise, or reduce caloric intake (29). Similarly, in a survey of women with PCOS, 45% reported that their healthcare providers did not mention LSM and only 11% were satisfied with the weight management information they received (30). In order to address these challenges, a multidisciplinary model of care including healthcare providers and nutritionists has been suggested (2).
There are limited data on the impact of race on different weight loss strategies in PCOS. In the general population, modest weight loss of 2 to 3 kg has been shown to have beneficial effects on metabolic parameters such as impaired glucose tolerance (31). A recent Cochrane review assessed the effect of LSM, including structured physical activity intervention and combined dietary and exercise intervention in women with PCOS and found increased weight loss with LSM compared with minimal treatment (mean difference of 1.68 kg, 95% CI –2.66 to –0.70) (32). However, none of these studies compared differences in weight loss based on race. In a recent survey of women with PCOS, race, parity, and educational level were predictors of adequate physical activity based on the international physical activity questionnaire (33). In this study, fewer Black women than White women met the threshold for adequate physical activity . The impact of LSM was further demonstrated in the Diabetes Prevention Trial, which compared the effects of LSMs (combination of diet, exercise, and behavior modification) and metformin on development of diabetes in patients with impaired glucose tolerance in the general population (34). Over an average of 2.8 years, the incidence of diabetes was 39% lower (95% CI 24-51%) in the LSM group than in the metformin group. A secondary analysis of this study showed that Black women lost less weight over the study period than other racial groups, indicating the need to study sociocultural and environmental factors impacting weight management (35). While the optimal LSM recommendations for women with PCOS remain undetermined, a recent meta-analysis found that compared with a higher glycemic diet, a low–glycemic index diet decreases triglycerides (mean difference −14.85, 95% CI −28.75 to −0.95 mg/dL) and waist circumference (−2.81, CI −4.40 to −1.23 cm) independent of changes in weight (36). The observed racial disparities in cardiometabolic outcomes, engagement in physical activity, and responsiveness to weight loss interventions provide significant opportunities for future studies.
Our study also identified an association between serum androgen levels and MetSyn in both races. A meta-analysis reported that women with the HA phenotype of PCOS had an OR of 2.21 (95 % CI 1.88-2.59) for MetSyn when compared with women with a non-HA phenotype (13). A longitudinal cohort study examining this association reported no significant difference in incidence of MetSyn when comparing HA vs non-HA perimenopausal women in the general population (37). In our study, which includes only HA reproductive age women, we found a positive association between serum androgens and risk of MetSyn after adjusting for age and medication use. Both LSMs and COCs are first-line therapies for PCOS and may be beneficial for improving hyperandrogenism. In the Cochrane meta-analysis discussed above, there was a decrease in free androgen index (mean difference –1.11, 95% CI –1.96 to –0.26) and clinical hyperandrogenism as measured by the Ferriman–Gallwey score (mean difference –1.12, 95% CI –2.16 to –0.08) with LSM (including physical activity interventions as well as combined dietary and physical activity interventions) (32). In a meta-analysis including 26 studies, the impact of COC use for up to 24 months on cardiometabolic risk in women with PCOS showed a negative impact on lipid profile with minimal effects on other metabolic parameters (38).
The strengths of our study include its longitudinal design with a mean follow-up period of over 5 years, a confirmed diagnosis of PCOS by Rotterdam criteria in all participants, and assessment of metabolic risk factors in a young population. Most importantly, this is the first longitudinal study focused on studying the impact of race on MetSyn among women with PCOS. Our study has some limitations. We did not include races other than White and Black, as we were limited by small numbers in these groups. We did not have waist circumference measurements and used BMI as a well-established surrogate for this criterion (26). We were also unable to control for differences in social determinants of health between races in an attempt to explain our observations. For example, prior studies in the general population have shown that the risk of MetSyn and other CVD risk factors is disproportionately high in low- and middle-income people when stratified by race (38). Also, differences in body image perception, sociocultural influences, and neighborhood environments between races impact obesity and are potential drivers of cardiometabolic risk (39). Although our study was not designed to understand the observed differences in outcomes, it is critical that future studies include data on education, income, and adherence to medication to better understand these health disparities. Although we had data on medications prescribed during the time period of the study, we were unable to determine medication adherence.
In conclusion, we detected a high prevalence of MetSyn among both Black and White women with PCOS, with a higher incidence in Black women than in White women throughout the period of our study. Our findings of increased conversion to MetSyn during the reproductive years highlight the importance of frequent screening to facilitate early identification of cardiometabolic risk factors. Further research is needed to understand the specific drivers for the elevated risk of MetSyn observed among Black women with PCOS. Recognition of these factors will allow implementation of both preventive and therapeutic strategies specifically targeted toward reducing this racial disparity.
Abbreviations
- BMI
body mass index
- COC
combined oral contraceptive
- CVD
cardiovascular disease
- HA
hyperandrogenic
- HDL
high-density lipoprotein
- LSM
lifestyle modification
- MetSyn
metabolic syndrome
- PCOS
polycystic ovary syndrome
- T2DM
type 2 diabetes
Acknowledgments
Financial Support: No funding was utilized for this study.
Conflict of Interest: The authors report no conflict of interest.
Data Availability
Some or all datasets generated during and/or analyzed during the current study are not publicly available but are available from the corresponding author on reasonable request.
