


Abstract
Pituitary stalk thickening (PST) is often identified on magnetic resonance imaging (MRI), either incidentally or during diagnostic workup of hypopituitarism. However, the neoplastic etiology and natural course of PST are not fully understood, although this knowledge is required to establish diagnostic and surveillance strategies.
This work aimed to investigate the neoplastic etiology and natural course of PST.
MEDLINE/PubMed and EMBASE databases were searched up to February 2021 to identify original research investigating the etiologies of PST. The proportion of neoplastic etiology in patients with PST was meta-analytically pooled. Supplementary analysis exploring factors suggesting neoplasm was also performed. For initially indeterminate cases without confirmed diagnosis, the proportion of patients showing progression of PST during follow-up was evaluated.
Eighteen studies covering 1368 patients with PST were included. The pooled proportion of neoplasm was 45.2% (95% CI, 33.3%-57.8%), with substantial heterogeneity across studies (I2 = 93%). The most common neoplasm was germ cell tumor (14.0% of study population), followed by Langerhans cell histiocytosis (10.2%) and metastasis (4.7%). The studies on pediatric populations and those with more than 50% of patients having at least one pituitary hormone deficiency tended to show a higher proportion of neoplasm. The pituitary stalk was thicker in neoplasms, but the difference was not significant (pooled mean difference, 2.08 mm; P = .08). In initially indeterminate cases, 18.5% (95% CI, 7.6%-38.3%) showed progression of PST during follow-up.
PST was commonly confirmed to be neoplastic, especially in pediatric populations. As isolated PST frequently progresses, follow-up imaging is essential in initially indeterminate cases.
The pituitary stalk is a funnel-shaped structure connecting the hypothalamus with the pituitary gland and comprising the hypothalamic-pituitary axis. In the pediatric population, the mean diameter of the pituitary stalk measured on computed tomography increases with age, from 1.9 mm at 0 to 6 months to 2.6 mm at 217 to 228 months (1). The stalk/basilar artery ratio is also used in children, with the reported ratio obtained from magnetic resonance imaging (MRI) ranging from 0.59 to 0.73 (2). In adults, the normal diameter of the pituitary stalk measured on MRI is 2.4 ± 0.6 mm at the optic chiasm level and 1.9 ± 0.3 mm closer to the pituitary gland (3). As this narrow structure allows transmission of important hormones from the hypothalamus to the pituitary gland, even small pathologic lesions involving the pituitary stalk can induce significant endocrinopathy, especially central diabetes insipidus (CDI) (4, 5).
Therefore, contrast-enhanced brain MRI is highly recommended for evaluation of the hypothalamic-pituitary axis when a diagnosis of CDI is made (6). On MRI, pituitary stalk thickening (PST) and loss of the T1 bright spot in the posterior pituitary gland have frequently been observed in various etiologies involving the pituitary stalk (7). Indeed, PST was identified in 23% to 79% of patients with CDI (4, 5, 8). The differential diagnosis of PST is extensive and includes neoplastic (eg, germ cell tumor, Langerhans cell histiocytosis [LCH], craniopharyngioma, metastasis), inflammatory/infective (eg, hypophysitis, tuberculosis, sarcoidosis), and congenital etiology (eg, Rathke cleft cyst) (6, 9). As certain neoplastic etiologies require specific treatment, an appropriate diagnosis is of paramount importance. Although a considerable proportion of patients are diagnosed at initial workup (eg, according to neuroimaging, tumor markers, and cerebrospinal fluid cytology), the etiology of PST is not confirmed at this initial workup in up to 57% of patients identified with PST (7, 10). In these cases, follow-up MRI is mandatory for diagnostic confirmation.
To establish an appropriate diagnostic and surveillance strategy, the etiologic spectrum and natural course of PST should be understood. A number of studies have published data regarding the exact etiologies and natural course of PST (4, 5, 7, 8, 11-13), and we consider it timely to summarize these data. Therefore, we evaluated the neoplastic etiology and natural course of PST by performing a systematic review and meta-analysis.
Materials and Methods
This meta-analysis was performed in accordance with the Preferred Reporting Items for Systematic Reviews and Meta-Analyses (PRISMA) guidelines (14).
Search Strategy and Eligibility Criteria
A systematic search of MEDLINE/PubMed and EMBASE databases up to February 15, 2021, was performed using Medical Subject Headings or EMTREE terms to identify relevant articles. The search terms were as follows: ((pituitary stalk) AND ((thickening) OR (thickened))) AND ((MR) OR (MRI) OR (magnetic resonance imaging)). The search was not limited to human or animal studies, nor by language.
Studies or subgroups of studies were selected if all of the following requirements were satisfied: (a) inclusion of patients with PST on the basis of MRI findings; (b) sufficient information to calculate the proportion of PST etiologies or progression; and (c) clinical trials and observational studies published as original articles. Studies were excluded if any of the following criteria were met: (a) involving fewer than 10 patients; (b) case reports, conference abstracts, and reviews; (c) animal studies; or (d) not providing sufficient results for calculation of the proportion of PST etiologies or progression. The literature search and criteria application were conducted independently by 2 authors (D.Y.K. and P.H.K., with 1 and 4 years of experience performing systematic reviews and meta-analyses, respectively). Any discrepancies were resolved via a consensus meeting.
Data Extraction and Quality Assessment
The following data on the study design and results were collected using a standardized extraction form: (a) study characteristics: author, publication year, country of origin, recruitment period, and study design (retrospective vs. prospective; multicenter vs single center); (b) demographic and clinical characteristics: number of included patients, age, accompanying pituitary hormone deficiency, and follow-up period; and (c) characteristics of PST: definition of PST on MRI and etiology of PST. The quality of the evidence in the included studies was independently assessed by two authors (D.Y.K. and P.H.K., with 1 and 4 years of experience performing systematic reviews and meta-analyses, respectively) using the US National Institutes of Health Quality Assessment of Case Series Studies tool (15). Any discrepancies were resolved via a consensus meeting. Of note, questions 4 and 5 were modified to appropriately assess the included studies focusing on the purpose of this study.
Data Synthesis and Analysis
The proportion of neoplastic etiology in patients with PST was the primary outcome of our meta-analysis. In addition, the proportions of particular neoplasms (eg, germ cell tumor, metastasis, or LCH) were also analyzed. According to the 2016 revised classification of histiocytosis and neoplasms of macrophage-dendritic cell lineages, LCH is considered as a neoplasm (16, 17). The proportions and their 95% CIs were meta-analytically pooled using DerSimonian-Laird random-effects modeling to calculate weights. Heterogeneity was assessed using the Cochran Q test (P < .05 indicating the presence of heterogeneity) and the Higgins inconsistency index (I2; I2 > 50% indicating the presence of heterogeneity) (18-20). A funnel plot and Egger test were used to evaluate publication bias (21, 22). In addition, the publication bias-adjusted proportion was obtained using the trim-and-fill method (23). If the unadjusted and adjusted rates were similar, the results were considered to be robust to publication bias. A meta-regression analysis was performed on the study-level data to identify sources of heterogeneity affecting the proportion of neoplasms. This meta-regression included the following covariates: sample size (> 20 vs ≤ 20), study population categorized by age range (pediatric vs mixed), study population categorized by mean/median age (pediatric vs adult), proportion of patients with at least one pituitary hormone deficiency (> 50% vs ≤ 50%), and presence vs absence of CDI as inclusion criteria. Of note, when the study population was categorized by age range, only the studies including a pediatric population (age ≤ 18 years) were categorized as pediatric studies. By contrast, when the study population was categorized by mean/median age, the studies with a mean/median age of 18 years or younger were categorized as pediatric studies. To explore the factors suggesting a neoplastic condition, random-effects modeling was used to perform meta-analytic pooling of common variables analyzed in at least 2 studies. Continuous variables were compared between 2 etiologies (neoplastic vs nonneoplastic condition) by calculating the pooled mean difference with a P value across the studies. For binary variables, the meta-analytic pooled odds ratios (ORs) were calculated.
In initially indeterminate cases (defined as isolated PST without confirmed diagnosis at initial workup, that is, isolated PST without biopsy and requiring follow-up), the proportions of patients showing progression, regression, and a stable course of PST during follow-up were meta-analytically pooled. If available, the detailed etiologies were also analyzed.
The “meta” and the “metafor” packages in R software (version 3.6.1.; R Foundation for Statistical Computing) were used for statistical analyses. All statistical analyses were performed by one author (D.Y.K., with 1 year of experience performing systematic reviews and meta-analyses, respectively).
Results
Literature Search
Our study selection process is presented in Fig. 1. The systematic literature search initially identified 643 articles. After the removal of 193 duplicates, 450 articles were screened according to their abstracts, and 416 articles were excluded for the following reasons: (a) case reports (n = 316); (b) not in the field of interest (n = 58); (c) reviews (n = 26); (d) conference abstracts (n = 15); and (e) an animal study (n = 1). Full-text reviews of the remaining 34 potentially eligible articles were performed, and 16 studies were excluded for the following reasons: (a) fewer than 10 patients (n = 11); (b) insufficient details of the final diagnosis (n = 3); and (c) not in the field of interest (n = 2). Consequently, 18 studies covering 1368 patients with PST were included in our meta-analysis (4, 5, 7, 8, 10-13, 24-33).
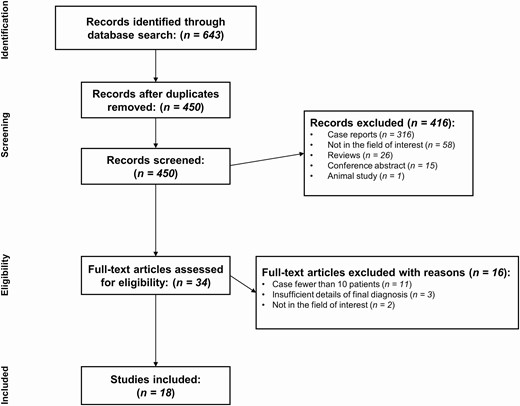
Flowchart of the study selection process.
Characteristics of the Included Studies
The study characteristics are described in detail in Table 1. Four studies were multicenter studies (4, 8, 13, 30). Only one of the included studies was prospective (5), with the remainder being retrospective (4, 7, 8, 10-13, 24-33). The patients had a mean/median age of 6.1 to 48.3 years, and 5 studies included only pediatric patients (5, 8, 27, 29, 33). The median follow-up period of the included studies ranged from 3.0 to 7.6 years. The definitions of PST varied across the studies in respect to the thickness cutoff and measurement methods. The most commonly applied cutoff was 3 mm (4, 5, 7, 10-12, 33), but 2 studies restricted the measurement site to the proximal portion (5, 33), and 1 study restricted the thickness to the width (11).
Characteristics of the 18 included studies
| Study (publication year) | Nation | Recruitment period | Multicenter | Design | Definition of pituitary stalk thickening | No. of patients | Age, y | Pituitary hormone deficiency, % | Median follow-up period, y (range) | ||
|---|---|---|---|---|---|---|---|---|---|---|---|
| Mean/median age (range) | Pediatric, %a | Central diabetes insipidus | ≥1 Anterior pituitary hormone deficiency | ||||||||
| Tien et al (1991) (24) | USA | 1986-1990 | No | Retrospective | ≥ 2.8 mm in diameter | 15 | 23.9 (1-57) | 33.3 | 100 | NR | NR |
| Leger et al (1999) (8) | France | NR | Yes | Retrospective | > 2 mm ≥ 1 portion (proximal, middle, distal) | 26 | 8 (2.5-18.6) | 100 | 100 | 88.5 | Clinical, 5.5 (0.3-12.3); radiological, 3.0 (0.6-8.4) |
| Maghnie et al (2000) (4) | Italy | 1970-1996 | Yes | Retrospective | ≥ 3 mm in diameter | 29 | 7.0b (0.1-24.8) | NR | 62.1 | 93.1 | 7.6a (1.6-26.2) |
| Jinguji et al (2013) (25) | Japan | Jan 2006-Dec 2011 | No | Retrospective | NR | 11 | 29.3 (6-75) | 45.5 | 81.8 | 72.7 | NR |
| Robison et al (2013) (26) | USA | Jan 1994-Apr 2008 | No | Retrospective | ≥ 2.6 mm in maximal diameter | 42 | 13.6 (0.8-19.7) | NR | 38.1 | 47.6 | 3.4 (0-12.8) |
| Turcu et al (2013) (10) | USA | 1987-2006 | No | Retrospective | ≥ 3 mm in diameter | 152 | 44 (2-82) | NR | 28.3 | 32.2 | NR |
| Di Iorgi et al (2014) (5) | Italy | 1998-2006 | No | Prospective | > 3 mm in proximal portion | 34 | 7.5b (1.0-12.9) | 100 | 100 | 88.2 | 5 |
| Jian et al (2014) (12) | China | 2005-2012 | No | Retrospective | > 3 mm in diameter | 37 | 29 (8.0-63.3) | 24.3 | 100 | 70.3 | 5.5 (0.7-13.0) |
| Yoon et al (2014) (27) | Korea | Jan 2000-Jun 2013 | No | Retrospective | NR | 52 | 8.8b (0.1-18) | 100 | NR | NR | NR |
| Haddam et al (2015) (28) | Algeria | 2000-2014 | No | Retrospective | > 2.5 mm, especially in middle or lower part | 24 | 42b (4.5-60) | 12.5 | 100 | 41.7 | NR (2-10) |
| Werny et al (2015) (29) | USA | Jan 2000-Dec 2013 | No | Retrospective | ≥ 3.5 mm in average of maximum measurements on sagittal and coronal images | 10 | 6.1b (0.2-13.3) | 100 | 100 | NR | 4.1 (0.5-13.5) |
| Sbardella et al (2016) (30) | UK | Jan 2007-Dec 2015 | Yes | Retrospective | > 3.25 mm in proximal portion and/or > 1.9 mm in distal portion | 36 | 37 (4-83) | 27.8 | 47.2 | 44.4 | NR (> 1) |
| Cai et al (2017) (31) | China | 2007-2014 | No | Retrospective | >3.5 mm in diameter | 44 | 27.6b (2-80) | NR | NR | NR | 5.9b (2-18) |
| Lee et al (2017) (32) | Korea | Jan 2009-Mar 2016 | No | Retrospective | NR | 158 | 48.3 | NR | 49.4 | 53.8 | 3.0 (> 1) |
| Andrés et al (2019) (33) | Spain | 2003-2016 | No | Retrospective | ≥ 3 mm in proximal portion | 14 | 9.6 (1.3-15.9) | 100 | 100 | 71.4 | 5.5b (1.611.8) |
| Ling et al (2019) (11) | China | Jan 2012-Feb 2018 | No | Retrospective | > 3 mm in width | 325 | 30.5 | NR | 17.5 | NR | NR |
| Zhou et al (2019) (7) | China | Jan 2014-May 2017 | No | Retrospective | > 3.0 mm in diameter or presence of an abnormal nodule along stalk | 321 | 31.6 (3.0-82.9) | 28.3 | 68.8 | 57.6 | NR |
| Devuyst et al (2020) (13) | Belgium and France | 1991-2016 | Yes | Retrospective | > 4 mm in proximal portion (optic chiasm level) and/or > 2.8 mm in medial portion and/or > 2.5 mm in distal portion (pituitary insertion level) | 38 | 31 (15-86) | NR | 100 | 57.9 | 4.6 (0.5-19.8) |
Abbreviations: NR, not reported; USA, United States of America.
aPatients were considered to be a pediatric population when age was 18 or younger.
bOnly data regarding the total population of each study were available.
Regarding pituitary hormone deficiency, CDI was the most common pituitary hormone deficiency, with a pooled proportion of 71.8% (95% CI, 55.8%-83.7%). Details of pituitary hormone deficiencies according to specific etiologies and on the basis of available data are summarized in Table 2.
Detailed pituitary hormone deficiency according to specific etiologies
| Etiology | No. of patients | Pituitary hormone deficiency | ||||
|---|---|---|---|---|---|---|
| Vasopressin (%) | GH (%) | TSH (%) | ACTH (%) | FSH/LH (%) | ||
| Germ cell tumor | 26 | 26 (100) | 19 (73) | 14 (54) | 12 (46) | 15 (58) |
| LCH | 17 | 17 (100) | 7 (41) | 7 (41) | 3 (18) | 6 (35) |
| Hypophysitis | 3 | 2 (67) | – | – | – | – |
| Neoplastic, unclassified | 149 | 75 (50) | 2 of 10 (20)a | 2 of 10 (20)a | 3 of 10 (30)a | 4 of 10 (40)a |
| Nonneoplastic, unclassified | 87 | 36 (41) | 4 of 26 (15)a | 3 of 26 (12)a | 3 of 26 (12)a | 6 of 26 (23)a |
Abbreviations: ACTH, adrenocorticotropin; FSH, follicle-stimulating hormone; GH, growth hormone; LCH, Langerhans cell histiocytosis; LH, luteinizing hormone; TSH, thyrotropin.
aOnly Sbardella et al (30) reported the proportion of patients with specific pituitary hormone deficiency.
Aside from pituitary hormone dysfunction, headache (22.6%; 95% CI, 4.7%-63.1%) and visual disturbance (18.7%; 95% CI, 10.6%-30.9%) were common clinical manifestations. In addition, lethargy (13.9%; 5 of 36), seizure or altered mental state (13.2%; 10 of 76), poor appetite (8.3%; 3 of 36), vomiting (5.3%; 4 of 76), gait disturbance (2.6%; 2 of 76), and hearing loss (1.3%; 1 of 76) were reported. The quality of the included studies was good in 13 studies (4, 5, 7, 8, 10-13, 26, 29, 30, 32, 33) and fair in 5 studies (24, 25, 27, 28, 31) (Table 3).
Quality assessment of the 18 included studies
| Study (publication y) | NIH Quality Assessment Tool for Case Series Studies criteria met | Quality rating | ||||||||
|---|---|---|---|---|---|---|---|---|---|---|
| Q1 | Q2 | Q3 | Q4a | Q5a | Q6 | Q7 | Q8 | Q9 | ||
| Tien et al (1991) (24) | ✓ | ✓ | NR | ✓ | ✗ | ✗ | ✓ | ✓ | ✓ | Fair |
| Leger et al (1999) (8) | ✓ | ✓ | NR | ✓ | ✓ | ✓ | ✓ | ✓ | ✓ | Good |
| Maghnie et al (2000) (4) | ✓ | ✓ | NR | ✓ | ✓ | ✓ | ✓ | ✓ | ✓ | Good |
| Jinguji et al (2013) (25) | ✓ | ✓ | NR | ✗ | ✗ | ✗ | ✓ | ✓ | ✓ | Fair |
| Robison et al (2013) (26) | ✓ | ✓ | NR | ✓ | ✓ | ✓ | ✓ | ✓ | ✓ | Good |
| Turcu et al (2013) (10) | ✓ | ✓ | NR | ✓ | ✓ | ✗ | ✓ | ✓ | ✓ | Good |
| Di Iorgi et al (2014) (5) | ✓ | ✓ | ✓ | ✓ | ✓ | ✓ | ✓ | ✓ | ✓ | Good |
| Jian et al (2014) (12) | ✓ | ✓ | NR | ✓ | ✓ | ✓ | ✓ | ✓ | ✓ | Good |
| Yoon et al (2014) (27) | ✓ | ✗ | NR | ✓ | ✗ | ✗ | NR | ✓ | ✓ | Fair |
| Haddam et al (2015) (28) | ✓ | ✓ | NR | ✓ | ✓ | ✗ | ✗ | ✓ | ✗ | Fair |
| Werny et al (2015) (29) | ✓ | ✓ | NR | ✓ | ✓ | ✓ | ✓ | ✗ | ✓ | Good |
| Sbardella et al (2016) (30) | ✓ | ✓ | NR | ✓ | ✓ | ✓ | ✓ | ✓ | ✓ | Good |
| Cai et al (2017) (31) | ✓ | ✓ | NR | ✓ | ✗ | ✗ | ✓ | ✓ | ✓ | Fair |
| Lee et al (2017) (32) | ✓ | ✓ | ✓ | ✓ | ✗ | ✓ | ✓ | ✓ | ✓ | Good |
| Andrés et al (2019) (33) | ✓ | ✓ | NR | ✓ | ✓ | ✓ | ✓ | ✓ | ✓ | Good |
| Ling et al (2019) (11) | ✓ | ✓ | NR | ✓ | ✓ | ✓ | ✓ | ✓ | ✓ | Good |
| Zhou et al (2019) (7) | ✓ | ✓ | NR | ✓ | ✓ | ✓ | ✓ | ✗ | ✓ | Good |
| Devuyst et al (2020) (13) | ✓ | ✓ | NR | ✓ | ✓ | ✓ | ✓ | ✓ | ✓ | Good |
Good met 7 to 9 criteria. Fair met 4 to 6 criteria. Poor met 0 to 3 criteria.
Abbreviations: NA, not applicable; NIH, National Institutes of Health; NR, not reported; Q1, Was the study question or objective clearly stated?; Q2, Was the study population clearly and fully described, including a case definition?; Q3, Were the cases consecutive?; Q4, Did the study population match the review question?; Q5, Was the definition of pituitary stalk thickening clearly described?; Q6, Were the stalk thickness measures clearly stated, valid, reliable, and implemented consistently across all study participants?; Q7, Was the length of follow-up adequate? (When all included lesions were confirmed by biopsy, we considered it as satisfactory irrespective of the length of follow-up); Q8, Were the statistical methods well-described? (When detailed statistical analysis was not needed, we considered it as satisfactory); Q9, Were the results well-described?
aQ4 and Q5 were modified to appropriately assess the included studies according to the purpose of this study.
Etiology of Pituitary Stalk Thickening
A total of 17 studies reported the proportion of neoplasm in patients with PST. The reported proportion ranged from 12.5% to 90.4%, with a pooled proportion of neoplasm of 45.2% (95% CI, 33.3%-57.8%; Fig. 2). Substantial heterogeneity was noted across the studies (I2 = 93%; P < .001). Although there was no significant publication bias according to the Egger test (P = .166), the publication bias-adjusted proportion obtained using the trim-and-fill method was considerably lower (30.4%; 95% CI, 19.6%-43.8%), implying a possibility of publication bias.
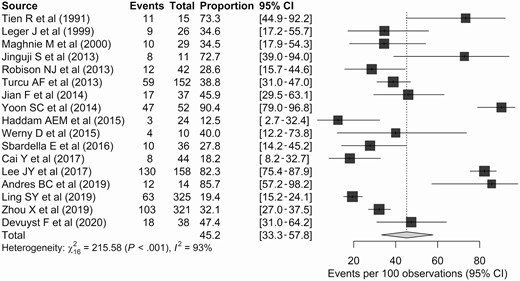
Forest plots representing the proportions of neoplasms in the included studies.
Types of Neoplasm
Details of the types of neoplasm are summarized in Table 4. The most common neoplasm was germ cell tumor, with a meta-analytically pooled proportion among the PST cases of 14.0% (95% CI, 9.2%-20.6%). LCH (10.2%; 95 CI%, 6.4%-15.8%) and metastasis (4.7%; 95% CI, 2.2%-9.5%) were also common neoplasms. In terms of metastasis, lung cancer was the most common primary cancer (44.2%; 42/95), followed by breast cancer (25.3%; 24/95) and lymphoma (9.5%; 9/95).
Types of neoplasm
| Diagnosis | No. of cases | Proportion, % |
|---|---|---|
| Germ cell tumor | 134 | 10.5 |
| Metastasis | 95 | 7.4 |
| Metastatic lung cancer | 42 | 3.3 |
| Metastatic breast cancer | 24 | 1.9 |
| Unspecified | 10 | 0.8 |
| Metastatic lymphoma | 9 | 0.7 |
| Metastatic stomach cancer | 5 | 0.4 |
| Metastatic skin cancer | 2 | 0.2 |
| Metastatic thyroid cancer | 2 | 0.2 |
| Metastasis of unknown origin | 1 | 0.1 |
| Langerhans cell histiocytosis | 87 | 6.8 |
| Craniopharyngioma | 45 | 3.5 |
| Leukemia/lymphoma | 21 | 1.7 |
| Astrocytoma | 11 | 0.9 |
| Erdheim-Chester disease | 8 | 0.6 |
| Meningioma | 4 | 0.3 |
| Granulosa cell tumor | 2 | 0.2 |
| Pituicytoma | 2 | 0.2 |
| Prolactinoma | 2 | 0.2 |
| Cavernous hemangioma | 1 | 0.1 |
| Choroid plexus carcinoma | 1 | 0.1 |
| Glioblastoma | 1 | 0.1 |
| Neuronal neoplasm | 1 | 0.1 |
| Pituitary carcinoma | 1 | 0.1 |
| Pleomorphic xanthoastrocytoma | 1 | 0.1 |
| Polyclonal hypergammaglobulinemia | 1 | 0.1 |
| Schwannoma | 1 | 0.1 |
| Spindle cell carcinoma | 1 | 0.1 |
Factors Suggesting Neoplasm
We also performed supplementary analyses to explore factors suggesting neoplasm. Of the continuous variables, the pituitary stalk was thicker in neoplasms than in other causes of thickening, with borderline significance (pooled mean difference, 2.08 mm; 95% CI, −0.26 to 4.42 mm; P = .08). The reported ranges of thickness in neoplastic and other conditions were 4.2 to 10.1 mm and 3.4 to 7.4 mm, respectively. Only one study reported a cutoff thickness for the discrimination of neoplasm, with this being 5.3 mm (32). Among the binary variables analyzed, the presence of DI (OR, 3.66; P = .34), diffuse stalk thickening (OR, 0.66; P = .64), absence of high T1 signal (OR, 1.07; P = .89), and at least one anterior pituitary hormone deficiency (OR, 2.71; P = .54) did not show significant differences between the neoplasms and other causes.
Initially Indeterminate Cases
PST was clinically indeterminate in 106 patients from 4 studies (4, 5, 7, 8). The median follow-up period of these studies ranged from 3.0 to 7.6 years. The definitions of progression varied across the studies. Zhou et al defined progression as an increase of 20% in the stalk thickness (7). By contrast, the degree of PST was graded by Di Iorgi et al (5) (minimal, 3.1-3.9 mm; moderate, 4.0-6.5 mm; severe, > 6.5 mm) and Maghnie et al (4) (minimal, 3.0-4.5 mm; moderate, 4.6-6.5 mm; severe, > 6.5 mm), and progression of PST was defined as upgrading of the degree of PST.
Consequently, 18.5% (95% CI, 7.6%-38.3%) of the patients showed progression of PST during follow-up (Fig. 3), and their mean or median time-to-progression was 0.7 to 1.8 years. The detailed etiology was available for only 6 of 16 progressed cases, and germinoma was the final diagnosis in all these patients. By contrast, 61.6% (95% CI, 35.5%-82.3%) of patients showed spontaneous regression of PST.
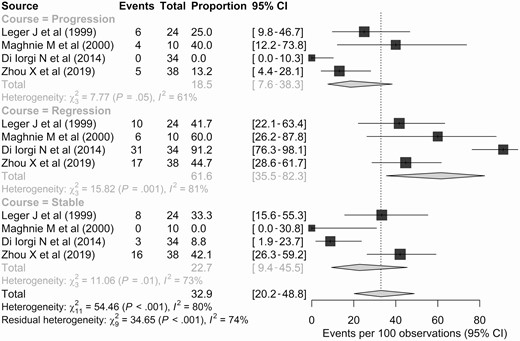
Forest plots representing the proportions of patients with clinically indeterminate pituitary stalk thickening showing progression, a stable course, or regression during follow-up.
Subgroup and Meta-regression Analysis
Meta-regression analyses were performed to identify sources of heterogeneity affecting the proportion of neoplasms. Consequently, the studies on pediatric populations (when categorized by age range; only the studies including a pediatric population [age ≤ 18 years]) showed a higher proportion of neoplasms than the studies on mixed populations, with the difference showing borderline significance (pediatric, 67.4% vs mixed studies, 39.4%; P = .067). In 5 studies with pediatric patients (5, 8, 27, 29, 33), the pooled proportion of neoplasm was 67.4% (95% CI, 29.8%-91.0%), with substantial heterogeneity shown across the studies (I2 = 88%; P < .001). The most common neoplasm was germ cell tumor (26.9%; 95% CI, 5.9%-68.4%), followed by LCH (22.2%; 95% CI, 12.7%-35.9%). There was no metastasis in the included pediatric population (Fig. 4).
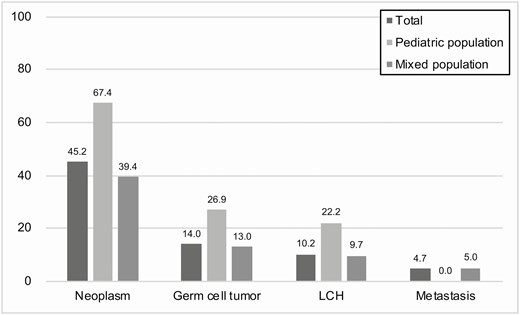
The pooled proportions of neoplasm, germ cell tumor, Langerhans cell histiocytosis (LCH), and metastasis according to the study population.
In addition, studies with a smaller sample size (≤ 20) showed a higher proportion of neoplasms than studies with a larger sample size (> 20), with the difference showing borderline significance (≤ 20, 69.1% vs > 20, 39.4%; P = .052). Studies with more than 50% of the patients showing at least one pituitary hormone deficiency also tended to show a higher proportion of neoplasms than studies with less than 50% of patients showing a deficiency (> 50%, 54.6% vs ≤ 50%, 29.4%; P = .061) (Table 5).
Results of the meta-regression based on study-level data
| Covariates | Category | % of neoplasm (95% CI) | P |
|---|---|---|---|
| Sample size | > 20 | 39.4 (27.3-53.1) | .052 |
| ≤ 20 | 69.1 (48.4-84.2) | ||
| Study populationa (categorized by age range) | Pediatric | 67.4 (29.8-91.0) | .067 |
| Mixed | 39.4 (27.6-52.6) | ||
| Study populationa (categorized by mean/median age) | Pediatric | 54.5 (29.3-77.6) | .349 |
| Adult | 41.0 (27.5-56.0) | ||
| Proportion of patients with ≥ 1 pituitary hormone deficiency | > 50% | 54.6 (35.1-72.7) | .061 |
| ≤ 50% | 29.4 (20.1-40.8) | ||
| Central diabetes insipidus as inclusion criteria | Present | 46.8 (31.3-63.0) | .811 |
| Not reported | 44.1 (28.7-60.8) |
aWhen the study population was categorized by age range, only the studies including a pediatric population (age ≤ 18 years) were categorized into pediatric studies. By contrast, when the study population was categorized by mean/median age, the studies with a mean/median age of 18 or younger were categorized into pediatric studies.
Discussion
Our meta-analysis showed that approximately half of the patients with PST (45.2%) were diagnosed with neoplasm. Germ cell tumor was the most common neoplasm (14.0%), followed by LCH (10.2%) and metastasis (4.7%). In patients with initially indeterminate PST, 18.5% showed radiologic progression, while 61.6% showed regression during follow-up. The proportion of neoplasms was higher in pediatric populations (67.4% vs 39.4%) than in adults. Germ cell tumor (26.9%) and LCH (22.2%) were the predominant neoplasm types, and there was no metastasis in the pediatric populations. In addition, the proportion of neoplasms tended to be higher in those studies including a high number of patients with at least one pituitary hormone deficiency.
Considering the high proportion of neoplasms, especially in pediatric groups, a thorough initial diagnostic workup is required in patients with PST. Of note, germ cell tumor and LCH were the predominant neoplastic etiologies. Tumor marker evaluation, including human chorionic gonadotropin and alpha-fetoprotein in the serum and cerebrospinal fluid, is mandatory for the discrimination of germ cell tumor (34). In addition, because 6% to 13% of intracranial germ cell tumors show bifocality (involving both pineal and suprasellar regions) (35-37), and about 10% of suprasellar germ cell tumors show gross ventricular seeding (37), meticulous evaluation for synchronous intracranial tumor involvement is required. As more than 50% of LCH cases occur in flat bone (skull, rib, and pelvis) (38), a skeletal survey with or without bone scan seems to be a reasonable initial diagnostic test (39). If available, whole-body MRI can be a reliable diagnostic test, showing higher accuracy than skeletal survey and bone scan (39).
We found that the proportion of neoplasms tended to be higher in studies with more than 50% of patients having at least one pituitary hormone deficiency. Although this did not imply a direct association, one can assume that neoplastic diseases affecting the pituitary stalk may be more likely to cause hormone deficiency. Indeed, CDI was documented in most of the patients with germ cell tumor and LCH (see Table 2). Other pituitary hormone deficiencies, including growth hormone, thyrotropin, and follicle-stimulating hormone/luteinizing hormone deficiency, were also documented in more than half of the patients with germ cell tumor. In addition, more than one-third of the patients with LCH showed growth hormone, thyrotropin, and follicle-stimulating hormone/luteinizing hormone deficiency. Therefore, in patients with neoplastic etiology, thorough endocrinological investigation and appropriate management are required. Additionally, in clinically indeterminate cases with more than one pituitary hormone deficiency, the possibility of neoplastic etiology should be considered. However, detailed information on pituitary hormone deficiency according to specific etiologies was available for only a small number of patients. In addition, information on how sequential changes in pituitary hormone deficiencies depended on specific etiologies was not available. Further research is required to clarify this.
Because progression of PST is not uncommon during follow-up, follow-up imaging is mandatory in initially indeterminate cases. However, the optimal follow-up period for patients with isolated PST is unclear. Di Iorgi et al (5, 40) recommend patients with PST undergo neuroimaging every 6 months for 3 years. Germ cell tumor was the single confirmed etiology in progressed cases (6/16), and 6 patients with progressed PST who were confirmed to have a germ cell tumor showed radiologically perceivable progression 0.6 to 1.8 years after initial MRI (4, 8). Among these 16 patients, germ cell tumor (n = 7) and LCH (n = 4) were confirmed within 2.5 years of follow-up (5). Considering these results, the 3-year follow-up suggested by Di Iorgi et al (5) seems reasonable for the discrimination of germ cell tumor. However, some LCHs have been diagnosed up to 10 years after the diagnosis of isolated PST (5, 41). Further research seems mandatory to clarify the optimal length of the follow-up period.
Although our study demonstrated that neoplasms showed a pituitary stalk about 2 mm thicker than those resulting from other causes, with the difference showing borderline significance, an exact cutoff value is necessary for use in clinical practice. One study reported a cutoff thickness of 5.3 mm for the discrimination of neoplasm (32). However, because of considerable overlap between neoplastic and nonneoplastic groups (4.2-10.1 vs 3.4-7.4 mm), optimal cutoff values should be further explored.
Our study has several limitations. First, the proportion of neoplasms showed substantial heterogeneity across the studies. Although subgroup and meta-regression analysis showed that the proportion of neoplasms differed depending on the study population (pediatric vs mixed), this factor was not sufficient to resolve the heterogeneity. Second, a publication bias might have resulted in overestimation of the proportion of neoplasms, especially considering the discrepancy between the publication bias-adjusted and unadjusted proportions (30.4% vs 45.2%) and the results of the meta-regression analysis that revealed sample size was a potential source of heterogeneity. Third, the time-to-progression data were unclear in the indeterminate cases; further longitudinal studies may be helpful for developing a surveillance strategy. Fourth, imaging factors favoring neoplasm or a specific neoplastic condition (eg, germ cell tumor, LCH, or metastasis) could not be evaluated from the study-level data provided. Nevertheless, our study reaffirms the importance of careful follow-up for PST patients with suspicion of neoplasm.
In conclusion, PST was commonly confirmed to be neoplastic, especially in pediatric populations. Germ cell tumor, LCH, and metastasis were the predominant etiological diagnoses of neoplasms. As isolated PST frequently progressed during follow-up, follow-up imaging of at least 3 years should be considered as mandatory in initially indeterminate cases.
Abbreviations
- ACTH
adrenocorticotropin
- CDI
central diabetes insipidus
- FSH
follicle-stimulating hormone
- GH
growth hormone
- LCH
Langerhans cell histiocytosis
- LH
luteinizing hormone
- MRI
magnetic resonance imaging
- NA
not applicable
- NIH
National Institutes of Health
- NR
not reported
- OR
odds ratio
- PST
pituitary stalk thickening
- TSH
thyrotropin
- USA
United States of America
Acknowledgments
Financial Support: The authors received no financial support for the research, authorship, and/or publication of this article.
Additional Information
Disclosures: The authors have nothing to disclose.
Data Availability
Data sharing is not applicable to this article because no data sets were generated or analyzed during the present study.
References
Author notes
D.Y.K. and P.H.K. contributed equally to this work.
