


Abstract
Dietary fat and protein impact postprandial hyperglycemia in people with type 1 diabetes, but the underlying mechanisms are poorly understood. Glucoregulatory hormones are also known to modulate gastric emptying and may contribute to this effect.
Investigate the effects of fat and protein on glucagon-like peptide (GLP-1), glucagon-dependent insulinotropic polypeptide (GIP) and glucagon secretion.
2 crossover euglycemic insulin clamp clinical trials at 2 Australian pediatric diabetes centers. Participants were 12-21 years (n = 21) with type 1 diabetes for ≥1 year. Participants consumed a low-protein (LP) or high-protein (HP) meal in Study 1, and low-protein/low-fat (LPLF) or high-protein/high-fat (HPHF) meal in Study 2, all containing 30 g of carbohydrate. An insulin clamp was used to maintain postprandial euglycemia and plasma glucoregulatory hormones were measured every 30 minutes for 5 hours. Data from both cohorts (n = 11, 10) were analyzed separately. The main outcome measure was area under the curve of GLP-1, GIP, and glucagon.
Meals low in fat and protein had minimal effect on GLP-1, while there was sustained elevation after HP (80.3 ± 16.8 pmol/L) vs LP (56.9 ± 18.6), P = .016, and HPHF (103.0 ± 26.9) vs LPLF (69.5 ± 31.9) meals, P = .002. The prompt rise in GIP after all meals was greater after HP (190.2 ± 35.7 pmol/L) vs LP (152.3 ± 23.3), P = .003, and HPHF (258.6 ± 31.0) vs LPLF (151.7 ± 29.4), P < .001. A rise in glucagon was also seen in response to protein, and HP (292.5 ± 88.1 pg/mL) vs LP (182.8 ± 48.5), P = .010.
The impact of fat and protein on postprandial glucose excursions may be mediated by the differential secretion of glucoregulatory hormones. Further studies to better understand these mechanisms may lead to improved personalized postprandial glucose management.
Minimizing the time spent above the target blood glucose range reduces the risk of both the development and progression of long-term micro- and macrovascular complications associated with type 1 diabetes (T1D). However, achieving optimal postprandial blood glucose control remains challenging given the many relevant factors, including the quantity of macronutrients, types of foods consumed, and the insulin regimen (1). In people with T1D, there is a loss of endogenous insulin in response to meals and this may impact the glucoregulatory hormone response. The digestion and absorption of food components is associated with the secretion of multiple glucoregulatory hormones, which act on target sites, 1 of which is the rate of gastric emptying, to promote the efficient uptake and storage of energy and nutrients. The influence of hormones on glucose regulation and gastric emptying has been of interest (2, 3) but there is limited information about the concentrations of glucoregulatory hormones in response to meals of varying macronutrient compositions in individuals with T1D, and, hence, the potential influence of glucoregulatory hormones on insulin requirements after eating foods high in fat and protein.
Gastric emptying and glycemic control pathways are closely interrelated processes and share a bidirectional relationship. The delivery of nutrients to the small intestine is a major determinant of postprandial glycemic excursions. Gastric emptying is a complex, coordinated process and is a rate-limiting step in carbohydrate absorption (4). The rate of gastric emptying is influenced by the physical composition (solid/liquid), energy density, and macronutrient composition of foods and beverages. In both healthy individuals and those with diabetes, the rate of gastric emptying shows a wide interindividual, and less intraindividual variation, with a range of 4 to 17 kilojoules (1-4 kilocalories) per minute (5). The few studies that have investigated gastric emptying in young people with T1D have yielded inconsistent results reporting delayed emptying (6), rapid emptying (7), or no difference (8) compared with healthy controls.
Dietary protein stimulates the insulin response required for amino acid uptake in individuals without diabetes (9), and to maintain euglycemia protein concurrently stimulates glucagon secretion, promoting hepatic glucose release to regulate blood glucose levels (BGLs) (10). However, in people with T1D there is little, if any, insulin and, following the consumption of protein, a delayed and sustained elevation of postprandial BGL (11). There is little information about the impact of dietary fat and protein on the glucoregulatory hormones that play a role in gastric emptying and glucose regulation, including glucose-dependent insulinotropic polypeptide (GIP) and glucagon-like peptide 1 (GLP-1), and glucagon. Conducting such investigations under euglycemic conditions may negate the potential influence of hyper- and hypoglycemia on the secretion of these hormones (12, 13).
The incretin hormones, GIP and GLP-1, are intestinal hormones released in response to meals. Levels of GIP rise with nutrient ingestion, inhibiting gastric acid secretion, but GIP probably does not affect gastric emptying (14), although 1 study suggested that it may lead to a modest acceleration (15). In healthy individuals, GIP stimulates insulin secretion in a glucose-dependent manner, while GLP-1 also has a glucose-dependent effect on insulin secretion and, in addition, reduces glucagon secretion and delays gastric emptying (16). In contrast to GLP-1, GIP has been reported to stimulate glucagon (17). The main function of glucagon is to maintain the BGL by activating gluconeogenesis and glycogenolysis. Although hypoglycemia is the most potent secretory stimulus for glucagon, glucagon also increases in response to increasing plasma amino acid concentrations after ingesting protein (18).
Dietary fat has been shown to alter the release of hormones that impact glycemic regulation, including GLP-1 and GIP (19). However, there is little information about the secretion of GIP and GLP-1 in young people with T1D in response to meals high in fat and protein. A study in healthy individuals reported that dietary fat, when consumed alone, increased postprandial glucagon and GLP-1 levels, and that the addition of carbohydrate to the fat did not affect this increase (19). A study in adolescents with T1D reported increased GLP-1, GIP, and ghrelin levels after consuming a high-fat energy-dense meal, compared with a low-fat meal with the same amount of carbohydrate (2). Only 1 study has examined the plasma concentrations of glucoregulatory hormones in children with T1D and healthy controls after a carbohydrate-containing meal (3). However, this meal had minimal protein and fat and thus did not reflect commonly consumed mixed meals.
This study aimed to identify how the addition of protein, with or without fat, affects the secretion of glucoregulatory hormones in adolescents and young adults with T1D. The objectives of this study were to (1) document the glucoregulatory hormone profile of adolescents and young adults with T1D in response to meals high in protein, with and without fat and; (2) investigate differences in the total concentration, peak levels and time to peak of 3 glucoregulatory hormones, GLP-1, GIP and glucagon, after the addition of protein and protein and fat to meals with a standardized carbohydrate content.
Materials and Methods
Study Design
The reported data are derived from 2 separate randomized crossover studies with matching designs. The studies were conducted in controlled environments maintaining postprandial euglycemia. Study 1 evaluated the effects of a low-protein (LP) compared with a high-protein (HP) meal, while Study 2 assessed a low-protein low-fat (LPLF) meal, compared with a high-protein high-fat (HPHF) meal on glucoregulatory hormones. The methodologies in these studies have been documented (12, 13). Ethics approvals were granted by the Princess Margaret Hospital Human Research Ethics Committee (2016049EP) and the Hunter New England Human Research Ethics Committee (16/05/18/4.02).
Participants
Test Meal Compositions
For both studies, the 2 test meals contained a consistent amount of carbohydrate (30 g) from the same food source (pasta). The energy contents of the test meals were as follows: LP (958 kJ), HP (1874 kJ), LPLF (760 kJ), and HPHF (2998 kJ). The ingredient and macronutrient profiles of the meals are summarized in Table 1. The order in which the participants received the meals was randomized with a washout period of at least 1 week between meals to prevent carryover effects. Meals were consumed within 20 minutes under supervision of a study team member. No other oral intake (excluding water) was permitted for the 5 hours following test meal consumption.
Nutrient composition of the test meals in Study 1 and Study 2
| Carbohydrate (g) | Fat (g) | Protein (g) | Fiber (g) | |
|---|---|---|---|---|
| Study 1 | ||||
| Low-protein meal | ||||
| San Remo™ wheat-based pasta | 27.4 | 0.6 | 4.4 | 1.3 |
| Paul Newman™ Tomato and basil pasta sauce | 2.5 | 0.4 | 0.5 | 0 |
| Bertolli™ Extra light olive oil | 0 | 7 | 0 | 0 |
| Fresh tomato | 1.2 | 0 | 0.5 | 0.6 |
| Total | 31.1 | 8 | 5.4 | 1.9 |
| High-protein meal | ||||
| San Remo™ wheat-based pasta | 27.4 | 0.6 | 4.4 | 1.3 |
| Paul Newman™ Tomato and basil pasta sauce | 3.3 | 0.9 | 0.6 | 0 |
| 97% lean beef mince | 0 | 6.9 | 54.6 | 0 |
| Fresh tomato | 1.2 | 0 | 0.5 | 0.6 |
| Total | 31.9 | 8.4 | 60.1 | 1.9 |
| Study 2 | ||||
| Low-protein low fat meal | ||||
| San Remo™ wheat-based pasta | 26.6 | 0.5 | 4.3 | 1.3 |
| Paul Newman™ Tomato and basil pasta sauce | 2.5 | 0.4 | 0.5 | 0 |
| Western Star™ original butter | 0 | 4 | 0 | 0 |
| Fresh pureed tomato | 1.2 | 0 | 0.5 | 0.6 |
| Total | 30.3 | 4.9 | 5.3 | 1.9 |
| High-protein high-fat meal | ||||
| San Remo™ wheat-based pasta | 26.6 | 0.5 | 4.3 | 1.3 |
| Paul Newman™ Tomato and basil pasta sauce | 2.5 | 0.4 | 0.5 | 0 |
| Western Star™ Original butter | 0 | 21.7 | 0 | 0 |
| Fresh pureed tomato | 1.2 | 0 | 0.5 | 0.6 |
| Coles 5-star 95% fat-free mince | 0 | 17.7 | 54.6 | 0 |
| Total | 30.3 | 40.3 | 59.9 | 1.9 |
Data Collection
Participants attended 2 testing sessions at least 1 week apart. They arrived at the research center at 08:00 hours, after an overnight fast and having followed a similar routine for meals and exercise on the day prior to study days. No long-acting insulin was administered for 24 hours prior to the study, and delivery of continuous subcutaneous insulin was ceased 2 hours prior to arrival at the research center. Participants were asked to not self-administer any correction dose of insulin in the 5 hours prior to the start of the study. Ketones were tested upon arrival to the research center and every 30 to 60 minutes throughout the insulin clamp period. The study day was rescheduled if fasting BGL on the morning of the study were <3.5 mmol/L, or <4.0 mmol/L with symptoms indicative of hypoglycemia.
On arrival at the research facility, a cannula was inserted into a vein in the antecubital fossa of each arm. One cannula was used for collection of blood for measurement of venous BGL, to guide the adjustments in the insulin infusion rate. Samples were collected at 5- to 10-minute intervals and were analyzed using the YSI 2300STAT glucose-lactate analyzer (YSI, Yellow Springs, OH). A variable rate insulin infusion (1 U insulin lispro per 1 mL of 0.9% saline) was commenced to stabilize their BGL between 4.0 and 6.0 mmol/L (target 5.0 mmol/L); and was delivered using the Arsena GH Plus with a minimum flow rate of 0.1 mL/hour (equivalent to 0.1 units/hour). After the BGL were stabilized for 2 hours, participants consumed the test meal. The variable rate insulin clamp was maintained for 5 hours following ingestion of the meal to achieve a target BGL of 5 mmol/L. Throughout the clamp sessions, participants rested in a seated position. Blood samples for subsequent measurement of plasma GLP-1, GIP, and glucagon were collected every 30 minutes, commencing at 30 minutes prior to the ingestion of the test meal and continuing for 5 hours after eating, with the exception of GIP and GLP-1 which were not measured at 210 and 270 minutes in Study 1. To prevent hormone degradation, Dipeptidyl Peptidase 4 (DPP-IV: Merck, DPP4-010) and Protease Inhibitor Cocktail PIC (Sigma-Aldrich, P2714-1BTL) were added to the K3ETDA tubes containing GlP and GLP-1; and Aprotonin was added to the K3ETDA tubes containing glucagon. In addition, after processing, all samples were immediately transferred and stored at –80°C.
Plasma glucagon was measured by radioimmunoassay (Millipore Cat# GL-32K, RRID:AB_2757819); the minimum detectable limit was 15 pg/mL, inter- and intra-assay coefficients of variation (CVs) were 6.5% and 3.3%, respectively. Plasma GLP-1 was measured by radioimmunoassay (Millipore Cat# GLP1T-36HK, RRID:AB_2757816); the minimum detectable limit was 3 pmol/L, intra- and interassay CVs were 6.4% and 10.3% respectively. Plasma GIP was measured by radioimmunoassay using some modifications (20) of a previously published method (21) (Peninsula Laboratories Cat# T-4052.0500, RRID:AB_518352). The minimum detectable limit was 2 pmol/L, interassay CV was 9.5% and intra-assay CV was 4.2%.
Statistical Analysis
Area under the curve (AUC) was calculated for each hormone over the 5-hour period following each meal using the trapezoidal rule. The peak value of each hormone in the 5-hour period following each meal was identified and where multiple instances of this value were noted, the time to peak was calculated based on the first instance.
In each study, the effect of the meal on each outcome was assessed using linear mixed models including a random effect for individual and fixed effects for meal, period, and sequence. Model residuals were examined for non-normality and heteroskedasticity and where violations were noted, log-transformations were applied to allow model assumptions to be met. Given the small size of the samples, the Satterthwaite approximation for denominator degrees of freedom was used to calculate P values. Meal effect was either expressed as a difference in means (95% CI) or ratio of geometric means (where outcomes were log transformed). Data from both studies were analyzed separately using STATA Version 16.0 and P < .05 was considered statistically significant. No formal comparisons across studies were conducted.
Results
The demographic characteristics of the study participants are summarized in Table 2. AUC, peak value and the time to peak for the 3 hormones (GLP-1, GIP, and glucagon) are provided in Table 3. Data are presented as mean ± standard deviation, unless otherwise specified. This table also contains the meal effect based on the mixed models from Study 1 (comparing HP to LP) and Study 2 (comparing HPHF to LPLF) expressed as a difference in means or ratio of geometric means (where outcomes were log transformed) along with 95% CI.
Demographics of study participants in Study 1 (n = 11) and Study 2 (n = 10)
| Study 1 | Study 2 | ||
|---|---|---|---|
| Participants n | 11 | 10 | |
| Age (years) | 16.5 ± 2.8 | 16.1 ± 2.5 | |
| Sex | Female n | 6 | 4 |
| Male n | 5 | 6 | |
| BMI z-scorea | 0.2(–0.1 to 0.8) | 0.6(–0.2 to 1.1) | |
| HbA1c (%) | 6.9 ± 0.8 | 7.1 ± 0.8 | |
| Duration T1D (years) | 6.9 ± 5.1 | 8.2 ± 4.9 | |
| Insulin (units per kg) | 0.8 ± 0.3 | 0.7 ± 0.2 | |
| Therapy | CSII n | 10 | 7 |
| MDI n | 1 | 3 |
aPresented as median and interquartile range.
Plasma GLP-1, GIP, and glucagon after 2 meals in Study 1 (n = 11) and Study 2 (n = 10)
| Study 1 | Study 2 | |||||||
|---|---|---|---|---|---|---|---|---|
| Low protein 95 8 kJ | High protein 1874 kJ | Difference/ratio (95% CI) | P value | Low protein low fat 760 kJ | High protein high fat 2998 kJ | Difference/ratio (95% CI) | P value | |
| GLP-1 (pmol/L) | ||||||||
| AUC (pmol.hour/L)b | 56.9 ± 18.6 | 80.3 ± 16.8 | 1.44 (1.09, 1.93) | .016 | 69.5 ± 31.9 | 103 ± 26.9 | 1.61 (1.26, 2.05) | .002 |
| Peak valueb | 13.7 ± 4.1 | 20.5 ± 3.4 | 1.54 (1.25, 1.90) | .001 | 17.7 ± 11.5 | 25.9 ± 7.9 | 1.60(1.17,2.18) | .009 |
| Time to peak (min)a | 139.1 ± 91.3 | 174 ± 108.4 | 41.1(–63.6, 145.7) | .395 | 136.7 ± 68.9 | 135 ± 97.2 | 6(–50, 62) | .809 |
| GIP (pmol/L) | ||||||||
| AUC (pmol.hour/L)a | 152.3 ± 23.3 | 190.2 ± 35.7 | 43.2(19.2, 67.2) | .003 | 151.7 ± 29.4 | 258.6 ± 31 | 106.9(80.2, 133.7) | <.001 |
| Peak valueb | 40.3 ± 5.2 | 45.6 ± 8.3 | 1.14(1, 1.29) | .045 | 40.8 ± 6.8 | 68.1 ± 14.8 | 1.66(1.37, 2.01) | .000 |
| Time to peak (min)a | 111.8 ± 48.5 | 129 ± 37.5 | 16.8(-30.6, 64.2) | .441 | 66 ± 31 | 78 ± 25.3 | 12.7 (-41.4, 17.4) | .373 |
| Glucagon (pg/mL) | ||||||||
| AUC (pmol.hour/L)b | 182.8 ± 48.5 | 292.5 ± 88.1 | 1.60 (1.18, 2.16) | .007 | 137.8 ± 49.1 | 268.8 ± 97.6 | 1.95(1.62, 2.34) | <.001 |
| Peak valueb | 39.3 ± 10.6 | 68.6 ± 21.1 | 1.74 (1.29, 2.33) | .002 | 31.3 ± 10.5 | 68.3 ± 26.8 | 2.14(1.76, 2.61) | <.001 |
| Time to peak (min)a | 133.6 ± 105.1 | 180 ± 86 | 60.2(-37.9, 158.3) | .197 | 120 ± 118.3 | 195 ± 35.4 | 75(2.6, 147.4) | .044 |
Statistically significant P values are reported in bold font.
aP value calculated using linear mixed model, meal effect presented as difference between means.
bP value calculated using mixed model of log transformed outcome, meal effect presented as ratio of geometric means.
There were no differences in the baseline mean BGL prior to consumption of the test meals in Study 1 (LP 5.32 ± 0.5 mmol/L vs HP 5.23 ± 0.5 mmol/L; P = .70) (12), and Study 2 (LPLF 4.7 ± 0.3 mmol/L vs HPHF 4.8 ± 0.6 mmol/L; P = .64) (13). However, despite increased insulin requirements over the 5-hour postprandial period in Study 1 and Study 2, the meals higher in protein, with or without fat, resulted in elevated mean BGL: LP (5.68 ± 0.22 mmol/L vs HP 5.95 ± 0.29 mmol/L, P = 0.001) (12), and LPLF (5.4 ± 0.2 mmol/L vs HPHF 5.2 ± 0.2 mmol/L, P = 0.02) (13), respectively.
Glucagon-like Peptide 1
Compared with the LP meal, there was a higher AUC of GLP-1 in the HP meal (ratio = 1.45, 95% CI 1.09, 1.92, P = .016). Similarly, compared with the LPLF meal, the HPHF meal had a higher AUC of GLP-1 (ratio = 1.61, 95% CI 1.26, 2.05, P = .002). The peak GLP-1 level in the 5-hour study period was higher in the HP meal than in the LP meal (ratio = 1.54, 95% CI 1.25, 1.90, P = .001) and the HPHF meal compared with the LPLF meal (ratio = 1.60, 95% CI 1.17, 2.18, P = .009). For both Study 1 and Study 2, there was no evidence for a difference in the time to peak of GLP-1 between the meals. Figure 1A and 1B illustrates sustained increase in GLP-1 from 30 minutes onwards and no evidence of a fall in GLP-1 at the 5-hour mark in the HP and HPHF meals.
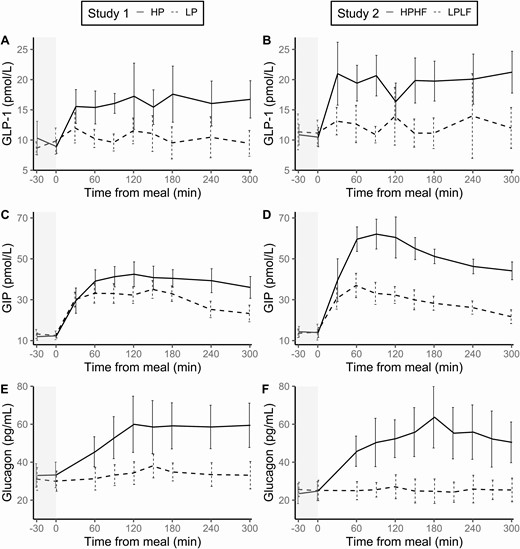
Glucoregulatory peptide hormones in response to meals (mean and standard error).
Glucose-dependent Insulinotropic Polypeptide
Compared with their respective “control” meals low in protein (LP and LPLF, respectively), the addition of protein, and protein and fat resulted in a greater GIP response over the 5 hour postprandial period. The AUC for GIP was higher with the HP meal compared to the LP meal (difference = 43.2, 95% CI 19.2, 67.2, P = .003), and with the HPHF meal compared with the LPLF meal (difference = 106.9, 95 % CI 80.2, 133.7, P < .001). A significant meal effect on peak GIP was observed with the addition of protein (HP vs LP, ratio = 1.13, 95% CI 1.00, 1.29, P = .045) and the addition of protein and fat (HPHF vs LPLF, ratio = 1.66, 95% CI 1.37, 2.01, P <.001). There were no differences in the time to peak of GIP between the 2 meals in either study.
Glucagon
In Study 1, a meal effect was observed for glucagon AUC (HP vs LP, ratio = 1.60, 95% CI 1.18, 2.16, P = .007), and the peak value reached in the postprandial period (HP vs LP, ratio = 1.74, 95% CI 1.30, 2.33, P = .002). There was, however, no difference in time to peak glucagon between the LP and HP meals (P = .197). Figure 1E illustrates the peak at 120 minutes was sustained for the remaining 3 hours of the study after the meal high in protein. In Study 2, the effect of a HPHF meal on glucagon compared with a LPLF meal was seen for AUC (ratio = 1.95, 95% CI 1.63, 2.34, P < .001), peak value (ratio = 2.14, 95% CI 1.76, 2.61, P < .001), and the time to peak (difference = 75.0, 95% CI 2.6, 147.4, P = .044).
Discussion
This study investigated the influence of meals of varying macronutrient compositions on the secretion of glucoregulatory hormones that play a key role in gastric emptying and glucose regulation, but did not measure gastric emptying directly. Our findings indicate the addition of protein, with or without fat, has a major influence on the total concentration and peak levels of GIP, GLP-1, and glucagon. A strength of the study is that postprandial euglycemia was maintained in a controlled in-clinic setting. Therefore, there was no potential confounding effect of either hyper- or hypoglycemia on the GLP-1, GIP, or glucagon responses.
In healthy individuals, GLP-1 slows gastric emptying, and inhibits the release of glucagon. However, despite an increase in GLP-1 with the addition of protein, with or without fat, there was also an increase in the total concentration and peak value for glucagon, which may contribute to delayed postprandial hyperglycemia evident in people with T1D after the consumption of foods high in protein. This may be because the glucagonostatic effect of GLP-1 is glucose-dependent, probably requiring BGL greater than 8 mmol/L (22).
The observed higher concentrations of GIP after meals higher in protein, with and without fat, support that the secretion of GIP could also contribute to glucagon stimulation. However, this response may also be glucose dependent. Accordingly, the glucagon stimulation is likely to reflect the effect of circulating amino acids. The observed effect sizes and the nonoverlapping confidence intervals between Study 1 and Study 2 for AUC and peak GIP, suggest an additional effect of fat, above and beyond the addition of protein. However this finding requires corroboration with purpose-designed research aimed at quantifying the effect of fat above and beyond protein.
The ingestion of a HP meal has been shown to increase circulating plasma glucagon in both healthy people and people with T1D (10, 23), as supported in our findings. The HP meal in Study 1 significantly increased the peak value of glucagon supporting a role for glucagon as a mechanism underlying the increased insulin requirements after the ingestion of protein (12, 13). Interestingly, the peak value of glucagon in the HPHF meal was similar to the HP meal, suggesting the addition of fat did not further stimulate glucagon secretion. Although comparisons across the studies should be interpreted with caution (particularly as data were collected from 2 different cohorts at different times and sample sizes were small), it is the first time this has been observed in children with T1D and any patterns in the data warrant further investigation. Results recently published by the authors found the same HPHF meal, discussed in the current study, required nearly twice the amount of insulin to maintain euglycemia, compared with the HP meal, suggesting different mechanisms are involved in delayed postprandial hyperglycemia (13).
Unlike GIP and GLP-1, glucagon secretion is, at least not primarily, a response to the interaction of nutrients within the small intestine. Higher glucagon levels are unlikely to be an asset, apart from potentially preventing hypoglycemia. It is a goal of diabetes management for postprandial glucose levels to return to fasting levels within 3 hours after a meal. If the glycemic effect of glucagon is sustained for at least 5 hours after a meal, there may be a role for therapies in T1D that modify glucoregulatory hormone responses. Such therapies could include GLP-1 receptor agonists or pramlintide acetate, a synthetic analogue of the polypeptide hormone amylin that is often deficient in people with T1D, to suppress glucagon secretion (24). Pramlintide can be used alongside insulin to control postprandial hyperglycemia, with evidence that infused pramlintide suppresses glucagon secretion and slows gastric emptying in adolescents with T1D (25). However, there is little evidence of the use of this therapy for mixed meals high in fat and protein causing delayed and prolonged hyperglycemia.
The influence of total dietary fat has been associated with varying rates of gastric emptying in previous studies (2, 26). The significant difference in the time required for glucagon to peak with the HPHF meal compared with the LPLF meal may relate to slower gastric emptying, highlighting the potential impact of fat on gastric emptying or the prolonged duration of gastric emptying due to the increased energy density of each meal. It should also be appreciated that, the posture of the participants in both studies, sitting in a recliner, may have resulted in a fat layer forming in the stomach, potentially slowing gastric emptying (27). Accordingly, despite gastric emptying not being measured in the present study, it clearly influences the relationship between insulin requirements and glucoregulatory hormone secretion and should be considered in interpreting our findings.
Previous studies have shown that the magnitude of the postprandial GLP-1 and GIP response has been proportionate to the energy content of the meal in healthy individuals (28). These findings are supported by our observation that the magnitude of the responses GIP and GLP-1 increased as the total energy content was greater. However, it is not possible to differentiate the effect of total energy content on glucoregulatory hormone response from that of the presence of fat or protein in our study, as the addition of fat and protein also increased the energy content of meals. If an emptying rate of 2 kcal (8.4 kJ) per minute is assumed (as a midpoint between 1 and 4 kJ per minute (5)), these meals would be emptied completely at 115, 223, 90, and 357 minutes for the LP, HP, LPLF, HPHF meals, respectively. Hence, high protein or fat will affect the duration but not necessarily the rate of emptying. This needs to be considered in interpretating our findings, noting that a difference in energy density is difficult to avoid while maintaining standardized carbohydrate content in each meal.
The present analyses were accompanied by limitations. Firstly, despite the thorough clinical study designs and controlled conditions of the 2 studies, the sample sizes did not provide adequate power to identify differences in meal effects based on demographic and clinical characteristics. A further limitation is that a meal containing the standard 30 g of carbohydrate with the addition of fat alone was not tested in either of the studies, precluding any strong conclusions being drawn regarding the influence of dietary fat alone. In addition, the test meals in each study had different fatty acid profiles from 2 different added fat sources (Study 1: extra virgin olive oil higher in monounsaturated fatty acids vs Study 2: butter higher in saturated fatty acids), compromising formal comparisons between the meals. Lastly, the 2 studies did not include a control group of healthy participants; therefore, we were unable to determine the potential impact of T1D per se on the observed responses.
We conclude that the recognized impact of fat and protein on postprandial glucose excursions may be mediated by the differential secretion of glucoregulatory hormones. Further studies are needed to better understand these mechanisms and how this knowledge may be applied to improve personalized postprandial glucose management in young people with type 1 diabetes.
Abbreviations
- AUC
area under the curve
- BGL
blood glucose level
- CV
coefficient of variation
- GIP
glucagon-dependent insulinotropic polypeptide
- GLP
glucagon-like peptide
- HP
high protein
- HP/HF
high protein/high fat
- LP
low protein
- LP/LF
low protein/low fat
- T1D
type 1 diabetes
Acknowledgements
The authors would like to thank the adolescents and young adults who participated in both studies presented in this manuscript.
Financial Support: This research was supported by the Juvenile Diabetes Research Fund (JDRF) Australian Type 1 Diabetes Clinical Research Network (4-SRA-2015-157-M-B), a special initiative of the Australian Research Council (ARC).
Author Contributions: Conceptualization, E.A.D., B.R.K., and C.E.M.S.; methodology, E.A.D., C.E.M.S., N.P., T.W.J., G.S., and B.R.K.; formal analysis, A.J.H., G.S., and S.B.; investigation, N.P., S.S., and B.R.K.; writing—original draft preparation, A.J.H and S.B.; writing—review and editing, A.J.H., S.B., M.H., C.E.M.S., S.S., N.P., E.A.D., B.R.K., G.S., and T.W.J.; project administration, C.E.M.S. and B.R.K.; funding acquisition, E.A.D.
Clinical Trial Information: Study 1: Australia New Zealand Clinical Trials registration no. ACTRN12615001127594 (registered October 26, 2015); Study 2: Australia New Zealand Clinical Trials registration no. ACTRN12616000861459p (registered October 30, 2016).
Additional Information
Disclosures: The authors declare no conflict of interest. The funders had no role in the design of the study; in the collection, analyses, or interpretation of data; in the writing of the manuscript, or in the decision to publish the results.
Data Availability
Some or all data generated or analyzed during this study are included in this published article or in the data repositories listed in References.
