


Abstract
A personalized antiplatelet therapy guided by a novel platelet function testing (PFT), PL-12, is considered an optimized treatment strategy in stable coronary artery disease (CAD) patients undergoing percutaneous coronary intervention (PCI). However, the safety and efficacy of any dual-antiplatelet therapy (DAPT) strategy may differ in relation to diabetes status.
The aim of this study was to compare the outcomes of PFT-guided personalized DAPT in stable CAD patients with and without diabetes mellitus.
The PATH-PCI trial randomly assigned 2285 stable CAD patients to either personalized antiplatelet therapy or standard antiplatelet treatment. We investigated the association and interaction of diabetes on clinical outcomes across 2 treatment groups.
We did not find a significant difference between the personalized group and the standard group in net adverse clinical events in either diabetes patients (10.3% vs 13.4%, P = .224) or in the nondiabetic group (3.1% vs 5.0%, P = .064). In diabetes patients (n = 646, 28.3%), the overall ischemic event rates were significantly low (6.8% vs 11.3%, HR = 0.586, 95% CI, 0.344-0.999, P = .049) and the bleeding event rates did not differ between the 2 groups (3.5% vs 3.3%, HR = 1.066, 95% CI, 0.462-2.458, P = .882). Similarly, in nondiabetic patients, the overall ischemic event rates were significantly low (1.8% vs 4.2%, HR = 0.428, 95% CI, 0.233-0.758, P = .006) and the bleeding event rates did not differ between the 2 groups (1.6% vs 0.9%, HR = 1.802, 95% CI: 0.719-4.516, P = .209).
The present study suggests that personalized antiplatelet therapy according to PFT can reduce ischemic events but not increase bleedings in stable CAD patients with or without diabetes who have undergone PCI.
Diabetes mellitus is a well-known risk factor for coronary artery disease (CAD) (1). Approximately 20% to 30% of CAD patients with diabetes are undergoing percutaneous coronary intervention (PCI) worldwide (2-5). Previous studies have suggested that diabetes is a strong predictor for adverse outcomes in CAD patients who have undergone PCI (6, 7). Antiplatelet therapy (DAPT) with aspirin and clopidogrel was recommended by European Society for Cardiology/European Association for Cardio-Thoracic Surgery (ESC/EACTS) guidelines as a standard therapy in stable CAD patients undergoing PCI (8). However, accumulated evidence suggests that only 60% of patients are sensitive to clopidogrel (9, 10). Therefore, personalized therapy based on platelet function testing (PFT) may be an effective measure to guarantee antiplatelet efficacy. Previously, we used a novel PFT method, PL-12, to demonstrate personalized antiplatelet therapy according to platelet aggregation rate (MAR) can significantly improve the clinical benefit after PCI (11). However, the effect of antiplatelet strategy on ischemic and bleeding outcomes may differ between diabetic and nondiabetic patients undergoing PCI. Therefore, in this substudy from the PATH-PCI trial, we aimed to assess whether patient outcomes following personalized antiplatelet treatment may differ in the setting of diabetes mellitus.
Material and Methods
Study Design and Patients
The PATH-PCI trial was a randomized, controlled, open-label trial conducted at the First Affiliated Hospital of Xinjiang Medical University (identifier: ChiCTR-INR-16010077); more details on the study design have been published previously (11). In brief, this trial enrolled 2285 patients with stable CAD. All the patients were older than 18 years who were confirmed to have CAD by coronary angiography showing that at least one coronary artery stenosis was greater than 70% or that the left main stenosis was greater than 50% amenable to PCI. We excluded patients who had acute coronary syndrome, serious heart failure, rheumatic heart disease, valvular heart disease, congenital heart disease, pulmonary heart disease, autoimmune diseases including type 1 diabetes, family hypercholesterolemia, and serious dysfunction of the liver or kidney. These patients were randomly divided into the personalized therapy group (n = 1146) and standard treatment group (n = 1139) before undergoing PCI. In the standard therapy group, the patients were administered a 75-mg/day clopidogrel maintenance dosage plus 100 mg/day of aspirin for at least 6 months after the procedure without detecting the MAR. In the personalized therapy group, the antiplatelet strategy was performed according to the MAR as described previously (11). All the patients were administrated an angiotensin-converting enzyme inhibitor (ACEI) or angiotensin II receptor blocker (ARB), β-blocker, and statins simultaneously if there were no contraindications. Coronary stenting was performed according to the standard PCI technique. The decision of predilation or direct stenting, as well as the use of glycoprotein IIb/IIIa inhibitors, was made by the operating surgeon. The patients were enrolled from December 2016 to February 2018, at the First Affiliated Hospital of Xinjiang Medical University. All patients gave written informed consent before being included in the study. Fig. 1 shows the study design and groups.
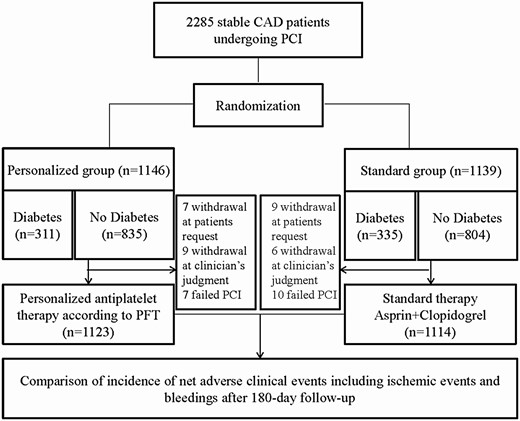
Flowchart of the PATH-PCI study. CAD, coronary artery disease; PCI, percutaneous coronary intervention.
Randomization
All the patients in this trial were administrated an additional loading dose of 300 mg of clopidogrel and a loading dose of 300 mg of aspirin before randomization. The standard techniques were used to perform all PCIs with a commercially available drug-eluting stent (DES). If necessary, the operators used intravascular ultrasound or optical coherence tomography to guide the PCIs. The operators decided whether predilation or postdilation was needed during the procedure. In addition, whether to use glycoprotein IIb/IIIa inhibitors was decided by the operator.
Definition of Diabetes
The diagnostic criteria for diabetes was a clear history of diabetes, the use of hypoglycemic agents, fasting blood glucose greater than or equal to 7.1 mmol/L, or 2-hour postload glucose greater than or equal to 11.1 mmol/L.
Platelet Function Testing
The detailed procedure of MAR detection has been described previously (11). Briefly, we collected the blood samples 12 to 24 hours after an additional loading of 300 mg of aspirin plus 300 mg of clopidogrel. A new platelet aggregation rate detection device, PL-12 (SINNOWA Co) was used to detect the MAR. The calculation of the MAR was performed according the following formula: (1 – minimum platelet count/initial platelet count) × 100%. Patients with an MAR greater than 55% were defined as having high-platelet reactivity.
Study End Points and Follow-up
The primary end point was the net clinical adverse events. The secondary end point was major adverse cardiovascular and cerebrovascular events (MACCEs), which were defined as cardiac death, myocardial infarction, stent thrombosis, urgent revascularization, stroke, and the individual components of the primary end point, bleeding events, and mortality. All the end points have been defined in accordance with the previous study (11). An independent event adjudication committee masked to the treatment assignment adjudicated all suspected clinical events. All the patients were followed-up at baseline, at 1 month, and 6 months after recruitment, by office visits or by telephone contact, as necessary, as described previously (11).
Statistical Analyses
In the present study, we used SPSS version 22.0 (SPSS Inc) to perform the statistical analyses. The continuous variables were analyzed using t test with normal distribution or the Mann-Whitney U test if nonnormal distribution was shown. We compared categorical variables using the chi-square test or Fisher exact test. We used the Kaplan-Meier analysis to assess the relation between treatment and adverse clinical outcomes. P less than .05 (2-sided) was considered statistically significant.
Results
Baseline Characteristics of the Study Patients
In the present study, for the primary and post hoc analysis presented here, the study cohort was stratified into 2 subsets according to diabetes status (diabetes vs nondiabetes; see Fig. 1).
Of the study population, 646 patients were diabetic and 1639 were nondiabetic. The baseline characteristics of the study population are presented in Table 1. Among diabetic and nondiabetic patients, there was no significant difference between the personalized group and the standard group (all P > .05). Table 2 shows the MAR results and information regarding IIb/IIIa inhibitors treatment. As shown in Table 3, the angiographic and procedural characteristics were equally distributed across study groups within the subsets of diabetic and nondiabetic patients.
Baseline characteristics of patients in the 2 groups
| Characteristics | Diabetes (n = 646) | No diabetes (n = 1639) | ||||||
|---|---|---|---|---|---|---|---|---|
| Personalized group (n = 311) | Standard group (n = 335) | t or X2 | P | Personalized group (n = 835) | Standard group (n = 804) | t or X2 | P | |
| Male sex, n (%) | 251 (80.7) | 271 (80.9) | 0.004 | .952 | 719 (86.1) | 663 (82.5) | 4.116 | .052 |
| Age, y | 58.88 ± 10.65 | 59.61 ± 9.55 | –0.912 | .362 | 58.7 ± 10.8 | 57.38 ± 10.4 | –0.167 | .867 |
| > 60 | 144 (46.3) | 157(46.9) | 0.021 | .886 | 338 (40.5) | 313 (38.9) | 0.410 | .552 |
| ≤ 60 | 167 (53.7) | 178 (53.1) | 497 (59.5) | 491 (61.1) | ||||
| Smoking, n (%) | 4.701 | .095 | 0.880 | .644 | ||||
| Never | 39 (12.95) | 27 (8.1) | 132 (15.8) | 131 (16.3) | ||||
| Previous | 95 (30.5) | 121 (36.1) | 283 (33.9) | 287 (35.7) | ||||
| Current | 177 (56.9) | 187 (55.8) | 420 (50.3) | 386 (48.0) | ||||
| Alcohol drinking, n (%) | 1.694 | .429 | 3.129 | .209 | ||||
| Never | 37 (11.9) | 31 (9.3) | 136 (16.3) | 139 (17.3) | ||||
| Previous | 80 (25.7) | 97 (29.0) | 217 (26.0) | 235 (29.2) | ||||
| Current | 194 (62.4) | 207 (61.8) | 482 (57.7) | 430 (53.5) | ||||
| Family history of CAD, n (%) | 39 (12.5) | 53 (15.08) | 1.421 | .233 | 95 (11.4) | 106 (13.2) | 1.243 | .265 |
| Hypertension, n (%) | 219 (70.4) | 256 (76.4) | 2.983 | .084 | 423 (50.7) | 401 (49.9) | 0.100 | .751 |
| Calcium channel blocker, n (%) | 16 (5.1) | 18 (5.4) | 0.017 | .897 | 27 (3.2) | 31 (3.9) | 0.465 | .496 |
| β receptor blocker, n (%) | 55 (17.7) | 74 (22.1) | 1.958 | .162 | 148 (17.7) | 119 (14.18) | 2.567 | .109 |
| ACEI or ARB, n (%) | 19 (6.1) | 17 (5.1) | 0.328 | .567 | 46 (5.5) | 40 (5.0) | 0.235 | .628 |
| Statin, n (%) | 306 (98.4) | 324 (96.7) | 1.875 | .171 | 817 (97.8) | 794 (98.8) | 2.028 | .154 |
| BUN, mmol/L | 5.79 ± 4.31 | 5.58 ± 1.85 | 0.807 | .420 | 5.60 ± 3.05 | 5.48 ± 1.54 | 1.008 | .314 |
| Cr, mmol/L | 74.60 ± 30.72 | 73.19 ± 21.47 | 0.679 | .497 | 75.3 ± 20.4 | 74.2 ± 26.2 | 0.887 | .375 |
| Uric acid, mmol/L | 320.83 ± 95.32 | 312.13 ± 87.43 | 1.211 | .226 | 328.7 ± 92.1 | 323.1 ± 90.0 | 1.253 | .211 |
| Glucose, mmol/L | 8.35 ± 3.85 | 8.23 ± 4.16 | 0.373 | .709 | 5.58 ± 2.11 | 5.68 ± 1.86 | –1.007 | .314 |
| Triglyceride, mmol/L | 2.12 ± 1.41 | 1.99 ± 1.54 | 1.114 | 0.266 | 1.81 ± 1.91 | 1.76 ± 1.18 | 0.657 | .511 |
| Total cholesterol, mmol/L | 3.80 ± 1.05 | 3.93 ± 1.87 | –1.077 | .282 | 3.89 ± 1.08 | 3.91 ± 1.08 | –0.415 | .678 |
| HDL-C, mmol/L | 1.00 ± 0.48 | 1.00 ± 0.28 | –0.124 | .901 | 1.06 ± 0.50 | 1.05 ± 0.38 | 0.504 | .614 |
| LDL-C, mmol/L | 2.37 ± 0.85 | 2.49 ± 1.00 | –1.584 | .114 | 2.48 ± 0.89 | 2.54 ± 0.92 | –1.256 | .209 |
| MAR ≥ 55%, (n, %) | 201 (64.6) | – | – | – | 519 (62.2) | – | – | – |
| IIb/IIIa inhibitors, (n, %) | 9 (2.9) | 14 (4.2) | 0.376 | .778 | 24 (2.9) | 38 (4.7) | 3.578 | .059 |
Abbreviations: ACEI, angiotensin-converting enzyme inhibitor; ARB, angiotensin II receptor blocker; BUN, blood urea nitrogen; CAD, coronary artery disease; Cr, creatinine; HDL-C, high-density lipoprotein cholesterol; LDL-C, low-density lipoprotein cholesterol; MAR, platelet aggregation rate.
Characteristics of patients in the 2 groups after randomization
| Characteristics | Diabetes (n = 646) | No diabetes (n = 1639) | ||||||
|---|---|---|---|---|---|---|---|---|
| Personalized group (n = 311) | Standard group (n = 335) | t or X2 | P | Personalized group (n = 835) | Standard group (n = 804) | t or X2 | P | |
| MAR ≥ 55%, (n, %) | 201 (64.6) | – | – | – | 519 (62.2) | – | – | – |
| IIb/IIIa inhibitors, (n, %) | 9 (2.9) | 14 (4.2) | 0.376 | 0.778 | 24 (2.9) | 38 (4.7) | 3.578 | 0.059 |
Abbreviation: MAR, platelet aggregation rate.
Baseline treatments and procedure characteristics according to treatment group
| Characteristics | Diabetes (n = 646) | No diabetes (n = 1639) | ||||||
|---|---|---|---|---|---|---|---|---|
| Personalized group (n = 311) | Standard group (n = 335) | t or X2 | P | Personalized group (n = 835) | Standard group (n = 804) | t or X2 | P | |
| Procedure time, min | 33.00 ± 9.89 | 32.40 ± 9.37 | 0.808 | .419 | 33.10 ± 12.19 | 32.52 ± 9.74 | 1.394 | .163 |
| Diameter of stents, mm | 2.82 ± 0.38 | 2.81 ± 0.39 | 0.219 | .826 | 2.85 ± 0.40 | 2.84 ± 0.37 | 0.714 | .476 |
| Length of stents, mm | 26.48 ± 6.85 | 26.28 ± 7.36 | 0.354 | .724 | 26.39 ± 6.96 | 26.45 ± 7.23 | –0.192 | .848 |
| Predilation | 287 (92.3) | 306 (91.3) | 0.189 | .664 | 777 (93.1) | 741 (92.2) | 0.474 | .491 |
| No. of target lesions | 1.66 ± 0.80 | 1.56 ± 0.79 | 1.558 | .120 | 1.60 ± 0.79 | 1.58 ± 0.80 | 0.643 | .520 |
| CTO, n (%) | 11 (3.5) | 8 (2.4) | 0.746 | .388 | 30 (3.6) | 25(3.1) | 0.295 | .587 |
| LM, n (%) | 8 (2.6) | 15 (4.5) | 1.705 | .192 | 37 (4.4) | 32 (4.0) | 0.207 | .649 |
Abbreviations: CTO, chronic total occlusion; LM, left main lesion.
Clinical End Points in Diabetes and Nondiabetes
There were 143 net clinical adverse events and 108 MACCEs reported during the 180-day follow-up period. In diabetes patients, we did not find a significant difference between the personalized group and the standard group in the incidence of net clinical adverse events (10.3% vs 13.4%, P = .224). There were 21 MACCEs (6.8%) in the personalized group and 38 MACCEs (11.3%) in the standard group (Fig. 2, Table 4). We also found the incidence of MACE was decreased in the personalized group compared to the standard group (4.5% vs 8.4%, P = .049). In addition, the incidence of stent thrombosis was significant decreased in the personalized group compared to the standard group (0.6% vs 3.0%, P = .046). Consistently, no difference was found in other secondary end point among diabetic patients (see Table 3).
Primary and secondary end points of following up for 180 days
| End points | Diabetes (n = 646) | No diabetes (n = 1639) | ||||||
|---|---|---|---|---|---|---|---|---|
| Personalized group (n = 311) | Standard group (n = 335) | Hazard ratio (95% CI) | P | Personalized group (n = 835) | Standard group (n = 804) | Hazard ratio (95% CI) | P | |
| Net clinical adverse event | 32 (10.3) | 45 (13.4) | 0.755 (0.480-1.188) | .224 | 26 (3.1) | 40 (5.0) | 0.630 (0.385-1.033) | .067 |
| MACCEs | 21 (6.8) | 38 (11.3) | 0.586 (0.344-0.999) | .049 | 15 (1.8) | 34 (4.2) | 0.428 (0.233-0.758) | .006 |
| MACEs | 14 (4.5) | 28 (8.4) | 0.530 (0.279-0.999) | .049 | 12 (1.4) | 25 (3.1) | 0.464 (0.233-0.924) | .029 |
| All-cause death | 6 (1.9) | 12 (3.6) | 0.531 (0.199-1.415) | .206 | 11 (1.3) | 6 (0.7) | 1.787 (0.661-4.832) | .253 |
| Cardiac death | 3 (1.0) | 10 (3.0) | 0.319 (0.088-1.159) | .083 | 4(0.5) | 2 (0.2) | 1.947 (0.357-10.670) | .442 |
| ST | 2 (0.6) | 10 (3.0) | 0.213 (0.041-0.947) | .046 | 3 (0.4) | 5 (0.6) | 0.579 (0.138-2.243) | .454 |
| MIa | 12 (3.9) | 14 (4.2) | 0.907 (0.420-1.961) | .804 | 8 (1.0) | 18 (2.2) | 0.430 (0.187-0.989) | .047 |
| Stroke | 7 (2.3) | 10 (3.0) | 0.742 (0.282-1.949) | .545 | 3 (0.4) | 9 (1.1) | 0.326 (0.088-1.203) | .093 |
| Urgent revascularization | 1 (0.3) | 8 (2.4) | 0.133 (0.017-1.062) | .057 | 3 (0.4) | 7 (0.9) | 0.413 (0.107-0.598) | .200 |
| Major bleeding | 11 (3.5) | 11 (3.3) | 1.066 (0.462-2.458) | .882 | 13 (1.6) | 7 (0.9) | 1.802 (0.719-4.516) | .209 |
Abbreviations: MACEs, major adverse cardiovascular events: cardiac death, MI, ST, or urgent revascularization; MACCEs, major adverse cardiovascular and cerebrovascular events: cardiac death, MI, ST, stroke, or urgent revascularization; MI, myocardial infarction; ST, stent thrombosis; TIA, transient ischemic attack.
aDefinition according to the Third Universal Definition of MI (UDMI), published in 2012 (12).
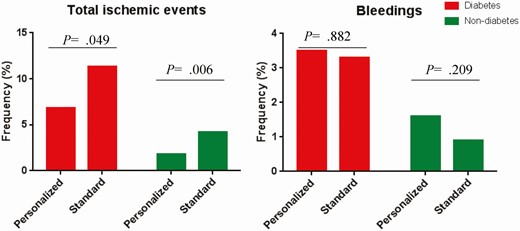
Bar charts for the percentage of patients with ischemic events and bleeding events according to diabetes subgroup.
In nondiabetic patients, we found a marginal difference between the personalized group and the standard group in the incidence of net clinical adverse events (3.1% vs 5.0%, P = .064).The incidence of MACCEs was lower in the personalized group compared to the standard group (P = .006; see Fig. 2Table 4). We also found the incidence of MACE was significantly decreased in the personalized group compared to that in the standard group (1.4% vs 3.1%, P = .029). However, we did not find a significant difference between the personalized group and the standard group in the secondary end point (see Table 4).
The results of the Cox proportional hazards model demonstrated that there were increased adverse event-free survival rates in the personalized group compared with the standard group both in the diabetic patients (Fig. 3) and the nondiabetic patients (Fig. 4).
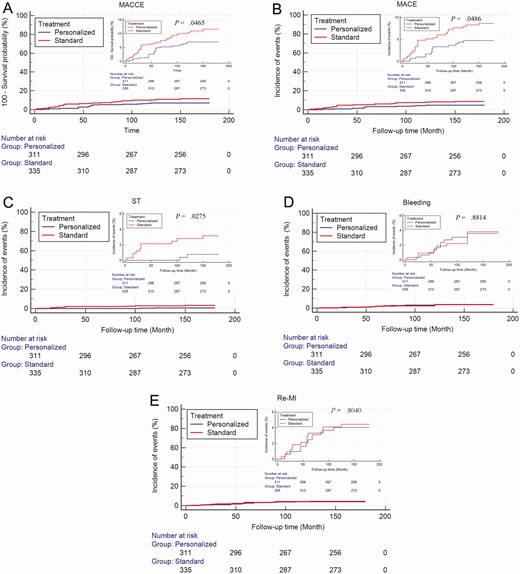
Cumulative Kaplan-Meier estimates of the time to the first adjudicated occurrence of ischemic events and major bleeding end points in diabetic patients. A, Major adverse cardiovascular and cerebrovascular events (MACCE); B, major adverse cardiovascular events (MACE); C, stent thrombosis; D, bleeding events; E, recurrent myocardial infarction.
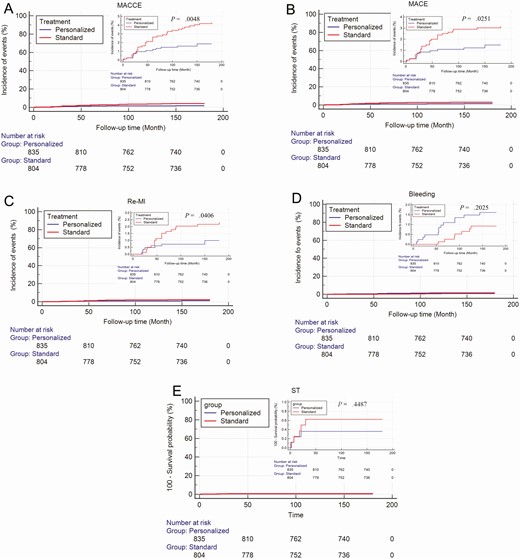
Cumulative Kaplan-Meier estimates of the time to the first adjudicated occurrence of ischemic events and major bleeding end points in non-diabetic patients. A, Major adverse cardiovascular and cerebrovascular events (MACCE); B, major adverse cardiovascular events (MACE); C, recurrent myocardial infarction; D, bleeding events; E, stent thrombosis.
Discussion
Diabetes is a major determinant and risk factor for cardiovascular morbidity and mortality. In the present study, we found personalized therapy according to MAR detected using PL-12 reduced ischemic events but not increased bleeding events in diabetic patients or in nondiabetic patients.
Previous studies suggested that the incidence of adverse cardiovascular events in diabetic patients after PCI is significantly increased compared to that in nondiabetic patients. In large, pooled, randomized trials, diabetes was identified as an independent predictor of adverse outcomes including MACE, cardiac death, and myocardial infarction after PCI (13). The authors of the GLOBAL LEADERS study researched the outcomes and the effect of different antiplatelet strategies in diabetic patients undergoing contemporary PCI worldwide. The authors found diabetic patients had a significantly higher risk of ischemic events after contemporary PCI (6). Escaned et al (14) suggested guideline-directed optimal pharmacotherapy has improved the outcomes of PCI both in diabetic and in nondiabetic patients. Compared to nondiabetic patients, diabetic patients are at higher risk of ischemic events and similar bleeding risk after PCI. Therefore, diabetic patients should be given diabetic-specific antiplatelet regimens (15). Previous studies demonstrated that the platelet aggregation function is significantly increased in diabetic patients (16).This may explain the increased incidence of MACE in diabetic patients. In our study, we found the MAR was significantly increased in diabetic patients compared to that in nondiabetic patients. Simultaneously, in our study, we also found the incidence of total ischemic events was significantly increased in diabetic patients compared to that in nondiabetic patients. Our results were in line with the previous study (16).
The mechanisms of increased risk for ischemic events after PCI in diabetic patients may include a greater burden of atherosclerotic disease and chronic inflammation (17). In addition, hyperglycemia itself is also an important risk factor for poor clinical outcomes in patients with CAD (18). Therefore, optimized antiplatelet therapy should be performed in diabetic patients. In the previous study, we reported personalized therapy according to MAR can improve the outcomes. In the present study, we observed whether diabetes can affect personalized therapy according to MAR. We found that personalized therapy improved clinical outcomes significantly compared to standard antiplatelet therapy both in diabetic and nondiabetic patients. In the personalized group, the patients with an MAR greater than 55% received ticagrelor. In the present study, there were 702 patients who received ticagrelor after platelet function testing, which has been reported in a previous publication (11). A large cohort including 11 154 patients with a previous PCI showed that ticagrelor plus aspirin reduced ischemic events in patients with type 2 diabetes (19). Several clinical studies demonstrated that ticagrelor was more potent and provided consistent platelet inhibition as well as improved clinical outcomes compared with clopidogrel (20-25). Liu et al (26) compared the antiplatelet effect between ticagrelor and clopidogrel and found ticagrelor achieved greater peak and trough platelet inhibition than did clopidogrel in diabetic patients after PCI for stable CAD. All these results were in line with the results in our study.
In the present study, the group of nondiabetic CAD patients constituted the majority (~ 70%) of enrolled individuals. In this large subset, we also demonstrated that personalized therapy significantly improved the outcomes. In addition, we did not find bleeding events increased in the personalized group, not only in diabetic patients but also in nondiabetic patients. Of note, reflecting the smaller sample size of the diabetic subgroup, such associations within a certain subset of patients would require investigations in larger cohorts of CAD patients. Furthermore, this emphasizes that further studies are needed that should include various approaches of treatment. In the future, platelet reactivity monitoring will probably be widely used to tailor antiplatelet therapy in CAD patients with or without diabetes. With an increasing number of antiplatelet agents available in clinical practice, cardiologists will have the opportunity to tailor therapy according to PFT and patients’ clinical characteristics.
Limitations
The PATH-PCI trial was a single-center clinical trial and the subgroup of diabetic patients in this trial was relatively small, which may lead to broader CIs for the studied combined and individual end points. Therefore, further studies with multicenter and large sample clinical trial are certainly warranted.
Conclusion
Impact on daily practice
Personalized antiplatelet strategy is an important measure to improve the clinical outcomes of CAD patients who have undergone PCI. However, in daily practice, the clinical characteristics of patients are different, and it is unclear whether the effect of personalized antiplatelet therapy is consistent in different populations. In the present study, we found personalized antiplatelet therapy according to PFT can reduce ischemic events but not increase bleeding in stable CAD patients with or without diabetes who have undergone PCI. With an increasing number of antiplatelet agents available in clinical practice, cardiologists will have the opportunity to tailor therapy according to PFT and patients’ clinical characteristics. The present study suggests that personalized antiplatelet therapy according to PFT can reduce ischemic events but not increase bleeding in stable CAD patients with or without diabetes who have undergone PCI.
Abbreviations
- ACEI
angiotensin-converting enzyme inhibitor
- ARB
angiotensin II receptor blocker
- CAD
coronary artery disease
- DAPT
dual-antiplatelet therapy
- DES
drug-eluting stent
- EACTS
European Association for Cardio-Thoracic Surgery
- ESC
European Society for Cardiology
- MACCE
major adverse cardiovascular and cerebrovascular events
- MACE
major adverse cardiovascular events
- MAR
platelet aggregation rate
- PCI
percutaneous coronary intervention
- PFT
platelet function testing
Acknowledgments
The authors acknowledge all nurses and doctors in the Heart Centre of the First Affiliated Hospital of Xinjiang Medical University. In addition, we acknowledge all donors of blood samples.
The ethics committee or review committee of the First Affiliated Hospital of Xinjiang Medical University approved the research protocol. Because the study was a retrospective cohort study based on real-world situations, there was no need to obtain informed consent from patients.
This manuscript has not been published or presented elsewhere in part or in entirety and is not under consideration by another journal. Informed consents from patients were obtained, and the study protocol was approved by the appropriate ethics review board.
Financial Support: This work was supported by the National Natural Science Foundation of China (grant No. 81770235) and the National 13th Five-Year Key R&D Project (grant No. 2016YFC1301303, 2016YFC1301304).
Author Contributions: Y.Y.Z. and T.T.W. made substantial contributions to the study conception and design and to the drafting and critical revision of the manuscript for important intellectual content. Y.N.Y., Y.Y., X.M.L., Y.C., X.M., and X.G.H. made substantial contributions to the study conception and design and to the critical revision of the manuscript for important intellectual content. X.X., J.Y.Z., and Y.T.M. made substantial contributions to the study conception and design and to the drafting and critical revision of the manuscript for important intellectual content, including study supervision. All authors agreed to the publication of this work.
Additional Information
Disclosures: The authors have nothing to disclose.
Data Availability
Due to confidentiality policies, data will not be shared.
References
Author notes
Y.Y.Z. and T.T.W. contributed equally to this work.
