


Abstract
Improved strategies to identify persons at high risk of type 2 diabetes are important to target costly preventive efforts to those who will benefit most.
This work aimed to assess whether novel biomarkers improve the prediction of type 2 diabetes beyond noninvasive standard clinical risk factors alone or in combination with glycated hemoglobin A1c (HbA1c).
We used a population-based case-cohort study for discovery (689 incident cases and 1850 noncases) and an independent cohort study (262 incident cases, 2549 noncases) for validation. An L1-penalized (lasso) Cox model was used to select the most predictive set among 47 serum biomarkers from multiple etiological pathways. All variables available from the noninvasive German Diabetes Risk Score (GDRSadapted) were forced into the models. The C index and the category-free net reclassification index (cfNRI) were used to evaluate the predictive performance of the selected biomarkers beyond the GDRSadapted model (plus HbA1c).
Interleukin-1 receptor antagonist, insulin-like growth factor binding protein 2, soluble E-selectin, decorin, adiponectin, and high-density lipoprotein cholesterol were selected as the most relevant biomarkers. The simultaneous addition of these 6 biomarkers significantly improved the predictive performance both in the discovery (C index [95% CI], 0.053 [0.039-0.066]; cfNRI [95% CI], 67.4% [57.3%-79.5%]) and the validation study (0.034 [0.019-0.053]; 48.4% [35.6%-60.8%]). Significant improvements by these biomarkers were also seen on top of the GDRSadapted model plus HbA1c in both studies.
The addition of 6 biomarkers significantly improved the prediction of type 2 diabetes when added to a noninvasive clinical model or to a clinical model plus HbA1c.
The onset of type 2 diabetes can be delayed or prevented by lifestyle or pharmacologic interventions (1). Therefore, improved strategies to identify individuals at high risk of type 2 diabetes are important to target costly measures to those who will benefit most. To date, a number of prediction models have been developed based on major clinical risk factors for type 2 diabetes (2). Although some of these models, for instance the German Diabetes Risk Score (GDRS), have already been incorporated into clinical prevention guidelines (3, 4), there is no universally accepted prediction model and the performance is only moderate (5). During recent years, attempts have been made to improve available prediction algorithms by novel biomarkers for type 2 diabetes such as proteins, metabolites, or lipids (6-16). Although some studies yielded promising first results (6, 7, 11-13, 15, 16), other studies did not observe any improvement of type 2 diabetes risk prediction and a recent review concluded that the utility of most biomarkers associated with type 2 diabetes remains largely unknown in clinical prediction (17).
Therefore, we aimed to further elucidate the potential of novel biomarkers for improved type 2 diabetes prediction. Specifically, the objective of the present study was to assess whether any single novel biomarker or a combination of several biomarkers, selected among a set of 47 biomarkers from multiple etiological pathways, improves type 2 diabetes prediction beyond the noninvasive clinical variables contained in the GDRS and beyond the GDRS variables plus glycated hemoglobin A1c (HbA1c). We used a large population-based case-cohort study to identify the most predictive set of biomarkers and validated the best predictors in an independent cohort study.
Materials and Methods
Study populations
As the discovery sample, we used data from a prospective case-cohort study embedded within the Monitoring of Trends and Determinants in Cardiovascular Diseases/Cooperative Health Research in the Region of Augsburg (MONICA/KORA) study. The original cohort study has been built on 3 independent cross-sectional population-based surveys, S1 to S3, conducted between 1984 and 1995 in Augsburg and 2 adjacent counties in Southern Germany. Altogether, 13 427 participants (6725 men, 6702 women) aged 25 to 64 (S1) or 74 (S2 and S3) years were investigated at baseline (7).
For validation, we used data from the population-based KORA S4 cohort study. The baseline examination was conducted from 1999 to 2001 in the same study region as the MONICA/KORA case-cohort study. In total 4261 men and women out of 6417 eligible individuals aged 25 to 74 years participated at baseline (18).
For the present analyses, we excluded individuals younger than 35 years, those with missing blood samples, individuals who withdrew their consent, those with prevalent diabetes, and individuals without diabetes follow-up information or self-reported other incident diabetes types than type 2, or with an observation time of less than 1 year in both studies (Supplementary Figure S1) (19). The follow-up period was restricted to a maximum of 14 years (MONICA/KORA case-cohort study: median: 14.0, 25th percentile: 11.2, 75th percentile: 14.0 years; KORA S4 cohort study: median: 14.0, 25th percentile: 11.7, 75th percentile: 14.0) because the maximum follow-up time for the S3 participants was 14 to 15 years. The final discovery case-cohort study included a randomly drawn subcohort of 1991 participants, including 141 individuals with incident type 2 diabetes and an additional 548 incident cases from the full cohort of interest (n = 8469), yielding a total of 689 incident cases and 1850 noncases. The final validation cohort study included a total of 262 incident cases and 2549 noncases.
Informed consent was provided by all participants, and the ethics committee of the Bavarian Chamber of Physicians approved the study protocols. The studies comply with the principles outlined in the Declaration of Helsinki.
Assessment of prevalent and incident type 2 diabetes
Prevalent or incident type 2 diabetes was defined as self-reported, clinically diagnosed diabetes that could be validated by the responsible physician or medical chart review, or by self-reported use of glucose-lowering medication. To assess incidence, follow-up questionnaires were sent to all MONICA/KORA S1 to S3 study participants in 1997 to 1998, 2002 to 2003, and 2008 to 2009. Additionally, all participants from S1 were invited to participate in a follow-up examination conducted in 1987 to 1988. For incident cases, the self-reported date of diagnosis was assessed and generally verified by contacting the treating physician or by medical chart review. Information on date of diagnosis was used to calculate follow-up times employed in the survival analyses as described later. Similar procedures were applied in the KORA S4 cohort study with follow-up questionnaires sent out in 2008 to 2009 and 2016. In addition, 2 follow-up examinations were conducted in 2006 to 2008 and 2013 to 2014. Changes in the diagnostic criteria for type 2 diabetes during the follow-up period could have had an impact on the classification of cases. The greatest changes occurred around 1999 when the World Health Organization lowered the cut point for the diagnosis of diabetes based on fasting glucose from 140 mg/dL or greater to 126 mg/dL or greater (20). Measurement of HbA1c has become more important during recent years, but in Germany is not generally recommended as a single measure for a clinical diagnosis because of the lack of standardization and a number of other potential influencing factors (4).
Assessment of type 2 diabetes risk factors used for benchmarking
Sociodemographic, clinical, and lifestyle parameters, as well as parental history of diabetes, were assessed as previously described (18, 21). As a benchmark clinical model, we used a model fitted to the MONICA/KORA case-cohort study, which included all available variables contained in the updated GDRS (3) with some adaptations because of limited data availability. In our GDRSadapted model, we used body mass index (BMI) (continuous) and sex to replace waist circumference and height. History of hypertension was defined based on blood pressure measurements (≥ 140/90 mm Hg) or self-reported use of antihypertensive medication, given that the participants were aware of having hypertension. Information on physical activity included time spent on sports activities during the summer and winter, but not on biking and gardening as in the original GDRS, and was coded into 2 categories as active and inactive (21) instead of hours per week. Smoking status was categorized into 5 categories as in the original GDRS (never, former < 20 cigarettes/day, former ≥ 20 cigarettes/day, current < 20 cigarettes/day, current ≥ 20 cigarettes/day). Coffee consumption was assessed as cups per day instead of per 150 g/day. Intake of red meat as well as whole-grain bread and muesli (original variables per 150 and 50 g/day, respectively) were assessed by a food frequency questionnaire and analyzed as frequency of daily intake. Parental history of diabetes was classified into 4 categories: both parents with diabetes, one parent with diabetes, unknown parental diabetes status, and no parental history. We included the additional category “unknown” because previous analyses had shown that this group incorporates a higher type 2 diabetes risk, separately from the category “no parental history” (13). Sibling history of diabetes, which was included as a separate variable in the original GDRS, was not available in the MONICA/KORA database. Our GDRSadapted model in addition included a survey indicator to take into account that the MONICA/KORA case-cohort data were derived from 3 surveys conducted 5 years apart.
HbA1c was measured using the turbidimetric inhibition immunoassay Tina-Quant HBA1C in the MONICA S3 study (Boehringer Mannheim) and the Tina-Quant HBA1C II in the KORA S4 study (Roche Diagnostics) on Hitachi 717 instruments.
Biomarker measurements
Nonfasting venous blood samples were collected while sitting at baseline. Details regarding sample handling have been previously described (22). High-density lipoprotein (HDL) cholesterol, total cholesterol, and uric acid were measured in fresh serum. All other 44 biomarkers were measured in serum stored at –80 °C until analysis. The biomarkers were selected for their potential importance for either type 2 diabetes or coronary heart disease pathophysiology based on prior knowledge from experimental and epidemiological studies.
In the MONICA/KORA case-cohort study, on average 16% of the biomarker data were missing. To enable unbiased analyses and to use the available data most efficiently, missing biomarkers and covariates were replaced using 20-fold multiple imputation by chained equations (MICE) (R version 3.2.3 and R package MICE version 2.25) (23, 24). Owing to the small number of missing values in the KORA S4 cohort, participants with missing values were excluded from the S4 analyses (Supplementary Figure S1) (19).
Biomarker measurements with a right-skewed distribution were ln-transformed and all biomarkers were (0,1)-standardized. Measurement methods, coefficients of variation, proportions of missing values before imputation, and decisions on ln-transformations are described in Supplementary Table S1 for all 47 biomarkers (19).
Statistical analysis
Descriptive analyses of baseline characteristics were computed for cases and noncases separately. For the case-cohort study, weighting was incorporated using the survey- and sex-specific sampling weights to account for the design. Multiple results of the 20 imputations were summed up as medians for percentiles and arithmetic means for proportions. Correlations between the age-, sex-, and survey-adjusted biomarker residuals were investigated in the subcohort of the MONICA/KORA case-cohort study and the KORA S4 cohort study by Pearson's coefficients. Fisher's Z transformation and retransformation was used to compute average correlation coefficients over the 20 imputed data sets in the subcohort (22).
To assess the association of different biomarkers with incident type 2 diabetes, Cox proportional hazard regression was applied. For the case-cohort design, correction of the variance estimation based on the sampling weights was required. To yield robust SE estimates for the parameter estimates, correction was made using the method by Barlow (25). Incorporation of the additional variation due to imputation was performed using Rubin’s rules for multiple imputation (26). The Cox models were adjusted for (1) age, sex, BMI, and survey, and (2) all variables from the GDRSadapted model described earlier. Results are presented as hazard ratios (HRs) together with their 95% CI per SD. Correction for multiple testing was performed using Bonferroni adjustment to control for the familywise error rate.
Selection of biomarkers for prediction modeling was conducted with L1-penalized (lasso) estimation in Cox proportional hazard models (27) adapted for the case-cohort design. Penalization was applied only to biomarkers, whereas GDRSadapted variables were kept unpenalized to force them into the model. A pipeline similar to Laimighofer et al (28) but tailored to the case-cohort design was used, with an inner cross-validation to determine the optimal number of features within the training data sets (Supplementary Figure S2) (19). The biomarkers were ranked with respect to first occurrence on the lasso path. The selection frequency among 100 bootstrap training-test samples revealed the final set of most predictive biomarkers composed of all biomarkers with a selection frequency of 20% or greater. To yield more parsimonious models, the 1SE rule (29) was extended to a 2SE model after evaluating parsimony-performance trade-off between different degrees of SE ranges (1SE, 2SE, ..., 5SE) and the best performing model (0SE).
The accuracy of the different models to assess 14-year event risk was evaluated by 2 performance measures: (1) the C index and accordingly the difference between the baseline and the biomarker-extended C indices (ΔC index) (30, 31); (2) the category-free net reclassification index (cfNRI) overall and calculated separately for cases and noncases (32). Parameters of model accuracy were calculated for the GDRSadapted model in both studies and for the GDRSadapted model plus HbA1c in the validation KORA S4 cohort.
Performance measures in the MONICA/KORA case-cohort study were calculated applying methods appropriate for survival data and case-cohort design (32, 33). To yield valid estimates, 1000 bootstrap samples were drawn from the original case-cohort study and missing values were separately imputed in each sample using MICE as described for the original sample discussed earlier. A bootstrap-based approach by Jiang et al (34, 35) was used to calculate 95% CI.
Performance measures in the validation data set of the KORA S4 cohort study were calculated based on the prognostic index derived from the case-cohort data (see Supplementary Material [19]). For models including HbA1c (measured in S3 and S4 only, coded as a continuous variable), a revised prediction model, adding an S3-derived prediction estimate for this new variable to the GDRSadapted prediction estimates from the full case-cohort study (S1-S3), was calculated according to van Houwelingen (36). Methods appropriate for survival data were used, including calculations of 95% CI via bootstrap percentile CIs of 1000 samples. Receiver operating characteristic curves were used to visualize the performance of model predictions in S4.
For all analyses, test results with 2-sided P values less than .05 were considered statistically significant. Most statistical analyses were performed with SAS (version 9.4, SAS Institute Inc) and R (version 3.6.1) using the packages metafor, survival, and glmnet for biomarker selection and graphics. Calculations of performance measures were implemented using SAS macros by Cook et al (37).
Results
Baseline characteristics
Baseline characteristics including the HbA1c of both study populations stratified by incident type 2 diabetes status at follow-up are shown in Table 1. For BMI, hypertension, parental history of diabetes, and physical activity, we observed the expected differences between incident cases and noncases. Smoking status, meat, and whole-grain bread/muesli as well as coffee consumption were similar between the 2 groups in both studies.
Baseline characteristics of type 2 diabetes cases and noncases in the discovery MONICA/KORA case-cohort study and the validation KORA S4 cohort study
| Characteristics at baseline | MONICA/KORA case-cohort study | KORA S4 cohort study | ||
|---|---|---|---|---|
| Type 2 diabetes cases n = 689 | Noncases n = 1850 | Type 2 diabetes cases n = 262 | Noncases n = 2549 | |
| Male, % | 57.0 | 48.2 | 58.8 | 47.8 |
| Age, y | 57 (50; 64) | 51 (43; 60) | 58.0 (50; 65) | 52.0 (43; 62) |
| Survey 1, % | 23.8 | 30.2 | – | – |
| Survey 2, % | 40.3 | 36.0 | – | – |
| Survey 3, % | 35.8 | 33.8 | – | – |
| Survey 4, % | – | – | 100.0 | 100.0 |
| Clinical factors | ||||
| BMI, kg/m2 | 29.5 (27.2; 32.7) | 26.3 (24.0; 29.1) | 30.2 (28.0; 33.5) | 26.6 (24.1; 29.5) |
| Hypertensiona, % | 66.5 | 39.9 | 66.4 | 38.1 |
| Parental history DM, % | ||||
| No | 45.9 | 60.1 | 51.5 | 63.7 |
| Unknown | 25.8 | 20.6 | 14.5 | 13.9 |
| Yes, one parent | 25.5 | 18.0 | 31.7 | 20.6 |
| Yes, both parents | 2.8 | 1.3 | 2.3 | 1.8 |
| Lifestyle factors | ||||
| Physically active, % | 29.8 | 40.0 | 37.0 | 50.0 |
| Smoking status, No. cig./d, % | ||||
| Never | 42.1 | 48.0 | 45.4 | 43.4 |
| Former, < 20 | 17.0 | 16.0 | 15.3 | 18.3 |
| Former, ≥ 20 | 14.7 | 11.8 | 21.0 | 14.5 |
| Current, < 20 | 13.1 | 13.9 | 11.5 | 14.7 |
| Current, ≥ 20 | 13.2 | 10.2 | 6.9 | 9.1 |
| Meat, freq./d | 0.5 (0.5; 1.0) | 0.5 (0.5; 0.5) | 0.5 (0.5; 0.5) | 0.5 (0.1; 0.5) |
| Whole-grain bread/muesli, freq./d | 1.0 (0.1; 1.0) | 1.0 (0.5; 1.0) | 0.6 (0.2; 1.0) | 0.6 (0.3; 1.0) |
| Coffee, cups/d | 2.0 (1.0; 4.0) | 2.0 (1.0; 4.0) | 2.0 (1.0; 4.0) | 3.0 (2.0; 4.0) |
| HbA1c, mmol/mol | 35.5 (32.2; 39.9) | 32.2 (30.1; 36.6) | 39.9 (36.6; 42.1) | 36.6 (34.4; 38.8) |
| HbA1c, %b | 5.4 (5.1; 5.8) | 5.1 (4.9; 5.5) | 5.8 (5.5; 6.0) | 5.5 (5.3; 5.7) |
| Selected biomarkersc | ||||
| IL-1RA, pg/mL | 440.5 (343.1; 582.0) | 330.3 (269.9; 427.0) | 522.5 (377.0; 710.0) | 409.0 (303.0; 558.0) |
| IGFBP-2, ng/mL | 39.8 (25.8; 62.8) | 62.9 (38.9; 97.0) | 132.8 (93.4; 186.7) | 189.4 (137.0; 261.8) |
| sE-selectin, ng/mL | 64.9 (48.6; 85.0) | 51.0 (37.2; 65.9) | 31.5 (23.3; 44.8) | 27.0 (19.2; 35.3) |
| Adiponectin, µg/mL | 9.5 (7.2; 12.0) | 11.6 (8.9; 15.0) | 4.6 (3.2; 7.6) | 6.7 (4.4; 10.1) |
| HDL cholesterol, mg/dL | 46.6 (39.1; 56.5) | 55.3 (45.8; 67.0) | 49.5 (40.7; 60.1) | 57.1 (46.2; 69.5) |
| Decorin, ng/mL | 13.9 (12.3; 15.7) | 12.9 (11.5; 14.5) | 5.2 (4.7; 6.0) | 4.9 (4.3; 5.5) |
Categorical variables are presented as proportions and continuous variables as medians (25th percentile; 75th percentile).
Abbreviations: BMI, body mass index; cig, cigarettes; DM, diabetes mellitus; freq., frequency; HbA1c, glycated hemoglobin A1c, HDL, high-density lipoprotein; IGFBP-2, insulin-like growth factor binding protein 2; IL-1RA, interleukin-1 receptor antagonist; MONICA/KORA, Monitoring of Trends and Determinants in Cardiovascular Diseases/Cooperative Health Research in the Region of Augsburg; sE-selectin, soluble E-selectin.
aSystolic/diastolic blood pressure greater than or equal to 140/90 mm Hg or medically treated known hypertension.
bHbA1c was available only for S3 in the MONICA/KORA case-cohort study (ncases = 240, nnoncases = 438).
cThe unadjusted baseline values of all 47 biomarkers are shown in Table S2 separately for incident type 2 diabetes cases and noncases.
Median (25th; 75th percentiles) levels of the 47 biomarkers measured in the MONICA/KORA case-cohort study are shown in Supplementary Table S2 for the total study population and stratified by sex (19). Pairwise Pearson correlation coefficients between the biomarkers ranged from –0.44 to 0.75 (Supplementary Figure S3) (19).
Associations of single biomarkers with incident type 2 diabetes
In Cox proportional hazards models adjusted for the GDRSadapted variables, out of the 47 examined biomarkers, 6 biomarkers (insulin-like growth factor binding protein 2 [IGFBP-2], adiponectin, sex hormone binding globulin [SHBG], HDL cholesterol, N-terminal pro B-type natriuretic peptide [NT-proBNP], osteopontin [OPN]) were significantly inversely and another 16 biomarkers (tissue plasminogen activator [tPA], soluble E-selectin [sE-selectin], interleukin-1 receptor antagonist [IL-1RA], leptin, decorin, oxidized LDL [ox-LDL], uric acid, ferritin, vascular endothelial growth factor receptor 2 [VEGF-R2], soluble intercellular adhesion molecule-1 [sICAM-1], interleukin-18 [IL-18], C-reactive protein [CRP], interleukin-6 [IL-6], C3b, fetuin-A, heat shock protein 70 [Hsp70]) were significantly positively associated with incident type 2 diabetes (Supplementary Figure S4) (19) in the MONICA/KORA case-cohort study. After correction for multiple testing, IGFBP-2, adiponectin, SHBG, and HDL cholesterol remained inversely and tPA, sE-selectin, IL-1RA, leptin, decorin, ox-LDL, uric acid, and VEGF-R2 remained positively associated with incident type 2 diabetes. HRs with 95% CI for age-, sex-, survey-, and BMI-adjusted models are shown in Supplementary Table S3 (19).
Prediction of type 2 diabetes
Using a feature selection approach with the GDRSadapted variables as fixed variables, IL-1RA, IGFBP-2, sE-selectin, adiponectin, HDL cholesterol, and decorin were identified as the most important biomarkers for type 2 diabetes prediction (Supplementary Figure S5) (19) in the discovery MONICA/KORA case-cohort study. These 6 biomarkers were measured in the KORA S4 cohort study for validation.
Median (25th; 75th percentiles) concentrations of the 6 selected biomarkers are shown in Table 1 for both study populations. Absolute values of all markers except for HDL cholesterol varied between the 2 study populations because of different laboratory methods and the lack of standardization of different assays. Therefore, biomarker concentrations were standardized to compare results between studies.
As shown in Fig. 1, the associations with incident type 2 diabetes in the KORA S4 validation study were similar to the results in the discovery study for the 3 inversely associated markers (IGFBP-2, adiponectin, and HDL cholesterol) but were weaker, albeit statistically significant, for the 3 positively associated markers (sE-selectin, IL-1RA, and decorin) after controlling for GDRSadapted risk factors.
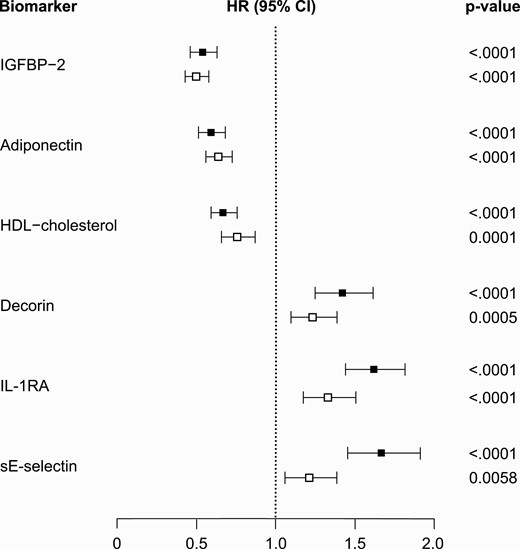
Black squares: Monitoring of Trends and Determinants in Cardiovascular Diseases/Cooperative Health Research in the Region of Augsburg (MONICA/KORA) case-cohort study. White squares: KORA S4 cohort study. Hazard ratios (HRs) are adjusted for the adapted German Diabetes Risk Score variables (age, sex, body mass index, survey, hypertension, physical activity, smoking status, coffee consumption, red meat consumption, whole-grain bread/muesli consumption, parental history of diabetes). The biomarkers are sorted by size of HR estimates in the MONICA/KORA case-cohort study.
In the discovery study, the basic GDRSadapted model predicted 14-year risk of type 2 diabetes reasonably well (C index [95% CI], 0.775 [0.755-0.790]). All 6 selected biomarkers individually significantly improved the C index on top of the GDRSadapted model (Table 2). The Δ of the C indices ranged from 0.010 for decorin to 0.024 for IL-1RA. In combination, the 6 biomarkers strongly improved the Δ of C indices by 0.053 (0.039-0.066) (see Table 2). The overall cfNRI and the cfNRI calculated separately in cases and noncases were also significantly improved by all 6 biomarkers when they were individually added to the GDRSadapted model. The cfNRI, which describes the proportion of individuals for whom the change in calculated risk was in the desired direction (higher for cases, lower for noncases), ranged from 19.4% for decorin to 43.2% for IL-1RA. CfNRI improvements were seen both in cases and noncases, with stronger improvements in the cases. The simultaneous addition of all 6 biomarkers to the GDRSadapted model improved the cfNRI by 67.4% overall and by 43.9% and 23.5% in cases and noncases, respectively (see Table 2). Supplementary Table S4 shows the C index and the Δ of the C indices for all 47 biomarkers (19).
Predictive performance of novel single biomarkers and their combination in predicting risk of type 2 diabetes on top of the adapted German Diabetes Risk Score (GDRSadapted) model in the MONICA/KORA case-cohort study and on top of the GDRSadapted and the GDRSadapted + glycated hemoglobin A1c model in the KORA S4 cohort study
| C index (95% CI) | ∆ C index (95% CI) | cfNRI overall (95% CI) | cfNRI cases (95% CI) | cfNRI noncases (95% CI) | |
|---|---|---|---|---|---|
| Discovery: MONICA/KORA case-cohort study (benchmark for biomarkers: GDRSadapted modela) | |||||
| GDRSadapteda | 0.775 (0.755; 0.790) | – | – | – | – |
| + IL-1RAc | 0.799 (0.780; 0.813) | 0.024 (0.013; 0.033) | 0.432 (0.306; 0.545) | 0.240 (0.144; 0.326) | 0.193 (0.143; 0.240) |
| + IGFBP-2c | 0.798 (0.778; 0.813) | 0.023 (0.012; 0.032) | 0.425 (0.322; 0.532) | 0.330 (0.254; 0.418) | 0.095 (0.045; 0.135) |
| + sE-selectinc | 0.790 (0.771; 0.806) | 0.015 (0.006; 0.022) | 0.330 (0.219; 0.451) | 0.257 (0.169; 0.350) | 0.072 (0.029; 0.119) |
| + Adiponectinc | 0.795 (0.775; 0.811) | 0.020 (0.011; 0.028) | 0.415 (0.306; 0.545) | 0.262 (0.181; 0.359) | 0.152 (0.110; 0.200) |
| + HDL cholesterolc | 0.793 (0.773; 0.807) | 0.018 (0.011; 0.025) | 0.306 (0.171; 0.418) | 0.188 (0.079; 0.266) | 0.118 (0.075; 0.164) |
| + Decorinc | 0.785 (0.764; 0.800) | 0.009 (0.002; 0.015) | 0.194 (0.079; 0.312) | 0.111 (0.022; 0.199) | 0.083 (0.042; 0.130) |
| + All 6 biomarkersc | 0.829 (0.811; 0.844) | 0.053 (0.039; 0.066) | 0.673 (0.573; 0.795) | 0.438 (0.357; 0.530) | 0.235 (0.194; 0.289) |
| Validation: KORA S4 cohort study (benchmark for biomarkers: GDRSadapted modela) | |||||
| GDRSadapteda | 0.773 (0.748; 0.797) | – | – | – | – |
| + All 6 biomarkersc | 0.807 (0.782; 0.831) | 0.034 (0.019; 0.053) | 0.484 (0.356; 0.608) | 0.129 (0.005; 0.242) | 0.355 (0.318; 0.388) |
| Validation: KORA S4 cohort study (benchmark for biomarkers: GDRSadapted + HbA1c model) | |||||
| GDRSadapteda | 0.773 (0.748; 0.797) | ||||
| GDRSadapteda + HbA1cd | 0.802 (0.780; 0.826) | 0.030 (0.021; 0.039) | 0.457 (0.343; 0.588) | 0.241 (0.133; 0.364) | 0.216 (0.178; 0.257) |
| + All 6 biomarkersb,c | 0.826 (0.802; 0.848) | 0.023 (0.009; 0.039) | 0.396 (0.264; 0.520) | 0.130 (0.011; 0.244) | 0.266 (0.226; 0.301) |
Order of biomarkers according to frequency of selection in the MONICA/KORA case-cohort study. Statistically significant results are shown in bold.
Abbreviations: cfNRI, category-free net reclassification index; GDRS, German Diabetes Risk Score; HbA1c, glycated hemoglobin A1c, HDL, high-density lipoprotein; IGFBP-2, insulin-like growth factor binding protein 2; IL-1 RA, interleukin-1 receptor antagonist; MONICA/KORA, Monitoring of Trends and Determinants in Cardiovascular Diseases/Cooperative Health Research in the Region of Augsburg; sE-selectin, soluble E-selectin.
aThe GDRSadapted model includes age, sex, body mass index, survey, physical activity, smoking status, coffee consumption, meat consumption, whole-grain bread/muesli consumption, hypertension, and parental history of diabetes.
bCompared to GDRSadapted + HbA1c.
cIndicates that the biomarkers were included in the model in addition to the GDRSadapted/GDRSadapted + HbA1c model.
dParameters of model comparison (Δ C index, cfNRI) were calculated in comparison to the GDRSadapted model.
In the validation KORA S4 cohort, the C index was significantly improved when all 6 biomarkers were added simultaneously to the GDRSadapted model (Δ of C indices: 0.034 [0.019-0.053]) and the GDRSadapted plus HbA1c model (Δ C index: 0.023 [0.009-0.039]; see Table 2, Fig. 2). Only IGFBP-2, adiponectin, and HDL cholesterol individually significantly improved the C index on top of the GDRSadapted model and only IGFBP-2 and adiponectin on top of the GDRSadapted plus HbA1c model (Supplementary Table S5) (19).
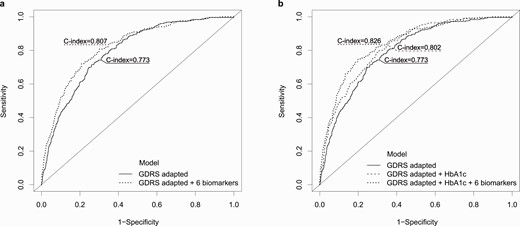
The adapted German Diabetes Risk Score (GDRSadapted) model includes the covariates age, sex, body mass index, survey, hypertension, physical activity, smoking status, coffee consumption, red meat consumption, whole-grain bread/muesli consumption, and parental history of diabetes.
When added to the GDRSadapted model, the addition of all 6 biomarkers in combination and the individual addition of IGFBP-2 improved the overall cfNRI and the cfNRI in cases and noncases significantly, whereas the individual addition of IL-1RA, adiponectin, HDL cholesterol, and decorin improved the overall cfNRI and the cfNRI only in noncases. Results were relatively similar (except for decorin) when biomarkers were added individually and in combination to the GDRSadapted plus HbA1c model (Supplementary Table S5) (19).
We also investigated whether the traditional type 2 diabetes risk factors from the GDRSadapted model increased the predictive performance beyond a basic model including age, sex, BMI, survey, and the 6 selected biomarkers. Whereas the addition of parental history of diabetes, smoking, and hypertension led to small improvements in model performance in terms of the Δ C index and cfNRI, the addition of physical activity, coffee, meat, and whole-grain bread/muesli consumption did not confer an additional benefit (Supplementary Table S6) (19).
Supplementary Figure S6 shows the calibration of the prediction models developed in the MONICA/KORA case-cohort study applied to the validation KORA S4 cohort study (19). Both the GDRSadapted plus 6 biomarkers as well as the GDRSadapted plus HbA1c plus 6 biomarkers models were well calibrated in 90% of the participants. In the highest-risk decile, the predicted 14-year-risk of type 2 diabetes was overestimated.
Correlation coefficients between the 6 selected biomarkers ranged from –0.23 to 0.40 in the MONICA/KORA case-cohort study and were similar in the KORA S4 cohort study (Supplementary Figure S7) (19). Correlation coefficients between HbA1c and the 6 selected biomarkers ranged from –0.14 for adiponectin to 0.09 for decorin in the S3 subcohort of the MONICA/KORA case-cohort study, and from –0.13 for IGFBP-2 to 0.04 for decorin in the KORA S4 cohort.
The prognostic index for the “GDRSadapted + 6 biomarker” model developed in the MONICA/KORA case-cohort study and validated in the KORA S4 cohort study is shown in the Supplementary Material (19).
Discussion
In our discovery population-based case-cohort study, we selected a panel of 6 biomarkers (IL-1RA, IGFBP-2, sE-selectin, adiponectin, HDL cholesterol, decorin) out of 47 candidate biomarkers that, based on the parsimony trade-off, best predicted the development of type 2 diabetes over a period of 14 years on top of a standard clinical model. This panel of 6 biomarkers was validated in an independent cohort study from the same study region. In both studies, the combination of the 6 biomarkers improved the C index beyond the basic clinical models and improved net reclassification both in cases and noncases. Further analyses demonstrated that clinical and lifestyle data may not be necessary for optimal type 2 diabetes prediction if selected biomarkers are used.
Three of the 6 selected biomarkers have consistently been shown to be inversely (adiponectin, HDL cholesterol) or positively (sE-selectin) associated with incident type 2 diabetes in large-scale studies as reviewed by Abbasi et al (17). Whereas IL-1RA levels were associated with incident type 2 diabetes in a few previous studies (6, 10, 38), IGFBP-2 has only recently emerged as novel biomarker candidate for type 2 diabetes (14, 39, 40). For decorin, very limited data are available. One small study found elevated levels of decorin in individuals with type 2 diabetes compared to those with normal glucose tolerance in Mauritius, but results were cross-sectional and not adjusted for other type 2 diabetes risk factors (41). However, animal studies indicated that decorin supports glucose tolerance (42). Therefore, higher levels of decorin before the onset of type 2 diabetes may be part of a counterregulation similar to higher levels of IL-1RA preceding the onset of type 2 diabetes (38).
In addition to the 6 biomarkers selected for type 2 diabetes prediction, another 6 biomarkers were significantly associated with incident type 2 diabetes after correction for multiple testing in multivariable adjusted models. For some of these markers (SHBG, tPA, and leptin) the strength of association was even stronger than for some of the 6 selected predictors. This demonstrates the need for appropriate selection algorithms, taking into account complex correlation structures between biomarkers to identify the best biomarker combination for risk prediction.
The fact that adipose tissue is one of the major sources of several of the type 2 diabetes–related biomarkers (adiponectin, leptin, IGFBP-2, decorin, sE-selectin, tPA, VEGF-R2) underscores the interaction between adipose dysfunction, inflammation, and insulin resistance in the development of type 2 diabetes (43).
During the last decade, several attempts have been made to improve risk prediction of type 2 diabetes using panels of proteins (7, 8, 10, 13, 14), metabolites (11), lipids (12), plasma protein N-glycan profiling (44), and mixed panels of several biomarker types (6, 45-47). Earlier reports, including data from the MONICA/KORA case-cohort study (7), have been limited by relatively few biomarker measurements (7, 8, 13, 45, 47), lack of independent validation (7, 8, 13, 14, 45, 47), or lack of direct assessment of the predictive value on top of standard noninvasive clinical models (46) and clinical models that included glycemic markers such as fasting glucose or HbA1c (7, 45). Overall, conclusions have been inconsistent. Whereas some studies saw hardly any improvement in risk prediction (8, 10, 14, 47), others concluded that their newly developed prediction algorithms were useful for risk stratification of future type 2 diabetes (6, 7, 11-13, 45). The present analysis adds to the current discussion by overcoming some of these limitations. We investigated a relatively large panel of 47 biomarkers that included not only proteins, but also other biomarkers shown to be relevant for type 2 diabetes development, such as lipids, steroids (25-hydroxy-cholecalciferol), and uric acid. In addition to the large discovery study with almost 700 incident type 2 diabetes cases, in which we employed an internal cross-validation approach, we tested the predictive potential of the selected biomarker panel in an independent validation study with about 250 incident cases. Furthermore, we assessed the predictive value of the selected panel on top of a standard noninvasive clinical model and on top of a clinical model that also contained HbA1c. In summary, we observed that the 6 selected biomarkers improved model performance yielding better reclassification (higher cfNRI) as well as discrimination (higher C indices). The Δ C indices of 0.034 and 0.023 observed in the validation cohort when the 6 biomarkers were added to the basic clinical model and the basic clinical model + HbA1c, respectively, exceeded the range of improvement seen in other proteomics studies that employed a similarly rigorous discovery-validation approach to avoid overfitting (6, 16). Furthermore, to put our findings into perspective: The well-established cardiovascular biomarker troponin I improved the C index for a prognostic model of cardiovascular death by 0.007 when added to a clinical model (48). However, when interpreting our results, one has to keep in mind that most of the benefit in the validation cohort (ie, difference in the receiver operating characteristic curves) was seen in a range of performance between about 50% and 80% sensitivity. Thus, the biomarkers would only marginally improve the prediction of type 2 diabetes in a model with greater than 80% sensitivity. In addition, we demonstrated that the developed model is well calibrated and can be used to accurately predict absolute risk in 90% of the investigated population.
Our study has a few limitations that should also be mentioned. Although the number of biomarkers analyzed is reasonably large, new emerging technologies (eg, proteomics profiling with proximity extension assay technology [10] or aptamer-based techniques [16, 40]) allow the simultaneous measurement of even larger biomarker panels in small amounts of samples. Most likely, upcoming novel biomarkers could further improve risk prediction. We were able to assess the predictive potential of the selected biomarker panel on top of HbA1c in our validation cohort. However, the markers were initially selected without taking HbA1c into account, since HbA1c measurements were available only in a subsample of the discovery case-cohort study. Furthermore, we were not able to assess the predictive value in addition to fasting glucose concentrations, since the discovery case-cohort study and parts of the validation cohort study did not include fasting glucose measurements. Although the discovery and the validation study were conducted in the same study region and used similar methods to assess type 2 diabetes and its risk factors, there was one important difference between both studies that could have influenced our results. In the KORA S4 cohort an oral glucose tolerance test was performed at baseline in those aged 55 to 74 years and in all participants at the follow-up examinations in 2007 to 2008 and 2013 to 2014. The results of these tests were communicated to the participants and those with fasting glucose, 2-hour glucose, or HbA1c levels in the diabetic range were advised to consult their general practitioners. Therefore, clinical diagnoses of type 2 diabetes (which have been used for the present analysis regardless of oral glucose tolerance test results) might have been pushed forward in some cases leading to an earlier diagnosis at a less severe stage compared to regular circumstances due to a screening effect. Alternatively, knowledge about the presence of early derangements in glucose metabolism might have motivated some participants to change their lifestyle and thereby might have postponed the development of type 2 diabetes. Because our analysis considered only cases with clinically diagnosed type 2 diabetes, there may be some degree of misclassification. The potential misclassification is most likely nondifferential and thus may have biased our results toward the null. Furthermore, changes in the diagnostic criteria for type 2 diabetes over the course of the study, especially the more stringent criteria for fasting glucose recommended since 1999 may, to some extent, explain the differences in results seen between the discovery and validation studies. However, the results of our validation study, which was conducted between 1999 to 2016, should be generalizable to current clinical practice. Because study participants were mainly White, results are not, however, generalizable to other ethnic groups.
Conclusions
We demonstrated that a panel of 6 biomarkers including IL-1RA, IGFBP-2, sE-selectin, adiponectin, HDL cholesterol, and decorin improved the prediction of type 2 diabetes on top of a noninvasive standard clinical model and on top of a standard clinical model plus HbA1c. Thus, risk prediction models including these markers may help to improve identification of individuals at high risk of developing type 2 diabetes to effectively target preventive efforts to those who are most in need.
Abbreviations
- BMI
body mass index
- cfNRI
category-free net reclassification index
- GDRS
German Diabetes Risk Score
- HbA1c
glycated hemoglobin A1c
- HDL
high-density lipoprotein
- IGFBP-2
insulin-like growth factor binding protein 2
- IL-1RA
interleukin-1 receptor antagonist
- LDL
low-density lipoprotein
- MONICA/KORA
Monitoring of Trends and Determinants in Cardiovascular Diseases/Cooperative Health Research in the Region of Augsburg
- sE-selectin
soluble E-selectin
- tPA
tissue plasminogen activator
- VEGF-R2
vascular endothelial growth factor receptor 2
Acknowledgments
We thank Ulrike Partke for excellent technical assistance with biomarker measurements.
Financial Support: This work was supported by a research grant from the Else Kröner-Fresenius-Stiftung (grant Nos. 2015_A130), the German Research Foundation (grant Nos. TH-784/2-1 and TH-784/2-2), the German Federal Ministry of Education and Research (BMBF) to the German Center for Diabetes Research (DZD), and the Helmholtz Alliance “Aging and Metabolic Programming, AMPro.” Cornelia Huth was supported in part by intramural funding for Translational & Clinical Projects of the Helmholtz Zentrum München—German Research Center for Environmental Health, Germany, which is funded by the BMBF, Germany, and the State of Bavaria. The KORA study was initiated and financed by the Helmholtz Zentrum München and also supported within the Munich Center of Health Sciences (MC-Health), Ludwig-Maximilians-Universität, as part of LMUinnovativ. The German Diabetes Center is supported by the Ministry of Science and Research of the State of North Rhine-Westphalia and the German Federal Ministry of Health (BMG). Part of the biomarker measurements were selected in collaboration with Tethys Bioscience Inc and Singulex, which also funded part of the measurements. The sponsors had no further role in the study design, data analysis, data interpretation, writing of the report, or the decision to publish the manuscript.
Author Contributions: B.T., C.He., and W.K. designed the case-cohort study. B.T., C.M., A.P., W.K., C.He., W.R., M.R., and J.S.K. contributed data. B.T. and C.Hu. coordinated the study. B.T., A.Z., M.B., J.K., and C.Hu. drafted the statistical analysis plan. A.Z. and M.B. performed the statistical analyses. A.Z., M.B., A.B., F.S., and C.Hu. created the figures. B.T., C.Hu., A.Z., M.B., J.K., C.He., and W.K. interpreted the results. B.T. and A.Z. wrote the manuscript. All authors contributed to, critically revised, and approved the final version of the manuscript. B.T. and A.Z. are the guarantors of this work.
Additional Information
Disclosures: W.R. reports personal fees from AstraZeneca, Boehringer Ingelheim, and from Novo Nordisk, and grants from Novo Nordisk outside the submitted work. M.R. reports personal fees from Eli Lilly, Poxel S.A. Société, Boehringer Ingelheim Pharma, Terra Firma, Sanofi US, Servier Labatories, Novartis Pharma GmbH, Fishawack Group, PROSCIENTO Inc, Target Pharmasolutions, Gilead Sciences, Kenes Group, Bristol Myers Squibb, Intercept Pharma, Inventiva, Astra Zeneca, and Allergan GmbH outside the submitted work. W.K. reports personal fees from AstraZeneca, Novartis, Pfizer, The Medicines Company, DalCor, Kowa, Amgen, Corvidia, Daiichi-Sankyo, Berlin-Chemie, Sanofi, Bristol Myers Squibb, and grants and nonfinancial support from Singulex, Abbott, Roche Diagnostics, and Beckmann outside the submitted work. C.He. reports personal fees from Sanofi, and from Lilly, and grants from Sanofi outside the submitted work. The other authors have nothing to disclose.
Data Availability
Some access restrictions apply to the data underlying this study. Phenotypes from the MONICA/KORA studies are not publicly available because the informed consent given by MONICA/KORA study participants does not cover posting data in public databases. However, data are available on request to researchers by means of a project agreement from KORA (http://epi.helmholtz-muenchen.de/kora-gen/). Requests should be sent to [email protected] and are subject to approval by the KORA board.
References
Author notes
Cornelia Huth and Christian Herder contributed equally to this work.
