


Abstract
Skeletal muscle is the primary site for insulin-stimulated glucose disposal, and muscle insulin resistance is central to abnormal glucose metabolism in obesity. Whether muscle insulin signaling to the level of Akt/AS160 is intact in insulin-resistant obese humans is controversial.
We defined a linear range of insulin-stimulated systemic and leg glucose uptake in 14 obese and 14 nonobese volunteers using a 2-step insulin clamp (Protocol 1) and then examined the obesity-related defects in muscle insulin action in 16 nonobese and 25 obese male and female volunteers matched for fitness using a 1-step, hyperinsulinemic, euglycemic clamp coupled with muscle biopsies (Protocol 2).
Insulin-stimulated glucose disposal (Si) was reduced by > 60% (P < 0.0001) in the obese group in Protocol 2; however, the phosphorylation of Akt and its downstream effector AS160 were not different between nonobese and obese groups. The increase in phosphorylation of Akt2 in response to insulin was positively correlated with Si for both the nonobese (r = 0.53, P = 0.03) and the obese (r = 0.55, P = 0.01) groups. Total muscle GLUT4 protein was 17% less (P < 0.05) in obese subjects.
We suggest that reduced muscle glucose uptake in obesity is not due to defects in the insulin signaling pathway at the level of Akt/AS160, which suggests there remain significant gaps in our knowledge of muscle insulin resistance in obesity. Our data imply that models of acute lipotoxicity do not replicate the pathophysiology of obesity.
Obesity increases the risk of developing type 2 diabetes mellitus, most likely by creating a state of insulin resistance (1). The insulin response to meal ingestion greatly increases glucose uptake into skeletal muscle, and skeletal muscle is the tissue largely responsible for insulin-stimulated glucose disposal (2-4). Thus, skeletal muscle insulin resistance is a major site of whole-body insulin resistance (5). At the cellular level, insulin binding to its receptor initiates a signaling cascade that results in the translocation of glucose transporter 4 (GLUT4) from the sarcoplasm to the plasma membrane (6); GLUT4 translocation is required for muscle glucose uptake (7).
The approaches used to understand the possible insulin signaling defects in obesity have included in vitro, animal, and human models of acute and chronic lipotoxicity. For example, acute administration of lipids increases intermediates that inhibit the proximal steps of the insulin signaling pathway (8-11), including the phosphorylation/activation of insulin receptor substrate-1 (IRS-1), phosphoinositide 3-kinase (PI3K), and Akt (12-14). A number of studies suggest that insulin signaling at the level of Akt is impaired in states of chronic insulin resistance in humans (13-18), whereas others have reported no defect in Akt activation by insulin in human insulin resistance (19-23). Differences among studies in the inclusion of males and females, the use of physiological vs pharmacological insulin dosages, approaches to measuring insulin action with respect to glucose metabolism, and whether other signaling steps were measured make it difficult to assess the relationship between insulin-mediated Akt phosphorylation and muscle glucose uptake. In addition, none of the studies we found assessed whether fitness was a confounding variable in the analysis. If impaired insulin signaling to the level of Akt is the cause of obesity-associated muscle insulin resistance, the therapeutic approaches may be quite different approaches if the defects in insulin action are separate from or distal to the IRS-1, PI3K-Akt pathway.
We performed experiments to confirm the role of skeletal muscle as a key site of insulin resistance in obesity as well as to help define the range over which systemic and muscle glucose uptake responds in a linear manner during euglycemic hyperinsulinemia. Then, as part of experiments designed to more specifically identify lipid intermediates associated with muscle insulin resistance in obesity, we determined whether muscle insulin resistance with respect to glucose uptake corresponds to impaired muscle insulin signaling with a specific emphasis on Akt and interrogated its relationship with fitness. Based upon the weight of available literature, we hypothesized that defects in muscle insulin signaling at the level of Akt would be present in obese adults. Our findings do not support this hypothesis.
Materials and Methods
We report the results of 2 separate research protocols. The first (Protocol 1) was to confirm that glucose isotopically measured disposal rates during a hyperinsulinemic, euglycemic clamp are primarily skeletal muscle glucose uptake and that glucose disappearance rates increase in a linear fashion over the range of insulin concentrations that can be achieved with our typical 1-step, hyperinsulinemic, euglycemic clamp. The second (Protocol 2) was to examine the relationship between insulin-stimulated glucose disposal and insulin signaling in obese and nonobese adults. Both studies were approved by the institutional review board at Mayo Clinic and informed written consent was obtained from all volunteers.
Protocol 1
We recruited 14 healthy, upper-body obese Caucasian subjects aged 22 to 50 years, (7 men, 7 women; body mass index [BMI] of 28 to 36 kg/m2) and 14 healthy, nonobese age-matched subjects (7 men, 7 women; BMI <25 kg/m2). Upper-body obesity was considered if waist-to-hip ratio was >0.95 in men or >0.85 in women. All volunteers had been weight stable for the last 3 months. Weight-maintaining meals (40% fat, 40% carbohydrate, 20% protein) were provided at the Mayo Clinical Research and Trials Unit (CRTU) for 3 days before the study to assure consistent nutrient and energy intake. All maintained their usual level of physical activity and were asked not to participate in heavy exercise the last 3 days before the study. All were nonsmokers and used no regular medication. Women were premenopausal and had a negative pregnancy test prior to the study. Clinical data are shown in Table 1.
Protocol 1 Subject Characteristics
| Nonobese | Obese | |
|---|---|---|
| N = 14 | N = 14 | |
| Age (years) | 29 ± 1 | 34 ± 2 |
| Sex (female/male) | 7/7 | 7/7 |
| BMI (kg/m2) | 23.0 ± 0.6 | 33 ± 0.4 |
| Fat-free mass (kg) | 51.1 ± 2.8 | 60.3 ± 2.7 a |
| Body fat % | 25 ± 2 | 38 ± 2 a |
| Leg fat-free mass (kg) | 17.5 ± 0.9 | 19.6 ± 1.1 |
| Fasting plasma insulin concentrations (µIU/mL) | 3.7 ± 0.4 | 7.4 ± 1.0 a |
| Fasting blood glucose (mg/dL) | 90 ± 2 | 92 ± 2 |
Data are presented as mean ± SEM. Differences in BMI are not subject to statistical testing because BMI was not a random variable. Leg fat-free mass is for both legs.
Abbreviation: BMI, body mass index.
aP < 0.01 vs nonobese.
Materials
[3-3H]glucose was obtained from New England Nuclear, Boston, MA, and indocyanine green (Cardio-Green) was purchased from Becton Dickinson and Co., Cockeysville, Maryland, USA.
Protocol
One week before the study, total body fat and fat-free mass (FFM) were measured by dual-energy x-ray absorptiometry (Lunar Radiation Corp., Madison, Wisconsin). Intra-abdominal and abdominal subcutaneous fat mass was assessed using a single-slice computed tomography scanning of the abdomen at the L2-3 interspace in combination with the abdominal fat mass measured by dual-energy x-ray absorptiometry (10). Each participant was admitted to the General Clinical Research Center the evening before the study. An 18-gauge intravenous catheter was inserted in a forearm vein and kept open with 0.45% saline. Each subject received a 325-mg aspirin tablet with the evening meal the day before the study.
The morning of the study, after a 12 hour fast, the volunteers were transferred to the Department of Vascular Radiology for placement of catheters under sterile conditions into the right femoral artery and right femoral vein as previously described in detail (24).
The volunteers were then transferred back to the General Clinical Research Center where blood was sampled before starting the isotope and the indocyanine green infusions to be used for background glucose specific activity and for the indocyanine green (ICG) calibration curve. Infusion of [3-3H]glucose was started through the forearm vein catheter at 7:30 am and ICG infusions were begun 30 minutes before blood sampling into the femoral artery sheath to allow measurement of leg plasma flow. Arterial and femoral venous blood samples were taken at 10-minute intervals over a period of 30 minutes. Between samplings, all catheters were kept patent by infusion of 0.45% saline. After completion of the study, all catheters were removed, and local hemostasis was obtained. The subjects remained in the hospital under observation until the following morning.
Glucose kinetics
A 2-step hyperinsulinemic, euglycemic glucose clamp in combination with regional blood flow measurements was used to assess basal and insulin regulated systemic and regional glucose kinetics. A priming dose of 12 µCi [3-3H]glucose was given at 7:30 am (−90 minutes), followed by a continuous infusion (0.12 µCi/min) throughout the basal period (−90 to 60 minutes) and the 2 hyperinsulinemic periods (step 1, 60-180 minutes; step 2, 180-300 minutes) for determination of glucose turnover rates (endogenous glucose production and total peripheral glucose disposal [Rd]). Insulin (Humulin insulin, Lilly, Indianapolis, IN) was infused at rates of (step 1) 0.25 mU/kg FFM/min and (step 2) 2.5 mU/kg FFM/min. Plasma glucose was measured in duplicate every 5 to 10 minutes immediately after sampling (Beckman Instruments, Palo Alto, CA) and plasma glucose was clamped at ~5 mmol/L during both hyperinsulinemic steps by a variable infusion of dextrose (50%). To minimize rapid dilution of the labeled glucose pool with unlabeled glucose, [3-3H]glucose was added to the glucose infused during the clamp (73.7 µCi/100g dextrose).
Basal and insulin-stimulated systemic glucose flux and leg balances were measured at the end of the basal and each of the hyperinsulinemic steps using isotope dilution technique in combination with A-V blood sampling. Blood samples for measurements of glucose concentration and specific activity were drawn at baseline (60 minutes) and after 90, 100, 110, and 120 minutes of each infusion period.
Blood flow
Indocyanine green was prepared for infusion as 75 mg of ICG in 30 mL of diluent. The ICG was infused at a rate of 250 µg/min into the femoral artery sheath to allow measurement of leg plasma flow. Arterial and femoral venous blood samples were taken at 10-minute intervals over a period of 30 minutes at the end of the basal period and each of the hyperinsulinemic steps. The infusion was begun 30 minutes before each sampling period and turned off at the end of each period. Blood samples were analyzed by spectrophotometry on the day of the study.
Analysis of samples
The isotopic purity of the tracers was determined using high-performance liquid chromatography. Plasma glucose concentrations were measured using the glucose oxidase method. Insulin concentrations were measured using chemiluminescent sandwich assays (Sanofi Diagnostics Pasteur Inc., Chaska, MN).
Calculations
Leg plasma flow was calculated by dividing the dye infusion rate by the arterial-venous gradient across the leg and converted to leg blood flow using each participant’s hematocrit. Glucose turnover was calculated using the steady-state formula. Leg glucose uptake was measured using arterial-venous differences and leg blood flow. Insulin sensitivity was calculated as previously described (25).
Protocol 2
Subjects
Participants were 8 normal weight (BMI 20-25), premenopausal women and 8 age-matched normal weight men, as well as 15 obese, nondiabetic premenopausal women and 11 age-matched, nondiabetic obese men. Exclusion criteria included type 1 or type 2 diabetes, use of nicotine or medications known to affect fatty acid metabolism, and a history of heart disease. The protocol was approved by the Mayo Clinic institutional review board and all subjects provided written, informed consent. After signing informed consent, a history and physical examination was performed, and a blood sample was collected for laboratory screening to exclude chronic medical conditions. Because fitness is independently associate with insulin-stimulated Rd (26), each volunteer underwent a treadmill exercise test to measure peak VO2 ≥ 1 week prior to the insulin clamp/muscle biopsy study.
Protocol
All volunteers were weight stable for 2 months prior to the study and consumed an isoenergetic diet (45% carbohydrate, 20% protein and 35% fat) from the CRTU for 3 days prior to the study to ensure consistency of energy intake and nutrient composition prior to the studies. Body composition was measured as described for Protocol 1.
Volunteers were admitted the evening prior to the insulin clamp study; at 6:00 pm they consumed an evening meal consistent with their previous 3-day pattern. They then fasted overnight except water from 9:00 pm onward. A blood sample was obtained for background enrichment measurements at 4:00 am. The next morning, intravenous catheters were placed in a forearm vein for infusions and in a hand vein (retrograde) for arterialized venous blood sampling using the heated hand technique. At 6:00 am, a primed, continuous infusion of [6-2H2]-glucose (0.06 mg • kg FFM−1 • min−1) was started, to trace glucose metabolism. A series of blood samples were collected between 8:30 am and 9:00 am to measure glucose enrichment and concentrations, followed by a (baseline) skeletal muscle biopsy of the vastus lateralis, which was performed under sterile conditions using local anesthesia as previously described (27). Immediately after the biopsy a primed, continuous (1 mU•kg−1•min−1) insulin infusion was started and continued for 5 hours. We infused 50% dextrose labeled with [6-2H2]-glucose in order to maintain blood glucose between 90 and 95 mg/dL. Blood glucose was measured every 10 minutes to allow for adjustment of the glucose infusion rate. Thirty minutes after beginning the insulin clamp, a second, smaller muscle biopsy was collected from the contralateral leg to assess rapid-onset insulin signaling. A series of blood samples were collected during the last 30 minutes of the insulin clamp to allow measurement of hormone, tracer, and substrate concentrations. At the end of the 5-hour insulin clamp, a third muscle biopsy was taken from the same leg as the first biopsy, at least 8 cm distant from the first biopsy (to avoid the effects of local trauma from the first biopsy). Glucose disappearance rate under hyperinsulinemic-euglycemic conditions was used as our index of muscle Rd. After the third muscle biopsy, the infusions were stopped, the subjects were provided with lunch, and they were dismissed from the CRTU.
Assays
Blood glucose concentrations were measured using a Beckman glucose analyzer (Beckman Instruments, Fullerton, CA). Glucose enrichment was measured with gas chromatography–mass spectrometry (28) and insulin concentrations were measured using chemiluminescent sandwich assays (Sanofi Diagnostics, Chaska, MN).
Sample preparation
Tissue obtained from muscle biopsies was immediately flash-frozen. Muscle tissue was cleaned under the microscope to remove any connective and adipose tissue as previously described (29). For protein measurements, approximately 30 mg of muscle was homogenized at a 1:10 dilution in SHBP (20 mM Tris-HCl, 1 mM EDTA, 255 mM sucrose, pH 7.4) using the homogenizer Bead Ruptor 24 OMNI-system. An antiprotease cocktail tablet from Roche and Halt phosphatase inhibitor cocktail (Thermo Fisher Scientific) was included in the homogenization buffer. Homogenates were centrifuged for 10 minutes at 16 000g at 4 °C and the supernatants were collected. Total protein concentrations of the whole-tissue extracts were measured using Pierce BCA Protein Quantitation kit (Thermo scientific) and the samples were stored at −80 °C until assayed.
Capillary Western blotting
Capillary Western analyses were performed using the ProteinSimple Wes System. Protein muscle tissue extracts were diluted to desired concentration with 0.1 × Sample Buffer. Diluted samples were combined with Fluorescent Master Mix at a 4:1 ratio and denatured (by heating/dithiothreitol) for the assay. Primary antibodies against Akt1/2 (C67E7-4691S), pAkt-Ser473/474 (D9E-XP 4060S), Akt2 (3063S), pAkt2-Ser474 (8599S), glycogen synthase kinase 3β (GSK3β) (27C10-9315S) and pGSK3β-Ser9 (D3A4-9322S) pPAK-1-Thr423(2601), PAK-1 (2602) were also used from Cell Signaling Technology (Danvers, MA, USA) were used. Primary antibodies against AS160 (also known as TBC1D4, here referred to as AS160) (ab24469) and pAS160-Thr642 (ab65753) were obtained from Abcam (Cambridge, UK). GLUT4 antibody (#071404) was obtained from Millipore (Burlington, MA). ProteinSimple Wes uses chemiluminescent detection or proteins with horseradish peroxidase–conjugated secondary antibodies; a biotinylated ladder provided molecular weight standards for each assay (29). The reproducibility of the assay was assessed by monitoring the calibrator signal throughout the runs and normalizing the sample signal to the calibrator’s signal within each run. The intra-assay and inter-assay variabilities were reported as coefficient of variation (CV). Intra-assay values as percentage CV were Akt, 10%; pAkt, 15%; pAkt, 12%; Akt2, 15%; AS160, 17%; pAS160, 19%; GSK3β, 9%; pGSK3β, 11%; and GLUT4, 13%. Inter-assay values were Akt, 16%; pAkt, 22%; Akt2, 19%; pAkt2, 16%; AS160, 18%; pAS160, 20%; GSK3β, 17%; pGSK3β, 19%; and GLUT4, 18%.
Phosphoproteomics
Skeletal muscle lysates from 4 nonobese and 4 obese volunteers, both before and at 5 hours (end of the insulin clamp) were used for phosphoproteomic analysis. Based on the Akt measurements, we identified 4 nonobese and 4 obese subjects who showed the greatest increases in Akt phosphorylation, but were discrepant for Si, for phospho-proteomics analysis by the Mayo Clinic Proteomics core laboratory. The lysates were desalted on Zeba spin desalting columns, vacuum concentrated to dryness, and reconstituted in 2% deoxycholate/50mM Tris pH 8.2, 100mM MgCl2, and phosphatase inhibitors (GoldBio SimpleStop 1 and 3). Total protein assays were done on each sample, with 1-mg protein aliquots used for reduction/alkylation/trypsin digestion. Samples were acidified after digestion to precipitate deoxycholate, then washed, re-precipitated, desalted via reversed phase spin columns, followed by phosphopeptide enrichment on TiO2 spin tips (Titansphere). Phosphopeptide-enriched samples were acidified, vacuum concentrated to dryness, and then stored at −80 °C prior to nanoscale liquid chromatography–tandem mass spectrometry analysis, which was performed in duplicate for each sample using a ThermoFisher Q-Exactive-Plus mass spectrometer with 120 min LC gradients and Top20 data-dependent acquisition mass spectrometry method. Data processing workflow used MaxQuant 1.5.1.2 and Andromeda database search against the SwissProt human protein database (UniProt.org, ver. 2018-05), followed by statistical comparison of data using Perseus 1.6.2.1 (30).
Calculations
Basal, steady-state glucose flux (mg/min) was calculated by dividing the [6-2H2] glucose infusion rate (mg/min) by steady-state plasma enrichment (%); glucose disappearance rates during the insulin clamp used the same approach but included the amount of [6-2H2]glucose present in the 50% dextrose that was infused to maintain euglycemia. Insulin sensitivity for glucose disposal (Si) for each participant was calculated as the increase in glucose disappearance (mg • kg FFM−1 • min−1) from basal to the final 30 minutes of the insulin clamp as a function of the increase in plasma insulin concentrations.
Statistics
All values are provided as mean ± SEM unless otherwise stated. Comparisons between nonobese and obese groups for Akt, AS160, GSK3β, and GLUT4 protein expression were done with unpaired t tests and by 2-way analysis of variance (ANOVA) for the basal, 30-minute biopsy, and 5-hour biopsy comparison between the groups. Repeated measures ANOVA was employed to compare GLUT4 measurements. Correlations were evaluated by Pearson’s linear regression analysis. Rd dose-response curves were evaluated by using linear regression analysis. A P value of < 0.05 was considered statistically significant. Integrative pathway analyses for both differentially expressed proteins were performed using MetaboAnalyst 3.0 (www.metaboanalyst.ca). Canonical signaling pathway and upstream regulator analysis were performed by Ingenuity Pathway Analysis (IPA) package and analyzed using default settings (Qiagen, CA, USA).
Results
Protocol 1
Subject characteristics
Percent body fat, FFM, fat mass, leg fat, and fasting plasma insulin concentrations were all greater in obese than nonobese volunteers. The obese volunteers were slightly, but not significantly, older than nonobese volunteers. Leg FFM and fasting blood glucose concentrations were not significantly different between groups. Table 1 shows participant characteristics.
Leg blood flow and plasma insulin concentrations
Baseline leg blood flow was 542 ± 53 and 589 ± 64 mL/min (P = NS) in the nonobese and obese groups, respectively. Leg blood flows in the nonobese and obese groups during the first and second steps of the insulin clamp were 546 ± 55 vs 555 ± 47 (P = NS) and 638 ± 69 vs 632 ± 63 mL/min (P = NS), respectively. Plasma insulin concentrations in the nonobese and obese groups during the first and second steps of the insulin clamp were 14.1 ± 1.1 vs 21.9 ± 4.2 (P = 0.10) and 107.2 ± 8.8 vs 124.1 ± 12.4 µIU/mL (P = 0.28), respectively.
Glucose disposal rates and leg glucose uptake
Whole-body glucose disappearance rates were not significantly different between nonobese and obese volunteers at baseline (2.8 ± 0.3 vs 2.6 ± 0.1 mg • kg FFM−1 • min−1, respectively) and increased significantly during each insulin clamp step for each group (at least P < 0.004). Glucose disappearance was not significantly different between nonobese and obese volunteers during the first step insulin clamp (4.0 ± 0.3 vs 3.4 ± 0.2 mg • kg FFM−1 • min−1, respectively, P = 0.16), but was greater in nonobese than obese volunteers (10.5 ± 0.7 vs 7.4 ± 0.9 mg • kg FFM−1 • min−1, respectively, P = 0.01) during the second step of the insulin clamp.
Similarly, leg glucose uptake rates were not statistically significantly different between nonobese and obese volunteers at baseline (0.9 ± 0.2 vs 1.0 ± 0.2 mg • kg FFM−1 • min−1, respectively) or during the first step of the insulin clamp (4.0 ± 1.1 vs 2.5 ± 0.6 mg • kg FFM−1 • min−1, respectively). However, leg glucose uptake rates during the second step of the insulin clamp were greater in nonobese than obese volunteers (11.6 ± 1.5 vs 6.3 ± 1.4 mg • kg FFM−1 • min−1, respectively, P = 0.02). Leg glucose uptake increased significantly during each insulin clamp step for each group (at least P < 0.05).
The relationships between plasma insulin concentrations and whole-body glucose disposal rates as well as for leg glucose uptake rates for nonobese and obese volunteers are depicted in Fig. 1A. There was a linear relationship between plasma insulin concentrations and whole-body glucose disposal rate over the range of insulin concentrations we achieved, consistent with our previous observations (25), as well as between insulin concentrations and leg glucose uptake. The relationship between leg glucose uptake and whole-body glucose disposal during the second step of the insulin clamp is depicted in Fig. 1B. There was a strong, positive relationship between whole-body and leg glucose uptake rates.
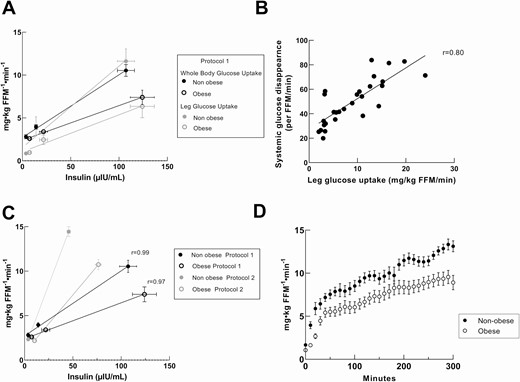
Relationships between plasma insulin concentrations and whole body and leg glucose disposal rates. Correlation between insulin concentrations and glucose disposal rates of nonobese and obese volunteers measured as mg • kg FFM−1 • min−1. A, Protocol 2 Whole body glucose disposal rates and leg glucose uptakes linearity. B, correlation between whole-body and leg glucose disposal (r = 0.80). C, Protocol 1 and Protocol 2 whole-body glucose disposal rates and fitness of linearity within range of insulin concentration. D, Protocol 2 glucose infusion rates from nonobese and obese during 5-hour hyperinsulinemic-euglycemic clamp.
These studies confirmed previous observations (2) that the increase in whole-body glucose disposal under euglycemic, hyperinsulinemic conditions is primarily into skeletal muscle. They also document the linear relationship between plasma insulin concentrations and whole-body/leg glucose uptake over the range of plasma insulin concentrations from overnight fasting up to ~125 µIU/mL. The latter observation supports the use of Si as a robust measure of insulin action for use in the analysis of Protocol 2.
Protocol 2
Subject characteristics and glucose uptake
Table 2 shows Protocol 2 participant characteristics and glucose uptake. As expected, the obese volunteers had more body fat, greater fasting insulin, and triglyceride concentrations. The relationship between plasma insulin concentrations and whole-body glucose disposal rates for the groups in both Protocol 1 and Protocol 2 are depicted in Fig. 1C; the plasma insulin concentrations achieved in Protocol 2 fall well within the linear response range identified in Protocol 1. The glucose infusion rates over the entire 5 hours of Protocol 2 for the obese and nonobese groups are shown in Fig. 1D. Note that the glucose infusion rate (and total glucose disappearance rate) continued to increase between 120 and 240 minutes, which accounts for the greater total glucose disappearance rate relative to insulin concentrations in Protocol 2 than in Protocol 1. Si was significantly less in the obese than the nonobese group (P < 0.0001).
Protocol 2 Subject Characteristics
| Nonobese | Obese | |
|---|---|---|
| N = 16 | N = 25 | |
| Age (years) | 32 ± 2 | 35 ± 2 |
| Sex (female/male) | 8/8 | 15/10 |
| BMI (kg/m2) | 23.0 ± 0.4 | 33 ± 0.4 |
| Fat free mass (kg) | 51.3 ± 2.9 | 56.9 ± 1.7 |
| Body fat (kg) | 17.3 ± 1.0 | 39.1 ± 1.3 |
| Body fat percentage (%) | 26.9 ± 7.0 | 42.1 ± 1.3a |
| Waist to hip ratio | 0.79 ± 0.01 | 0.88 ± 0.03 b |
| Upper body subcutaneous fat (kg) | 8.6 ± 0.5 | 19.6 ± 0.9a |
| Visceral fat (kg) | 1.5 ± 0.2 | 4.8 ± 0.5a |
| Fasting plasma insulin concentrations (µIU/mL) | 3.7 ± 0.4 | 9.7 ± 1.0 a |
| Insulin clamp concentrations (µIU/mL) | 45.6 ± 1.7 | 76.4 ± 3.3a |
| Fasting plasma glucose concentrations (mg/dL) | 86 ± 1 | 91 ± 1 |
| Basal rate of glucose disappearance (mg/min) | 130 ± 8.3 | 142 ± 5.0 |
| Clamp rate of glucose disappearance (mg/min) | 816 ± 60 | 609 ± 33c |
| Insulin sensitivity (Si) (mg•kg FFM−1•min−1•µIU/mL−1) | 0.33 ± 0.02 | 0.14 ± 0.01a |
| Plasma total cholesterol (mg/dL) | 177 ± 8 | 179 ± 5.7 |
| Plasma triglycerides (mg/dL) | 79 ± 8 | 139 ± 14 b |
| HDL-C (mg/dL) | 59 ± 3 | 47 ± 3 b |
| LDL-C (mg/dL) | 101 ± 6 | 105 ± 5 |
| VO2peak | 43 ± 2 | 41 ± 1 |
Values are means ± SEM for subject characteristics.
Abbreviations: BMI, body mass index; HDL-C, high-density lipoprotein cholesterol; LDL-C, low-density lipoprotein cholesterol
aP < 0.0001, bP < 0.05, cP < 0.01
Time of onset activation of the insulin signaling pathway
Although insulin-stimulated muscle glucose uptake is often defined as the increase in glucose rate of disappearance at the end of a euglycemic insulin clamp, some have suggested that Akt phosphorylation wanes after 30 minutes despite continued insulin infusion (13). To assure we would not miss the optimal phosphorylation responses, we collected muscle biopsy samples at baseline, 30 minutes, and 5 hours after beginning the insulin clamp; there was insufficient sample to run all assays on the 30-minute sample for a few subjects. The fold increase was calculated by the ratio of phosphorylated Akt at the 5-hour and 30-minute biopsy over the baseline phosphorylation (pre–insulin clamp biopsy). The fold increase in Akt phosphorylation was not different between the 30-minute and 5-hour time points for the entire cohort (3.9 ± 2.7 for the 30-minute and 3.9 ± 2.8 (SD) for the 5-hour, P = 0.95). In addition, there was a strong, positive correlation between Akt activation after 30 minutes and 5 hours of continuous hyperinsulinemia (r = 0.76, P < 0.0001, Fig. 2A), indicating sustained and consistent Akt phosphorylation during the 5 hours of the insulin clamp. The same was true for the fold increase in Akt2-specific Ser474 phosphorylation (2.3 ± 1.4 for the 30-minute and 2.5 ± 1.3 (SD) for the 5-hour, P = 0.58); likewise, the fold increase in Akt2-specific Ser474 phosphorylation was correlated between the 30-minute and 5-hour biopsies (r = 0.75, P < 0.0001, Fig. 2B). The fold increases in AS160 and GSK3β phosphorylation were also not different between the 30-minute and 5-hour time points (1.0 ± 0.7 vs 1.2 ± 1.1 [SD], P = 0.29 and 1.4 ± 0.3 vs 1.3 ± 0.4 [SD], P = 0.22, respectively). Likewise, there was a positive correlation between the responses at these time points for both AS160 (Fig. 2C, r = 0.70, P < 0.0001) and GSK3β (Fig. 2D, r = 0.55, P = 0.0003). Because we use the glucose disappearance rate over the last 30 minutes of the 5-hour insulin clamp as our insulin sensitivity value, we also used the protein phosphorylation responses from the 5-hour biopsy to compare groups.
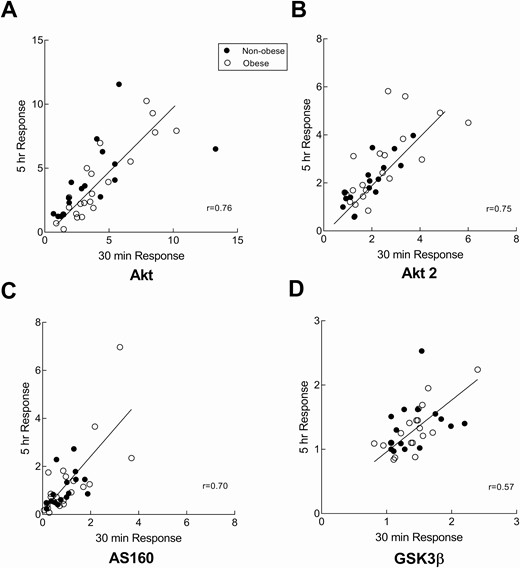
Early onset activation of the insulin signaling pathway. Correlation between the 30-minute and 5-hour fold increase from baseline in phosphorylation of Akt (Ser473), Akt2 (Ser474), AS160 (Thr642), and GSK3β(Ser9) in nonobese and obese volunteers. Muscle biopsies were collected at just prior to insulin clamp and 30 minutes and 5 hours after starting the clamp. A, The fold increase values for Akt (Ser473) phosphorylation from the 2 biopsies were correlated (r = 0.76, P ≤ 0.001) B, The fold increase values for Akt2 (Ser474) phosphorylation from the 2 biopsies were correlated (r = 0.75, P ≤ 0.001) C, The fold increase in AS160 (Thr642) phosphorylation from the 2 biopsies correlated (r = 0.70, P ≤ 0.001). D, The fold increase in GSK3β (Ser9) phosphorylation from the 2 biopsies were positively correlated (r = 0.55, P ≤ 0.001)
Akt response during the hyperinsulinemic-euglycemic clamp in obesity
To investigate whether Akt signaling is impaired in obesity, we measured the ratio of Akt phosphorylation (Ser473) to total Akt and used the fold increase over basal at 5 hours after starting the insulin clamp as our index of insulin activation of Akt. Although Akt Ser473/474 phosphorylation is widely used as a measurement for insulin signaling activation, Akt2 (present in skeletal muscle and insulin responsive tissues (31)) becomes phosphorylated on the Ser474 residue. In order to test for specificity of Akt2 activation and differences between isoforms, we measured Ser473/474 and Akt2-specific Ser474phsophorylation. We found no difference in the amount of total Akt/Akt2 protein (relative units) between nonobese and obese volunteers and no difference in the ratio of pSer473/474/Akt1/2 or pSer474/Akt2 under basal conditions between these 2 groups. The fold increase in Akt phosphorylation at 5 hours in response to hyperinsulinemia was not different between nonobese and obese for pSer473/474 or pSer474 (3.6 ± 0.5 vs 3.8 ± 0.6, P = 0.77 and 2.3 ± 0.3 vs 2.6 ± 0.3, P = 0.50, respectively). Fig. 3A-3B depicts the relationship between the fold increase in Akt phosphorylation and Si for nonobese and obese volunteers. The relationship between Akt activation and Si was positive (r = 0.56, P = 0.02) for the nonobese group, but not for the obese group (r = 0.14, P = 0.49). Akt2-specific fold change correlated positively with Si for both the nonobese (r = 0.53, P = 0.03) and the obese (r = 0.55, P = 0.01) groups. The fold increase of Akt and Akt2-specific was not significantly different between women and men (4.4 ± 0.7 vs 3.3 ± 0.4, P = 0.17 and 2.4 ± 0.3 vs 2.6 ± 0.3, P = 0.56, respectively, Supplemental Figure 1A and 1B (32)). As for the 30-minute biopsy, there was not a positive relationship for either of the groups (Supplemental Figure 2A and 2B (32)). There were no significant between-group differences for the 30-minute and 5-hour timepoint data (2-way ANOVA).
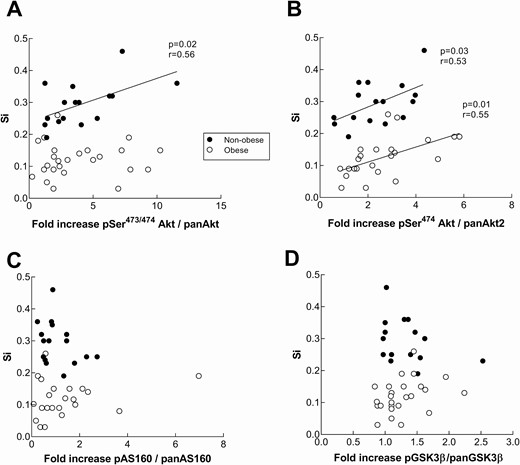
Insulin signaling response in nonobese and obese subjects during a hyperinsulinemic-euglycemic clamp in relation to muscle insulin sensitivity. Akt (Ser473) (panel A), Akt2(Ser474) (panel B), AS160 (Thr642) (panel C), and GSK3β (Ser9) (panel D) phosphorylation was measured by means of capillary Western blot from vastus lateralis biopsies at baseline and the end of a 5-hour insulin clamp. Content of pan Akt and pAkt, pan AS160 and pAS160, as well as pan GSK3β and p GSK3β were assessed relative to tissue weight. The fold increase in the phosphorylation was calculated as a ratio of pSer473/474 Akt/panAkt, pSer474Akt/Akt2, pAS160/panAS160, and pGSK3β/panGSK3β at 5 hours over the ratio at baseline. Insulin sensitivity (Si) is expressed as mg•kg FFM−1•min−1•µIU/mL−1. There was not a statistically significant difference between groups in the relationships of Akt, AS160, or GSK3β fold increase and Si.
AS160 responses during the hyperinsulinemic-euglycemic clamp in obesity
To follow up on the lack of differences in Akt activation despite large differences in Si between the nonobese and obese groups, we measured the phosphorylation of Akt substrate, AS160 (Thr642), the next step following Akt (Ser473/474) phosphorylation in the GLUT4 translocation pathway. Similar to our findings for Akt, there were no statistical differences between AS160 phosphorylation in the nonobese and obese (1.2 ± 0.2 vs 1.3 ± 0.2, respectively, P = 0.53). There was not a significant relationship between AS160 phosphorylation responses at 5 hours and Si for either the nonobese or obese groups (r = −0.33, P = 0.2 and r = 0.11, P = 0.5, respectively, Fig. 3C). The fold increase in AS160 phosphorylation was not different between women and men (1.1 ± 0.2 vs 1.3 ± 0.3, P = 0.7, respectively, Supplemental Figure 1C (32)). The results were not different if the data from the 30-minute muscle biopsy were used (Supplemental Figure 2C (32)).
GSK3β responses during the hyperinsulinemic-euglycemic clamp in obesity
GSK3β is activated by Akt in a parallel pathway on its Ser9 residue. In order to further interrogate the Akt activation results we measured the phosphorylation responses of GSK3β in the same samples. There were no statistical differences of GSK3β phosphorylation between nonobese and obese (1.3 ± 0.08 vs 1.2 ± 0.06, respectively, P = 0.56, Fig. 3D). The fold increase of GSK3β was not significantly different between women and men (1.2 ± 0.2 vs 1.3 ± 0.3, P = 0.7, respectively, Supplemental Figure 1D (32)). The results were not different if the data from the 30-minute muscle biopsy were used (Supplemental Figure 2D (32))
Skeletal muscle GLUT4 total protein expression
To test whether there are between-group differences in the total amount of the key protein needed for muscle glucose uptake that might explain our findings, we assayed each of the 3 muscle samples from each volunteer for total GLUT4 protein. Because there was no difference between total GLUT4 protein content across the 3 biopsies (P = 0.43, repeated-measures ANOVA) we used the mean value of each individual’s 3 GLUT4 measures to test for between-group differences. Total skeletal muscle GLUT4 protein was 17% less (P = 0.047) in obese than nonobese subjects (Fig. 4). It was interesting to note that Si was correlated with total GLUT4 protein content (r = 0.41, P = 0.006) for the entire cohort.
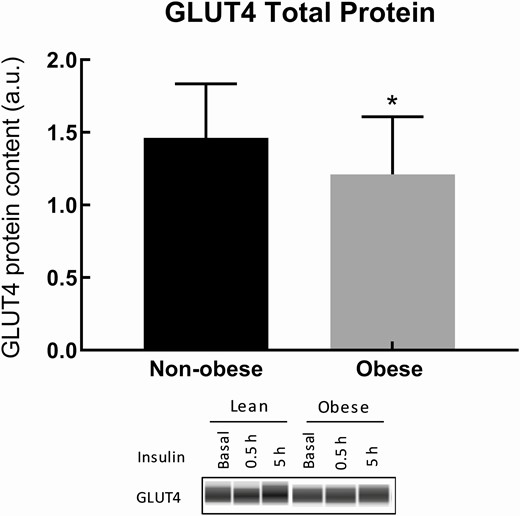
Total GLUT4 protein content of nonobese and obese subjects. Total GLUT4 protein content was measured in muscle biopsy samples. The average of the 3 biopsies was taken per subject. The 17% reduction in GLUT4 total protein in obese compared with nonobese groups is significant (P = 0.047).
Insulin signaling and fitness
Although there was no correlation between VO2 peak (mL • kg FFM−1 • min−1) and the pSer473/474/panAkt fold increase, there was a modest association between VO2 peak and Akt2 specific phosphorylation for the nonobese group (Fig. 5) at 30 minutes (r = 0.59, P = 0.02) and at 5 hours (r = 0.41, P = 0.11). For the obese group, there was no association between VO2 peak and Akt, AS160, or GS3Kβ phosphorylation responses. There was not a significant correlation between total muscle GLUT4 protein and VO2 peak (P = 0.1).
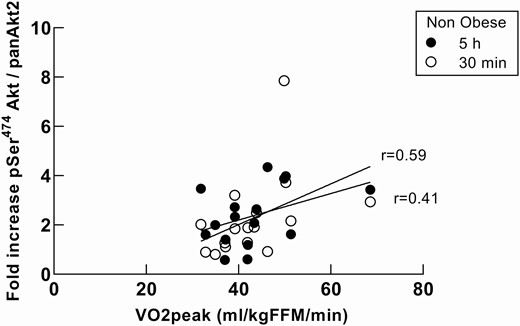
VO2 peak association with Akt2 response in nonobese subjects during a hyperinsulinemic-euglycemic clamp. Association between VO2 peak and Akt2 specific phosphorylation for the nonobese group at 30 minutes (r = 0.59, P = 0.016) and at 5 hours (r = 0.41, P = 0.11). There was no association between either Akt phosphorylation and VO2 peak for the obese group or in the responses of AS160 and GS3Kβ and VO2 peak.
IPA Pathway Analysis
Phosphoproteomics results for enriched proteins were analyzed with Ingenuity Pathway Analysis (IPA) and Metacore Analysis. The protein enrichment from the nonobese was set as the baseline, and the obese protein enrichment was taken as the delta from the baseline. Signaling and metabolic canonical pathways enriched in the data were analyzed and a z-score was given. Actin cytoskeleton signaling and Protein Kinase A signaling appeared to be dysregulated in the obese subjects as indicated by the z-score (Supplemental Figure 3) (32)). Between-group differences in PAK-1 protein activation were further examined using capillary Western methods. The total protein content of PAK-1 was significantly greater in obese than nonobese (P = 0.03, not shown), but the difference in PAK-1 phosphorylation responses between nonobese and obese at 30 minutes and 5 hours was not statistically significant. There was a significant increase in PAK-1 phosphorylation from the 30-minute to the 5-hour biopsies for the obese (P = 0.04), but not the nonobese group.
Discussion
Muscle insulin resistance with respect to muscle glucose uptake is a key feature of obesity and type 2 diabetes mellitus (33). Akt phosphorylation is considered a key step in canonical intracellular insulin signaling leading to cellular glucose uptake, as demonstrated in cell-based (34); rodent (35), and human (20) studies. Defective insulin-induced Akt phosphorylation has been implicated in obesity-associated muscle insulin resistance (12, 15). We confirmed a linear range for insulin-stimulated whole body/leg glucose uptake to allow us to use the Si values from a single-step, euglycemic, hyperinsulinemic clamp to study both insulin-stimulated muscle glucose uptake as well as the activation of Akt and downstream modulators in the insulin signaling pathway in nonobese and obese humans. Our analysis of muscle samples collected using biopsies at baseline, 30 minutes, and 5 hours after beginning the insulin clamp revealed no defects in Akt, AS160, or GSK3β activation in obese compared with nonobese humans despite remarkable reductions in muscle glucose uptake. The modest, but significant reduction in total muscle GLUT4 protein in obese subjects was not in proportion to the reduced glucose uptake observed in obesity, but it was interesting to note that GLUT4 did correlate with Si.
Although previous studies have documented that insulin-stimulated glucose uptake is primarily into peripheral/muscle tissue (2-4), we wished to confirm this finding and address whether Si, the increase in glucose disposal as a function of the increase in plasma insulin concentrations, can be used to estimate muscle insulin sensitivity during a single-step insulin clamp. We found that whole-body glucose uptake correlates strongly with leg glucose uptake and that both leg and whole-body glucose uptake increase linearly as a function of plasma insulin concentrations. This observation supports the use of Si to quantify muscle insulin action, which is an important consideration, given the wide range of plasma insulin concentrations that are achieved in different volunteers even when given the same amount of insulin. The insulin concentrations we achieved in Protocol 2 are within the linear range we defined in Protocol 1. With regard to tissue specificity, studies by Ferrannini et al (4) suggest that glucose uptake into adipose tissue is proportionately less impaired than glucose uptake into muscle in insulin-resistant humans. If the insulin-resistant, obese volunteers in our studies were similar to those reported by Ferrannini et al (4), skeletal muscle glucose uptake during euglycemic hyperinsulinemia in our volunteers would account for ~ 83% and ~64% of total glucose disposal (after accounting for body composition differences) in nonobese and obese subjects, respectively. Thus, skeletal muscle insulin resistance in our obese volunteers may be worse than indicated by their Si values.
Is Akt the Central Insulin Signaling Protein for Glucose Uptake?
Akt is thought by some to be a key insulin-regulated signal transducer that ultimately results in GLUT4 translocation and Akt phosphorylation has been described as the sufficient step to recapitulate insulin-induced glucose uptake in mice (36). Cell model (37, 38), rodent, and some human studies (12-18) support the concept that decreased muscle glucose uptake is related to decreased insulin signaling at the level of Akt phosphorylation. The Akt2 isoform is predominantly expressed in muscle (39). When Akt attaches to 3,4,5-triphosphate (PIP3) at the plasma membrane, it is first phosphorylated by 3-phosphoinositide-dependent protein kinase 1 (PDK1) on Thr308/309, only after which can it be phosphorylated at a second site (Ser473/Ser474) by mTOR2 to amplify its activity. Because the second phosphorylation leads to the signal amplification of the insulin pathway (40), we measured phosphorylation at the Ser473 residue and Akt2 specific Ser474 phosphorylation; the latter isoform is more specific (31, 41). We found that Akt was phosphorylated to the same extent in obese and nonobese subjects (Fig. 2). Neither total Akt protein nor basal Akt phosphorylation was different between nonobese and obese groups, indicating there is no fundamental difference in Akt to explain our finding of reduced glucose disposal in obesity.
The potential role of defects in insulin signaling at the level of Akt in vivo in humans is still debatable. Some investigators report that insulin-stimulated Akt phosphorylation is reduced in acute (12) and chronic insulin resistant states (13-17, 42), whereas others report more normal Akt responses (19-23). We noted that there was a relatively even distribution of male and female participants in most of the studies reporting reduced signaling through Akt (13-17), whereas those reporting intact Akt signaling in insulin resistant states studied only (19-21), or primarily (22, 23), males. Because we have a relatively even balance of male and female participants in both the nonobese and obese groups, we can exclude sex difference in responses as a possible cause for this discrepancy. We used a physiological dose of insulin to measure glucose uptake and insulin signaling, whereas pharmacological doses of insulin were used by investigators reporting both intact (19, 22) and impaired (13, 16) Akt responses. Many studies included 20 or fewer subjects, some of whom report defective (14, 15, 17, 18) and some intact (19-21) Akt signaling. If small sample size were to contribute to false negative or false positive findings, one might expect larger studies to be in agreement. However, the 4 studies we found with 30 or more participants were evenly split between those that report defective (13, 16) and intact (22, 23) Akt signaling. With our relatively large sample size we were able to detect significant, positive associations between Akt2-specific fold change and Si for both the nonobese and the obese groups, but the obese group was clearly shifted down for Si (Fig. 3B). Only Kim (22) (lean volunteers only) and Tonks (16) reported positive associations between glucose infusion rates and Akt phosphorylation. Because most investigators use raw glucose infusion rates or glucose disposal rates absent an accounting for the achieved plasma insulin concentrations, some of these relationships may have been missed. Although some authors have divided Akt responses by plasma insulin concentrations (15), more recent publications suggest that this approach to data handling might result in misleading conclusions (43). Our data argue that, within each group (nonobese and obese), those with reduced Akt signaling are more insulin resistant when Si, a robust measure of insulin action is used. Finally, none of the studies we encountered measured fitness, a known correlate of insulin sensitivity.
While a good cardiorespiratory fitness is associated with greater insulin sensitivity, exercise interventions have shown an association with Si and VO2 peak (44) and sometimes do not (45). Exercise training has been shown increase in protein expression of Akt/AS160/GLUT4 (46-50), raising the possibility that differences in activity/fitness, which were not measured in the studies that come to different conclusions regarding insulin resistance and muscle insulin signaling, could account for the discrepant insulin signaling results. Levinger et al (51) found a positive correlation between basal pAS160 and VO2 peak in a study of middle-aged, sedentary women. We likewise found a modest correlation between VO2 peak and Akt2-specific phosphorylation in the nonobese group. However, because fitness was not significantly different between obese and nonobese groups, we conclude that the reduced Si with intact Akt/AS160 signaling cannot be attributed to differences in fitness.
We also found no difference between nonobese and obese groups in AS160 phosphorylation in response to the insulin clamp. Like AS160, TBC1D1 is also a Rab GTPase that shares similar downstream targets. However, their upstream signals seem to differ. AS160 functions in an Akt-mediated phosphorylation–dependent manner whereas TBC1D1 contains a distinctive AMPK residue, suggesting activation in an exercise-dependent fashion (52). Under basal conditions, AS160 attenuates GTP loading of the small Rab GTPases such as Rab8a and Rab13 in muscle. Phosphorylation of AS160 reduces the inhibitory effect on Rabs, favoring the GLUT4 containing vesicle trafficking to the plasma membrane (53). In response to insulin, Akt phosphorylates AS160 at multiple sites (including Thr642), inhibiting its GTPase activity favoring interaction with Rab proteins (53). The AS160 phosphorylation responses to insulin were not different between the nonobese and obese groups (Fig. 3). Some investigators have shown that attenuation of AS160 phosphorylation decreases GLUT4 translocation and glucose uptake in cell models (13, 54), and reduced in vivo muscle AS160 phosphorylation in response to insulin has also been reported (13, 16, 20), but others find, as do we, that AS160 phosphorylation is not reduced in human obesity (55).
The pathophysiology of obesity appears to be inherently different from paradigms of acute insulin resistance induced by lipid infusion or brief, excess lipid exposure that have been employed as a model to explain chronic human insulin resistance (8, 56, 57). This model has served to cement the role of proximal insulin signaling defects, resulting in reduced Akt activation, as the cause of reduced muscle glucose uptake, and these findings have been extrapolated to the pathophysiology of muscle insulin resistance in human obesity. Our study and a few others (18, 19) implicate an alternative mechanism of muscle insulin resistance development in obesity. We suggest that chronic muscle insulin resistance in obesity is not the result of defects in insulin signaling at the level of Akt or AS160, but distal to AS160 or in the alternative pathway such as the Rac-1 pathway.
It has been reported that insulin regulates 2 different events in GLUT4 intracellular pools—the increased availability of insulin responsive vesicles and the mobilization of the vesicles to the plasma membrane (58). In the absence of insulin, GLUT4 resides in storage vesicles in the sarcoplasm. In response to insulin, 20% of the GLUT4 present in the sarcoplasm translocates to the plasma membrane in cell models (58). The recycling process of endocytosis and exocytosis of these storage vesicles is thought to mediate glucose uptake (59, 60). Although the complex process of GLUT4 trafficking and vesicle fusion is still being unraveled, we measured total GLUT4 protein to determine if the muscle tissue of our obese volunteers had large reductions in this essential protein. We found that total GLUT4 protein content was 17% less (P = 0.047) in the obese group, a difference that seems unlikely to result in the observed 60% reduction in muscle glucose uptake in obese subjects compared with nonobese subjects. If the various intracellular pools of GLUT4 could be sufficiently well-fractionated from human muscle biopsies this would help determine whether the small reduction in GLUT4 we observed in the obese group is in the insulin-responsive pool, and thus relevant to the reduced glucose uptake in obesity. Unfortunately, this was not possible with our muscle biopsy samples.
The reduced glucose uptake in obesity with normal Akt phosphorylation suggests an alternate pathway for GLUT4 translocation may be important, and several observations support the concept that GLUT4 translocation occurs via both Akt-dependent and Akt-independent pathways. There have been efforts to understand the noncanonical pathway of GLUT4 translocation. Gonzalez et al (61) reported a divergence in the insulin pathway, one path requiring PI3K but not Akt. Downstream of PI3K, parallel to, but independent of Akt activation, the Rho-family small GTPase Rac-1 is stimulated by insulin and muscle contraction (62). Rac-1 activation has been implicated in GLUT4 translocation (63). Rac-1 activation also induces actin filament branching and remodeling that influences GLUT4 translocation (64-67). While the presence of defects in Akt phosphorylation is the prevailing paradigm for impaired insulin signaling in obesity, some cell model/animal model experimental results are consistent with our findings that Akt phosphorylation remains intact. Turner et al (68) found comparable muscle Akt phosphorylation in response to a hyperinsulinemic-euglycemic clamp in mice after a high-fat diet in the presence of reduced muscle glucose uptake. In addition, it has been reported that insulin can stimulate glucose uptake in Akt deficient mice (31), further supporting the concept that Akt is not the sole, obligate step in insulin signaling for this pathway.
In order to interrogate our Akt measurements in a second manner we measured GSK3β phosphorylation. Akt phosphorylation at serine residues inactivates GSK3β (69), leading to the dephosphorylation of glycogen synthase and stimulation of glycogen synthesis. We found no differences in GSK3β phosphorylation between nonobese and obese groups. Although this pathway can also be activated by different stimuli, it serves as a secondary measurement of the PI3K dependent pathway (70-72).
We also report an interesting finding with regards to the rapid onset of insulin signaling pathway, in that the initial phosphorylation of Akt (and AS160 and GSK3 β) at 30 minutes was maintained for the entire 5 hours of the insulin clamp. In addition, the fold change of Akt and AS160 phosphorylation were significantly correlated between the 30-minute and 5-hour time points, indicating that the level of activation remains proportional and stable in human muscle. These results also support our protein analysis in terms of precision and accuracy.
The results from the phosphoproteomic analysis are supportive of our suggestion that abnormalities in an Akt-independent pathway may be responsible for reduced GLUT4 translocation in obesity. The nontargeted screening of phosphorylated proteins in skeletal muscle revealed differences in the actin cytoskeleton signaling pathway between obese and nonobese subjects that were matched for high Akt phosphorylation responses, but markedly different for glucose uptake in response to the insulin clamp. Among these proteins, we confirmed that PAK-1, which was identified by phosphoproteomic analysis, was also different by capillary Western analysis (61, 62). Although the difference was not statistically significant, the PAK-1 phosphorylation was greater in the samples from the obese compared with the nonobese group. We suggest that this modest evidence of problems with normal vesicular trafficking of GLUT-4 containing vesicles to the plasma membrane. Even intact Akt and AS160 responses are insufficient to allow normal GLUT-4 mediated muscle glucose uptake (Supplemental Figure 3) (32).
There are some limitations to this study. We were unable to successfully measure IRS-1 phosphorylation responses in our muscle samples, and thus cannot be sure that more proximal steps in insulin signaling were similar in our obese and nonobese volunteers. It is possible that IRS-1 signaling was impaired in the obese group, although how Akt signaling would be intact is unclear. In addition, although we did not measure the first phosphorylation site on Akt (Thr308) or Akt2 –specific Thr309 measurement of phosphorylation on the second residue Ser473or Ser474 has been established as sufficient for the purposes of redundancy and significance for activation of Akt (40). One might question our use of capillary Western technology, which is not as widely used as traditional Western blots. However, we and others have validated its use (Supplemental Figure 4 (32)) and find excellent precision relative to standard Western blots of skeletal and adipose tissue (29, 73, 74). Another limitation is that there was a wide variation in baseline muscle Akt phosphorylation levels. The 15% to 20% CV in intra-assay variability should also be acknowledged as a limitation of this study; however, the sample size of this study is substantial and the multiple analyses that align with each other should assuage this concern. Analyzing fold change can blunt or exaggerate between-subject variability; however, when comparing absolute increase in phosphorylation from baseline to the 30-minute time point, or baseline to 5 hours, there were still no significant differences between nonobese and obese (P = 0.24 and P = 0.33), respectively.
In summary, we found that in response to hyperinsulinemia, obese humans with marked impairment in insulin-stimulated muscle glucose uptake had normal muscle Akt and AS160 phosphorylation compared with a nonobese control group. Our data suggest that reduced insulin-stimulated muscle glucose uptake in obesity is the result of a more complex interplay between different signaling processes and architectural changes in muscle. In the future, studies that investigate processes beyond AS160 in the insulin signaling pathway or in the parallel pathway that results in the GLUT4 translocation will be needed. An understanding of the insulin response defects in obesity should focus more broadly than the proximal insulin signaling pathway to understand the reduced insulin sensitivity in obese humans.
Abbreviations
- ANOVA
analysis of variance
- CRTU
Clinical Research and Trials Unit
- CV
coefficient of variation
- FFM
fat-free mass
- GLUT4
glucose transporter type 4
- GSK3β
glycogen synthase kinase 3β
- ICG
indocyanine green
- IRS
insulin receptor substrate
- PI3K
phosphoinositide-3 kinase
- Rd
total peripheral glucose disposal
- Si
insulin sensitivity for glucose disposal
Acknowledgments
M.D.J. and N.L. designed research (project conception, development of overall research plan, and study oversight). P.R., K.A.L., D.D., and S.N. conducted research (hands-on conduct of the experiments and data collection). M.D.J., P.R., K.A.L, and S.N. analyzed data or performed statistical analysis. M.D.J., P.R., K.A.L., D.D., N.L., and S.N. wrote the paper. M.D.J. had primary responsibility for final content. M.D.J. is the guarantor of this work and, as such, had full access to all the data in the study and takes responsibility for the integrity of the data and the accuracy of the data analysis. All authors have read and approved the final manuscript.
The authors thank the research volunteers for participating. The authors also thank the following Mayo Clinic (Rochester, MN) employees: Lendia Zhou, Debra Harteneck, Barb Norby, Pam Reich, Sarah Wolhart, Natalie Moore, Katharine Hitziger, and the Mayo Clinic CRTU nursing staff.
Financial Support: These studies were supported by National Center for Research Resources Grant 1UL1RR024150, National Institutes of Health Grants, DK45343 and 5T32 DK007352. The content is solely the responsibility of the authors and does not necessarily represent the official views of the National Institutes of Health.
Additional Information
Disclosure Summary: The authors have nothing to disclose.
Data Availability
The datasets generated during and/or analyzed during the current study are not publicly available but are available from the corresponding author on reasonable request.
References
