


Abstract
Impaired sensitivity to the antilipolytic action of insulin in adipose tissue (AT) may play a role in determining metabolic dysfunction in polycystic ovary syndrome (PCOS).
To test the hypothesis that insulin resistance (IR) in AT is associated with whole-body insulin sensitivity and β-cell function in PCOS.
Prospective cross-sectional study.
Eighteen participants with PCOS and 18-matched control participants underwent a modified frequently sampled intravenous glucose tolerance test (mFSIVGTT); subgroups underwent single-slice computed tomography scans determining AT distribution and adipocyte glucose transporter type 4 (GLUT-4) expression.
IR in AT in basal (by the adipose insulin resistance index [Adipo-IR]) and dynamic (mFSIVGTT-derived indices of insulin-mediated nonesterified fatty acids [NEFA] suppression [NEFAnadir, TIMEnadir, and %NEFAsupp]) states; whole-body insulin-mediated glucose uptake and insulin secretion in basal (by homeostatic model assessment [HOMA]-IR and HOMA-β%) and dynamic (mFSIVGTT-derived insulin sensitivity index [Si], acute insulin response to glucose [AIRg], and disposition index [Di]) states.
Participants with PCOS had higher HOMA-IR and HOMA-β%, lower Si and Di, higher longer TIMEnadir, higher Adipo-IR and NEFAnadir, and a trend toward lower GLUT-4, than the control group participants. Adipo-IR was associated with dynamic state IR in AT (NEFAnadir TIMEnadir, and %NEFAsupp), but only in PCOS, and with HOMA-IR and HOMA-β% in both groups. NEFAnadir and TIMEnadir were negatively and %NEFAsupp positively associated with Si only in PCOS, but not with AIRg and Di, or GLUT-4 expression.
Women with PCOS demonstrated increased IR in AT, which is closely associated with whole-body IR but not with dynamic state β-cell function or adipocyte GLUT-4 gene expression.
The polycystic ovary syndrome (PCOS) is one of the most common endocrine-metabolic disorders, occurring in 10% to 20% of reproductive-aged women (1) and is characterized by hyperandrogenism, chronic oligoovulation, and polycystic ovary morphology (2). More than two-thirds of women with PCOS also demonstrate insulin resistance (IR) and compensatory hyperinsulinemia, above and beyond that determined by their degree of obesity (3); which increase these women’s risk for type 2 diabetes (T2DM) (4) and metabolic syndrome (5). Despite the link between PCOS and IR, the underlying cause of IR or β-cell dysfunction in PCOS remains largely unknown.
Although adipose tissue (AT) is critical in maintaining metabolic homeostasis, IR and β-cell dysfunction in PCOS cannot be completely explained by general obesity or abdominal adiposity (6, 7). We recently observed that women with PCOS manifest dysregulated plasma nonesterified fatty acids (NEFA) kinetics, reflecting impaired AT lipodystrophy (8), impaired glucose transporter type 4 (GLUT-4) gene expression (9), and insulin-mediated glucose transport (10, 11) in adipocytes, highlighting the role AT dysfunction can play in the PCOS-related IR.
Insulin plays a critical role in the regulation of AT function, including regulation of glucose uptake via translocation of GLUT-4 vesicles to the cell membranes in insulin-sensitive tissues, including the adipocytes, skeletal muscle and the liver; hepatic glycogenesis; promotion of lipogenesis; and buffering of diurnal fluxes in circulating NEFA in response to energy needs. However, studies of metabolic dysfunction in PCOS primarily focus on impaired glucose disposal and peripheral IR in muscle (6, 7) and the liver (12).
Nonetheless, we note that abnormalities in insulin-mediated regulation of lipolysis and suppression of circulating NEFA levels also play important roles in the development of IR and T2DM (13-16). In participants without PCOS, several studies have indicated that impaired suppression of lipolysis and circulating NEFA despite hyperinsulinemia, reflecting IR in AT, results in NEFA-related lipotoxicity-mediated IR in skeletal muscle and the liver (17, 18). However, the impact of elevated circulating NEFA levels on β-cell function is not as clear. Others have also reported lipotoxicity-mediated β-cell dysfunction in response to excess NEFA exposure (19-23), although not all agree (24, 25).
NEFA kinetics in the circulation primarily reflect the action of insulin on AT (26, 27). The trajectory of NEFA kinetics in response to glucose and insulin fluxes during modified frequently sampled intravenous (IV) glucose tolerance test (mFSIVGTT) and minimal modeling has been described in the general population by Boston and Moate (26) and in women with PCOS by Ezeh et al (8). However, the sensitivity of adipocytes to circulating insulin levels (ie, adipocyte insulin sensitivity), which determines the extent to which insulin suppresses lipolysis and circulating NEFA levels, has not been assessed. In the present study, we test the hypothesis that impaired adipocyte sensitivity to the antilipolytic action of insulin and mobilization of NEFA in PCOS (ie, reflecting IR in AT) is associated with decreased whole-body insulin-mediated glucose uptake and β-cell dysfunction in these women.
Participants and Methods
Study population and protocol
Thirty-six participants (18 healthy participants in the control group and 18 participants with PCOS) aged 22 to 44 years were prospectively and consecutively recruited for the study. The 2 groups were matched for age, body mass index (BMI), and race. The diagnosis of PCOS was made according to the 1990 National Institutes of Health consensus criteria (ie, phenotypes A and B of the Rotterdam criteria (28)), namely the presence of oligoovulation and biochemical or clinical hyperandrogenism, excluding other known endocrinopathies, as previously described (29). Healthy premenopausal women with long-term eumenorrhea and no evidence of hyperandrogenism or endocrine disorders were recruited as control participants. None of the women were pregnant or taking any hormonal medication (including oral contraceptives, metformin) for at least 3 months preceding the evaluation. All participants had normal thyroid-stimulating hormone, 17-hydroxyprogesterone, and prolactin levels and underwent a standard 75-g oral glucose tolerance test to exclude T2DM.
Research participants were recruited through advertisements or, for PCOS, the clinical and research practice of the Center for Androgen-Related Disorder at Cedars-Sinai Medical Center, Los Angeles. To ensure comparable groups, we began to prospectively recruit participants with PCOS first, and matching participants for the control group were subsequently sought, either from a previously recruited pool of control participants or through new recruitment. An attempt was made to closely match participants with PCOS and participants for controls within narrow ranges (ie, ±3 kg/M2 in BMI, ±5 years in age, and similar race) (7, 11). Both the participants with PCOS and the participants in the control group were recruited over a similar period of time.
All participants underwent a physical examination with blood sampling for hormone measurements, as previously described (30), and were normoglycemic. In addition to height, weight, and modified Ferriman-Gallwey (mF-G) score, waist circumference was measured at the narrowest portion of the torso approximately midway between the lower costal margin and the iliac crest, and the hip circumference was measured over the widest portion of the gluteal and greater trochanteric region. The BMI and waist to hip ratio were then calculated.
Fasting blood samples for circulating total testosterone (total T), free testosterone (free T), dehydroepiandrosterone sulfate (DHEAS), insulin, and glucose concentrations were obtained on days 3 through 8 of the menstrual cycle (ie, the follicular phase).
Participants also underwent an FSIVGTT and a subcutaneous (sc) AT biopsy (see below). However, because of the invasiveness of the biopsy, not all participants who had an FSIVGTT also agreed to undergo a fat biopsy. The study protocol was approved by the Institutional Review Boards of Cedars-Sinai Medical Center. All participants provided written informed consent before participating in the study.
Modified frequently sampled IV glucose tolerance test
All participants underwent a modified FSIVGTT (mFSIVGTT) on days 3 through 8 of a spontaneous or induced withdrawal bleed. In brief, after an overnight fast, one IV catheter was placed in each forearm (one for blood sampling and the other for glucose and insulin infusion) between 8:00 am and 9:00 am. Thereafter, IV glucose (0.3 g/kg) was injected at time 0 minutes followed by an IV bolus of regular insulin (0.03 U/kg) at time 20 minutes. Blood samples (2.0 mL) were collected from −20 minutes (relative to the time of glucose administration) to +180 minutes. Plasma samples were drawn into prechilled tubes containing ethylenediaminetetraacetic acid (for insulin), sodium fluoride potassium oxalate (for glucose), or paraoxon (for NEFA), and samples were frozen at −80°C until assayed. After assaying the plasma glucose, insulin, and total NEFA, the levels at −20, −15 and 0 minutes were averaged to yield respective fasting values. Data were additionally analyzed using minimal models to determine glucose/insulin interactions in a single assay (31), as described below.
Determination of whole-body basal state IR and β-cell function
Basal state insulin sensitivity and β-cell function were assessed by the homeostasis model of assessment for IR (HOMA-IR) and insulin secretion (HOMA-β%), calculated from fasting glucose and insulin levels, as previously described (32).
Determination of basal state IR in AT
Basal state IR in AT was estimated by the adipose insulin resistance index (Adipo-IR = fasting plasma insulin level [INS0] × basal NEFA level [NEFA0]), as previously described (33-35). NEFA0 was calculated as the average of NEFA levels obtained prior to the administration of glucose during mFSIVGTT. Overall, the higher the Adipo-IR value, the greater the degree of IR in AT.
Determination of whole-body dynamic state IR and β-cell function
Whole-body glucose/insulin kinetics were determined using the minimal model calculation based on the mFSIVGTT results, as previously described (31). Estimates of whole-body glucose/insulin kinetics include: (a) acute insulin response to glucose (AIRg), the first phase endogenous insulin secretion in response to a bolus glucose infusion; (b) insulin sensitivity index (Si), the extent of insulin-mediated glucose uptake and suppression of glucose production; (c) glucose effectiveness (Sg), the combined capacity of glucose to mediate its own glucose uptake and suppress endogenous glucose production at basal (fasting) insulin levels; and (d) disposition index (Di), the ability of the β-cell to compensate for the prevailing peripheral IR (ie, Di = Si × AIRg), a robust measure of long-term β-cell function.
Determination of dynamic state IR in AT
Dynamic state IR in AT was estimated by the degree of insulin-mediated suppression in NEFA levels during the mFSIVGTT (14, 36, 37), including: (a) the nadir in NEFA levels (NEFAnadir), the lowest plasma NEFA levels observed; (b) the time it took for NEFA levels to reach nadir (TIMEnadir); and (c) the percentage suppression in plasma NEFA levels from baseline to nadir (%NEFAsupp), as calculated below:
Overall, the higher the NEFAnadir level (ie, less suppression), the longer the TIMEnadir, and the lower the %NEFAsupp, the greater the degree of IR in AT.
Adipocyte culture and real-time polymerase chain reaction
Approximately 5 gm sc AT was excised through a 1.5-cm incision in the lower abdomen (38). Adipocytes were isolated from AT as previously described (11, 39, 40). Briefly, specimens were immediately transported to the laboratory in a HEPES salt buffer containing 4% bovine serum albumin and 2 mM pyruvate (pH 7.4) and were subsequently finely minced. The minced AT was treated with collagenase at a ratio of 3.5 mg/g of tissue and incubated for 60 minutes at 37°C in a rotary shaking bath at 100 rpm. The cell suspension was then filtered through a premoistened 400-μm nylon mesh (Small Parts, Inc, Miami Lakes, FL) to isolate the adipocytes, and the cells were washed twice for 2 minutes at 50 × g at room temperature. After the second wash, the cells were refiltered through nylon mesh. After adipocytes were isolated from AT, and ribonucleic acid (RNA) was extracted, GLUT-4 messenger RNA (mRNA) was assessed by real-time quantitative reverse transcriptase–polymerase chain reaction as previously described (11, 39, 40). Data were normalized to the housekeeping gene human ACTB (ie, β-actin as the internal control). Primers for human ACTB and GLUT4 were purchased from SA Bioscience (Frederick, MD). Relative fold change of mRNA expression of targeted genes (relative to human ACTB expression) was calculated by using delta Ct method, as previously described (11).
Assessment of total, visceral, and subcutaneous fat content
We determined sc AT (SAT), visceral AT (VAT), and total AT (TAT) content by a single-slice computerized axial tomography (CAT) scan in 14 participants with PCOS and 7 control participants, as previously described (6, 41). All the participants that underwent an abdominal SAT biopsy also underwent an abdominal CAT scan.
Biochemical analysis
Total T was measured using high-turbulence liquid chromatography–tandem mass spectrometry, and free T was determined by equilibrium dialysis (Quest Diagnostics, San Juan Capistrano, CA), as previously described (42). The serum levels of DHEAS were measured by a competitive immunoassay (Modular E170; Roche Diagnostics, Indianapolis, IN). Plasma insulin was assayed by chemiluminescence (ADVIA Centaur chemiluminescent immunoassay system; Siemens Healthcare, Deerfield, IN), and glucose levels were measured using the hexokinase/glucose-6-phosphate dehydrogenase method (Roche Applied Sciences, Indianapolis, IN). Samples, except for glucose, were batched at regular intervals for analysis to minimize the impact of interassay variability.
Statistical analysis
The Shapiro-Wilks W test was used to determine whether continuous variables were normally distributed. All continuous variables, except for the mF-G score, reasonably followed a parametric distribution on the original or log scale, with 3 variables needing log transformation (HOMA–%β-cell, AIRg, and Si). Intergroup differences were evaluated using the unpaired t test for normally distributed continuous variables or the Wilcoxon rank sum test for mF-G score. A χ2 test was used to compare nominal variables.
Bivariate correlations between basal (Adipo-IR) and dynamic (NEFAnadir, TIMEnadir, and %NEFAsupp) measures of IR in AT or between measures of IR in AT and parameters of insulin sensitivity and β-cell function and measures of hyperandrogenism and adipocyte GLUT-4 mRNA expression in participants with PCOS and control participants were analyzed using the Pearson correlation coefficient for all variables. Data were expressed as mean ± standard error or geometrical mean (range) if log transformed. A 2-sided P < 0.05 was considered statistically significant. All statistical analyses were conducted using the Stats Direct statistics software package, version 2.7.8 2010 (Cheshire, UK).
Adipo-IR was used as the primary outcome measure for the purpose of determining the sample size. A power analysis with a pooled standard deviation of 3.41, a β = 0.20, and α = 0.05, based on t testing, indicated that a sample size of 17 participants per group was sufficient to detect a mean difference of 5.78 (mmol/L • µIU/mL) in Adipo-IR between the PCOS and control groups.
Results
Baseline features of the study groups
The basic demographic, anthropometric, and endocrine characteristics of the participants are summarized in Table 1. By design, there were no differences in mean age, BMI, waist to hip ratio, or racial composition between the PCOS and control groups. Overall, participants were mostly overweight (≥25 kg/m2) or obese (≥30 kg/m2). There was no significant difference in the number of participants who were either overweight or obese (PCOS group: 16 of 18 [88.9%] vs control group 14 of 18 [77.9%]).
Anthropometric, Endocrine, and Metabolic Characteristics of Study Participants
| Entire Cohort | GLUT-4 Expression Subgroup | ||||||
|---|---|---|---|---|---|---|---|
| Variable | PCOS (n = 18) | Controls (n = 18) | P Value | P Value (Adjusted for BMI) | PCOS (n = 5) | Controls (n = 5) | P Value |
| Age (years) | 30.1 ± 1.3 | 31.8 ± 1.6 | 0.417 | N/A | 29.1 ± 1.1 | 34.4 ± 3.8 | 0.221 |
| BMI (kg/m2) | 33.7 ± 1.9 | 29.5 ± 1.5 | 0.101 | N/A | 32.4 ± 0.0 | 33.3 ± 0.7 | 0.639 |
| WHR | 0.88 ± 0.02 | 0.83 ± 0.02 | 0.137 | N/A | 0.93 ± 0.02 | 0.92 ± 0.04 | 0.966 |
| African American | 2 | 2 | N/A | N/A | 0 | 1 | N/A |
| Hispanic American | 7 | 7 | N/A | N/A | 3 | 1 | N/A |
| Non-Hispanic White | 9 | 9 | N/A | N/A | 2 | 3 | N/A |
| VAT (cm2)a | 148.2 ± 20.7 | 111.7 ± 25.7 | 0.302 | N/A | 158.2 ± 24.8 | 136.9 ± 16.9 | 0.491 |
| SAT (cm2)a | 458.1 ± 49.7 | 382.9 ± 77.2 | 0.408 | N/A | 426.8 ± 59.4 | 483.9 ± 41.8 | 0.454 |
| TAT (cm2)a | 606.4 ± 63.9 | 494.7 ± 102.8 | 0.346 | N/A | 585.4 ± 64.7 | 620.8 ± 52.8 | 0.682 |
| mF-G score | 7.8 ± 1.5 | 0.8 ± 0.3 | <0.001 | <0.001 | 6.8 ± 1.8 | 1.6 ± 0.0 | 0.035 |
| Free T (pg/mL) | 5.3 ± 0.5 | 2.5 ± 0.4 | <0.001 | <0.005 | 5.8 ± 1.3 | 2.2 ± 0.2 | 0.026 |
| Total T (ng/dL) | 45.4 ± 7.7 | 26.4 ± 3.4 | 0.035 | 0.309 | 32.4 ± 3.7 | 22.6 ± 2.8 | 0.036 |
| DHEAS (ug/dL) | 276.5 ± 27.0 | 202.0 ± 29.4 | 0.070 | 0.017 | 299.6 ± 27.2 | 145.3 ± 34.9 | 0.009 |
| Fasting glucose (mg/dL) | 91.6 ± 3.2 | 89.1 ± 1.6 | 0.486 | 0.096 | 94.6 ± 4.7 | 88.2 ± 3.5 | 0.310 |
| INS0(µIU/mL) | 15.9 ± 2.8 | 5.4 ± 0.8 | 0.001 | 0.006 | 17.8 ± 5.6 | 7.7 ± 2.1 | 0.066 |
| HOMA-IR | 3.64 ± 0.66 | 1.20 ± 0.18 | <0.001 | 0.004 | 4.00 ± 1.12 | 1.74 ± 0.51 | 0.067 |
| HOMA-β%b | 59.4 (8.2-176.5) | 18.5 (2.8-43.8) | <0.001 | 0.002 | 67.4 (29.6-157.5) | 27.1 (10.0-53.9) | 0.099 |
| Si(min–1. µU–1∙ mL–1) | 2.96 ± 0.56 | 6.45 ± 0.90 | 0.002 | 0.011 | 1.42 ± 0.35 | 3.85 ± 0.86 | 0.030 |
| Sg(min–1) | 0.0195 ± 0.0023 | 0.0247 ± 0.0030 | 0.173 | 0.340 | 0.0235 ± 0.0029 | 0.0259 ± 0.0051 | 0.821 |
| AIRg(µU–1/mL)b | 554.9 (65.7-1833.3) | 434.5 (34.5-1320.0) | 0.402 | 0.814 | 702.5 (274.1-1173.8) | 434.5 (343.0-1040.0) | 0.918 |
| Di | 1206 ± 210 | 2075 ± 375 | 0.026 | 0.041 | 930 ± 228 | 2128 ± 327 | 0.017 |
| NEFA0(mmol/L) | 0.505 ± 0.036 | 0.504 ± 0.052 | 0.987 | 0.649 | 0.567 ± 0.085 | 0.578 ± 0.134 | 0.946 |
| Adipo-IR (mmol/L ∙ µIU/mL) | 8.27 ± 2.59 | 2.49 ± 0.39 | 0.034 | 0.013 | 15.5 ± 8.2 | 3.7 ± 0.8 | 0.059 |
| NEFAnadir(mmol/L) | 0.092 ± 0.017 | 0.069 ± 0.013 | 0.069 | 0.022 | 0.127 ± 0.038 | 0.053 ± 0.015 | 0.041 |
| TIMEnadir(mins) | 69.7 ± 4.3 | 49.8 ± 3.3 | <0.001 | 0.002 | 74.0 ± 7.5 | 56.0 ± 2.5 | 0.038 |
| %NEFAsupp | 80.7 ± 4.0 | 85.5 ± 2.7 | 0.322 | 0.098 | 78.3 ± 3.8 | 89.2 ± 3.2 | 0.061 |
For this analysis P < 0.05 is considered significant. P values in italics and bold are considered statistically significant.
To convert values for insulin to pmol/L, multiply by 6.945 (69).
Abbreviations: AIRg, acute insulin response to glucose; BMI, body mass index; DHEAS, dehydroepiandrosterone sulfate; GLUT-4, glucose transporter type 4; HOMA, homeostatic model assessment; INS0, fasting plasma insulin level; mF-G, modified Ferriman-Gallwey; IR, insulin resistance; N/A, not applicable; NEFA0, basal level of nonesterified fatty acids; NEFAsupp, NEFA suppression; PCOS, polycystic ovary syndrome; SAT, subcutaneous adipose tissue; Sg, glucose effectiveness; Si, insulin sensitivity index; T, testosterone; TAT, total adipose tissue; VAT, visceral adipose tissute; WHR, waist to hip ratio.
aVariables are expressed as mean ± SE; others as numbers or percentage (and range).
bGeometric means, the antilog of the log scale mean, is reported for log-transformed data.
Despite lack of significant difference in mean BMI between PCOS and control women (33.7 ± 1.9 vs 29.5 ± 1.5, respectively; P = 0.101), after the matching, a numerical difference in mean BMI occurred even when we imposed on ourselves a narrow age window (BMI ± 3 kg/m2) for recruiting control participants because there were more participants with PCOS coming in who were in the upper part of the window (ie, plus 3 kg/m2) than in the bottom part of the window (ie, minus 3 kg/m2). Nevertheless, the adjustment for BMI among the entire groups did not change the estimated differences in the outcome variables between the PCOS and control groups but enhanced the difference for NEFAnadir (Table 1).
Assessment of fat distribution by CAT scan was performed in 14 participants with PCOS and 7 control participants, including all 10 participants who also underwent assessment of GLUT-4 mRNA expression in AT; in this subgroup, VAT, SAT, and TAT were similar between the PCOS and control groups. As expected, mF-G scores and baseline mean serum total T, free T, and DHEAS levels were higher in the PCOS group than in the control group. However, total T was similar between the 2 groups after adjustment for BMI. Overall, similar results were obtained in the subgroup of participants (5 of the 18 participants with PCOS and 5 of the 18 control participants) who underwent an sc abdominal AT biopsy for GLUT-4 mRNA expression.
Whole-body metabolic function in the PCOS and control groups
The whole-body metabolic characteristics of the participants are depicted in Table 1. Fasting plasma glucose levels were similar, consistent with a nondiabetic population. Basal measures of whole-body insulin action and secretion (HOMA-IR and INS0, and HOMA-β%) were higher in participants with PCOS than in control participants (Table 1). Among the subgroup that underwent SAT abdominal biopsy, INS0 and HOMA-IR were approximately 2.3-fold higher and HOMA-β% 2.5-fold higher in the PCOS group compared with the control group, although the difference did not reach significance (with P values ranging from 0.066 to 0.099), likely due to the small number of participants in this subgroup (Table 1).
Assessing whole-body insulin-mediated glucose uptake (ie, insulin sensitivity) and β-cell function in the dynamic state, we observed that Si and Di were lower, although AIRg was similar between the groups (Table 1). In contrast, systemic non–insulin-mediated glucose uptake, measured by glucose effectiveness (Sg), was similar between the PCOS and control groups. Similar results were found in the subgroup of participants undergoing an abdominal biopsy for GLUT-4 mRNA expression (Table 1).
Measures of IR in AT in the PCOS and control groups
The mean values of measures of IR in AT are depicted in Table 1 and Fig. 1. The mean Adipo-IR value was 3.3-fold greater in the PCOS group than in the control group (Fig. 1A), mostly due to higher INS0 in the former, since NEFA0 were similar between the 2 groups (Table 1). NEFAnadir tended to be higher (P = 0.069) (Fig. 1B) but was higher after logarithmic transformation and adjustment for BMI (Table 1), and TIMEnadir was longer in the PCOS group compared with the control group (Fig. 1C), consistent with diminished insulin-mediated NEFA suppression in AT, although there was no difference in %NEFAsupp between the 2 groups (Fig. 1D). Overall, the results were similar in the subgroup undergoing an abdominal biopsy for GLUT-4 (Table 1).
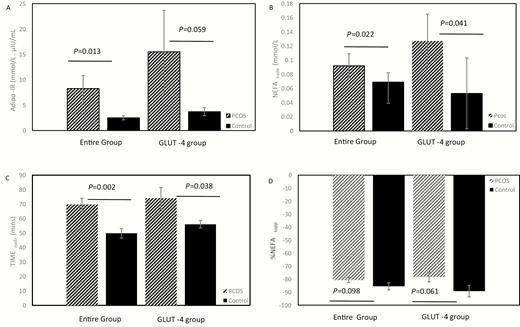
Differences in measures of IR in AT between PCOS and controls. (A-D) Participants in the entire cohort (18 PCOS and 18 matched controls) are depicted on the left 2 bars, and participants in the GLUT-4 gene expression subgroup (5 PCOS and 5 matched controls) are depicted on the right 2 bars. Mean ± standard error, with adjustment for BMI, are depicted for Adipo-IR (Fig. 1A), NEFAnadir (Fig. 1B), TIMEnadir (Fig. 1C) and %NEFAsupp. (Fig. 1D). Adipo, adipose; AT, adipose tissue; BMI, body mass index; GLUT-4, glucose transporter type 4; IR, insulin resistance; mins, minutes; NEFA, nonesterified fatty acids; NEFAsupp, NEFA suppression; PCOS, polycystic ovary syndrome.
Relationship between basal and dynamic measures of IR in AT
The relationship of Adipo-IR, INS0, and NEFA0 with mFSIVGTT-derived measures of IR in AT (ie, NEFAnadir, TIMEnadir, and %NEFAsupp) was assessed in bivalent analysis (43). Basal IR in AT (Adipo-IR), but not NEFA0, correlated positively with NEFAnadir (r = 0.58; P = 0.012) and TIMEnadir (r = 0.53; P=0.023) and negatively with %NEFAsupp (r = –0.72; P = 0.001) but only in the PCOS group. INS0 was similarly associated with dynamic measures of IR in AT, although it was also associated with NEFAnadir in the control group. Overall, Adipo-IR, but not NEFA0, demonstrated a strong correlation with indices of insulin-mediated NEFA suppression in the PCOS group only.
Relationship between basal and dynamic measures of insulin sensitivity and β-cell function
We next assessed relationships in alterations in whole-body glucose metabolism with respect to insulin sensitivity and β-cell function (43). HOMA-IR correlated negatively with Si in the PCOS group (r = –0.56; P = 0.017) and the control group (r = –0.71; P=< 0.001). HOMA-β% was positively associated with AIRg in the PCOS group (r = 0.55; P = 0.019) and the control group (r = 0.76; P = 0.001). Alternatively, HOMA-β% was not associated with Di in either the PCOS group (r = 0.07; P = 0.759) or the control group (r = 0.30; P = 0.231). The results were similar when these variables were logarithmically transformed (data not shown).
Relationship of measures of IR in AT with measures of whole-body IR and β-cell function
The relation of measures of IR in AT with measures of whole-body IR and β-cell function are depicted in Table 2. Adipo-IR correlated positively with HOMA-IR and HOMA-β% and negatively with Si, but not Di, in both the PCOS and control groups and correlated positively with AIRg in the control group only. Considering basal measures of whole-body IR and β-cell function, NEFAnadir and TIMEnadir correlated positively with HOMA-IR and HOMA-β%, albeit the association of NEFAnadir with HOMA-β% did not reach significance. %NEFAsupp demonstrated no association with either of these parameters in either group. NEFAnadir and TIMEnadir correlated negatively, and %NEFAsupp correlated positively with Si in the PCOS participants only and were not associated with either dynamic state measures of β-cell function (ie, AIRg and Di) in either group. NEFA0 demonstrated no relationship with any of the measures in either group.
Correlations of Measures of IR in AT With Basal and Dynamic State Measures of Whole-Body IR and Insulin Secretion
| PCOS (n = 18) | Control (n = 18) | |||
|---|---|---|---|---|
| HOMA-IR | ||||
| Measures of IR in AT | r | P Value | r | P Value |
| NEFA | 0.33 | 0.202 | –0.38 | 0.126 |
| Adipo-IR | 0.65 | 0.005 | 0.64 | 0.004 |
| log HOMA-β% | ||||
| NEFA0 | 0.38 | 0.128 | –0.33 | 0.180 |
| Adipo-IR | 0.60 | 0.010 | 0.67 | 0.002 |
| log AIRg | ||||
| NEFA0 | 0.27 | 0.30 | –0.21 | 0.396 |
| Adipo-IR | 0.37 | 0.15 | 0.69 | 0.002 |
| NEFAnadir | 0.30 | 0.248 | –0.06 | 0.826 |
| TIMEnadir | 0.36 | 0.161 | 0.24 | 0.333 |
| %NEFAsupp | -0.15 | 0.571 | –0.01 | 0.980 |
| log Si | ||||
| NEFA0 | –0.33 | 0.192 | 0.07 | 0.77 0 |
| Adipo-IR | –0.7 | 0.002 | –0.65 | 0.004 |
| NEFAnadir | –0.62 | 0.008 | 0.05 | 0.849 |
| TIMEnadir | –0.73 | <0.001 | –0.21 | 0.418 |
| %NEFAsupp | 0.6 0 | 0.011 | –0.07 | 0.773 |
| Di | ||||
| NEFA0 | –0.04 | 0.875 | –0.18 | 0.476 |
| Adipo-IR | –0.27 | 0.303 | 0.27 | 0.277 |
| NEFAnadir | –0.26 | 0.320 | 0.16 | 0.516 |
| TIMEnadir | –0.43 | 0.086 | 0.06 | 0.819 |
| %NEFAsupp | 0.34 | 0.179 | –0.24 | 0.334 |
P values in italics and bold are considered statistically significant.
Abbreviations: Adipo, adipose; AT, adipose tissue; DHEAS, dehydroepiandrosterone sulfate; IR, insulin resistance; NEFA0, basal level of nonesterified fatty acids; NEFAsupp, NEFA suppression; PCOS, polycystic ovary syndrome; T, testosterone.
Relationship between measures of hyperandrogenemia and IR in AT
To analyze the role of androgens in IR in AT, we assessed the relationship between measures of hyperandrogenemia with IR in AT (Table 3). Free T levels correlated positively with NEFA0, Adipo-IR, and NEFAnadir in the PCOS group only. In contrast, DHEAS was weakly and negatively correlated with TIMEnadir in the PCOS group and with NEFAnadir in the control group. There was no correlation between total T and NEFA0 or markers of IR in AT in the PCOS or control groups. None of the measures of hyperandrogenemia correlated with %NEFAsupp.
Correlation of Circulating Androgens with Measures of IR in AT
| Free T (pg/mL) | Total T (ng/dL) | DHEAS (ug/dL) | ||||
|---|---|---|---|---|---|---|
| r | P Value | r | P Value | r | P Value | |
| PCOS (n =18) | ||||||
| NEFA0 | 0.58 | 0.015 | 0.16 | 0.529 | 0.09 | 0.735 |
| Adipo-IR | 0.71 | 0.001 | 0.08 | 0.769 | –0.26 | 0.319 |
| NEFAnadir | 0.49 | 0.045 | –0.01 | 0.951 | –0.46 | 0.061 |
| TIMEnadir | 0.31 | 0.226 | –0.16 | 0.554 | –0.57 | 0.017 |
| %NEFAsup | –0.15 | 0.556 | 0.06 | 0.831 | 0.06 | 0.832 |
| Controls (n =18) | ||||||
| NEFA0 | 0.16 | 0.584 | 0.22 | 0.451 | –0.11 | 0.744 |
| Adipo-IR | –0.02 | 0.94 | –0.2 | 0.496 | –0.3 | 0.338 |
| NEFAnadir | 0.52 | 0.057 | 0.5 | 0.067 | –0.59 | 0.045 |
| TIMEnadir | 0.47 | 0.087 | 0.25 | 0.389 | 0.51 | 0.091 |
| %NEFAsup | –0.33 | 0.256 | –0.24 | 0.4 | –0.24 | 0.4 |
P values in italics and bold are considered statistically significant.
Abbreviations: Adipo-IR, adipose-insulin resistance; DHEAS, dehydroepiandrosterone sulfate; NEFA0, basal level of nonesterified fatty acids; NEFAsupp, NEFA suppression; PCOS, polycystic ovary syndrome; T, testosterone.
GLUT-4 expression in adipocytes and relationship to measures of IR in AT
In the subgroup of participants that underwent an sc abdominal AT biopsy, mean levels in GLUT-4 mRNA expression trended lower (by 57%) in the PCOS group compared with the control group, although the difference did not reach significance (94.6 × 10⁻⁵ ± 22.6 × 10⁻⁵ vs 219.9 × 10⁻⁵ ± 60.4 × 10⁻⁵, respectively; P = 0.088; Fig. 2). Adipocyte GLUT-4 mRNA expression correlated positively with %NEFAsupp in the control group (r = 0.91; P = 0.031) but not in the PCOS group, but it demonstrated no association with NEFA0, Adipo-IR, NEFAnadir, or TIMEnadir in either group (43).
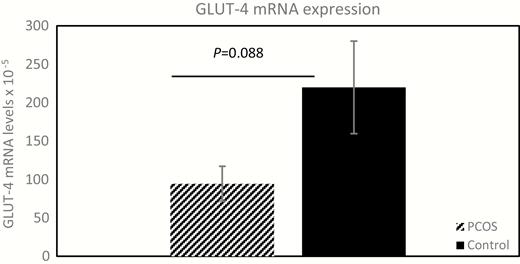
Adipocyte GLUT-4 gene expression in PCOS and controls. The mean ± standard error expression of adipocyte GLUT-4 mRNA, in 5 women without diabetes but with PCOS and 5 matched control participants is depicted and compared (94.6 × 10⁻⁵ ± 22.6 × 10⁻⁵ versus 219.9 × 10⁻⁵ ± 60.4 × 10⁻⁵, respectively; P = 0.088). Relative fold change of GLUT-4 mRNA expression was calculated using the ΔΔCt method. GLUT-4, glucose transporter type 4; mRNA, messenger ribonucleic acid; PCOS, polycystic ovary syndrome.
Discussion
In this study we explored the hypothesis that IR in AT would be greater in reproductive-aged women with PCOS compared with control participants and that elevated IR in AT would be associated with impaired whole-body insulin sensitivity and β-cell dysfunction. We found that, independent of BMI and abdominal adiposity, women with PCOS demonstrated an elevated basal state IR in AT, reflected by higher Adipo-IR values, despite an approximately 3-fold increase in INS0, compared with matched control participants. This finding was substantiated in the dynamic state by the observation that impaired insulin-mediated suppression of plasma NEFA levels, as demonstrated by longer TIMEnadir, higher NEFAnadir, and a trend toward higher NEFAsupp, in the PCOS group relative to the control group.
Our data also indicate that Adipo-IR is closely associated with measures of insulin-mediated NEFA suppression as determined by the mFSIVGTT, confirming Adipo-IR as a useful marker for IR in AT, consistent with the results of prior studies in pediatric (14, 44, 45) and adult (15, 33-37) general populations. These data contrast with the failure of NEFA0 to relate to any of the indices of insulin-mediated NEFA suppression.
Consistent with previous studies, we observed that women with PCOS manifested lower insulin sensitivity (ie, higher HOMA-IR and Si) and evidence of β-cell dysfunction (ie, higher HOMA-β% and lower Di) (3, 6, 46, 47). Elevation in NEFA levels adversely affected insulin sensitivity (17, 18) and β-cell function (19-23). Our results indicate that in both the PCOS and control groups basal state IR in AT (ie, Adipo-IR) was associated positively with basal state whole-body IR (ie, HOMA-IR) and beta-cell function (ie, HOMA-β%). These data suggest that the propensity for a compensatory increase in baseline β-cell function in response to an increase in basal state IR during the postabsorptive (fasting) state is intact in both women with PCOS and healthy individuals. Similar fasting circulating NEFA levels observed between the 2 groups suggest that patients with PCOS were able to maintain normal NEFA levels in the basal state.
Alternatively, and unlike basal state IR in AT, and when challenged, the association of measures of the dynamic state IR in AT (ie, NEFAnadir, TIMEnadir, and %NEFAsupp) with whole-body glucose disposal (ie, Si) was observed in women with PCOS only, suggesting that in women with PCOS, in contrast to healthy individuals, IR in AT in response to glucose loads does play a role in determining whole-body insulin-mediated glucose uptake. Whether this reflects the greater degree of IR in AT in PCOS or a unique mechanism in these women will require further study.
Our results indicate that only in women with PCOS is increasing circulating free T levels (but not total T) associated with increasing degrees of IR in AT (ie, Adipo-IR, NEFA0, and NEFAnadir). This observation is consistent with that of a previous report noting a direct association of free T with Adipo-IR (48). Alternatively, circulating levels of the adrenal androgen metabolite, DHEAS, were negatively associated with some indices of IR in AT (ie, TIMEnadir and NEFAnadir). These data suggest that in the PCOS group, but not in the control group, IR in AT may, in part, be modulated by circulating androgen or androgen metabolite levels. These findings are supported by studies linking androgen activation with metabolic dysfunction in PCOS, including those demonstrating that insulin-mediated activation of the androgen-activating enzyme aldo-ketoreductase type 1 C3 increased AT androgen synthesis and promoted de novo lipogenesis, leading to adipocyte hypertrophy in vitro in SAT adipocytes and suppressed in vivo lipolysis in women with PCOS (49).
Many studies of androgen effect on PCOS adipocytes suggest that androgens have stimulatory effects on lipolysis (50-52). Alternatively, PCOS SAT adipocytes also show evidence of increased lipid accumulation (lipogenesis), including in vitro studies indicating that VAT adipocytes from women with PCOS demonstrated androgen-mediated inhibition of lipolysis (49), resistance to catecholamine-induced lipolysis (53), and increased lipid accumulation in newly formed adipocytes (54), which perhaps explained the observed adipocyte hypertrophy (49, 55). Hypertrophic adipocytes are relatively IR and create a microenvironment characterized by altered adipokine secretion, proinflammatory milieu, and impaired ability to buffer NEFA accompanied by spillover of NEFA into the circulation (56). Furthermore, it was recently shown that women of normal weight with PCOS have VAT adiposity and impaired expansibility of SAT depot as reflected by a high proportion of small SAT adipocytes, which could potentially increase the propensity for NEFA spillover (48, 57).
Insulin is also a proadipogenic hormone, and hyperinsulinemia increases the hepatic uptake of circulating NEFA and enhances de novo synthesis and secretion of very-low-density lipoprotein triglycerides, which in turn reduce high-density lipoprotein cholesterol levels (36, 56, 58), leading to dyslipidemia, which is highly prevalent in women with PCOS (4). Another consequence of increased circulating NEFA is ectopic fat deposition in nonadipose tissues (eg, liver, skeletal and cardiac muscles, pancreas), which promotes synthesis of toxic lipid metabolites that alters insulin signaling and glucose uptake in these tissues, leading to their IR (18). Ectopic fat deposition in the liver (hepatic steatosis) results in nonalcoholic fatty liver disease, which is 2-fold higher in women who are hyperandrogenic with PCOS when compared with control participants, independently of BMI (59).
Our results also suggest that neither circulating total NEFA levels nor insulin-mediated NEFA suppression are associated with dynamic state β-cell function (ie, AIRg and Di) in both the PCOS and control groups, consistent with more recent studies in the general population where C-peptide was used to estimate β-cell function (25). Unlike peripheral insulin sensitivity, it should be noted that the results of studies evaluating the impact of elevated NEFA levels on β-cell function have produced conflicting results (19-25), and most of these studies were based on acute elevation in NEFA levels (19, 20). NEFA comprise different subtypes with varying physiologic functions (23, 24, 52). For example, Kato et al reported that eicosapentaenoate restored the adverse effects of palmitate on β-cell function (24). Therefore, further studies are needed to understand the impact of specific NEFA subtypes on β-cell function in PCOS.
In our study, we did not observe a difference in basal circulating NEFA levels (ie, NEFA0) between the PCOS and control groups, consistent with previous studies (48, 52). While insulin inhibits lipolysis and suppresses circulating NEFA levels (8, 26), androgens promote lipolysis in VAT adipocytes (50-52), potentially increasing circulating NEFA levels. These antagonistic effects of hyperinsulinemia and hyperandrogenemia on lipolysis and AT function (52) may explain, at least in part, why basal NEFA levels differ little between women with PCOS and healthy women.
The lack of association between basal circulating NEFA levels (ie, NEFA0) and whole-body insulin sensitivity (ie, HOMA-IR and Si) in either the PCOS or control groups in our study is consistent with findings during the minimal model of NEFA kinetics whereby NEFA0 did not correlate with the rate of lipolysis (26). It further suggests that the NEFA-mediated modulation of insulin signal pathways in target tissues may, to some extent, be driven by acute changes in NEFA and related factors such as fluxes in insulin and glucose levels similar to what occurs during mFSIVGTT, rather than by basal levels of NEFA per se. This observation is consistent with previous studies in the general population (25).
GLUT-4-mediated adipocyte glucose uptake is crucial for NEFA esterification and lipid packaging in the form of triglyceride within the adipocyte via generation of glycerol-3 phosphate, and for insulin-mediated suppression of lipolysis through lactate generated as a result of GLUT-4-mediated flux through the glycolytic pathway in the fed state (56), and therefore contributes to modulation of circulating NEFA levels. However, the relationship between GLUT-4 gene expression and IR in AT has never been studied. We observed that GLUT- 4 gene expression trended lower compared with matched controls in our small subgroup of women with PCOS that underwent an AT biopsy, consistent with previous findings of reduced adipocyte GLUT-4 mRNA and protein expressions in women with PCOS, by our group (9, 11) and others (47, 60), in studies of larger sample size. Previous studies indicate that adipocyte GLUT-4 mRNA expression reflects GLUT-4 protein abundance and glucose uptake in PCOS (11), that adipocytic GLUT-4 gene expression is a marker of whole-body insulin sensitivity (61, 62), and that reduction in GLUT-4 expression is one of the mechanisms for IR in general (61) and in PCOS (9, 47, 60). The relationship between GLUT-4 expression in adipocytes and whole-body IR may primarily occur via alterations in adipose endocrine functions (61, 62) rather than due to the extent of impaired AT glucose uptake as this only accounts for 10% of whole-body glucose uptake (62, 63).
While the effects of higher circulating NEFA levels on skeletal muscle and hepatic glucose disposal are well known (17, 18), the effects on adipocyte glucose disposal is largely unknown. Our observation of a positive association between GLUT-4 mRNA expression levels with %NEFAsupp in control participants but not participants with PCOS, suggests that a relationship between GLUT-4 gene expression and insulin-mediated regulation of circulating NEFA levels may exist normally and may be altered in participants with PCOS. However, because of the small sample size of this part of our study, further research is required to confirm and expand on this finding.
It is possible that IR in AT could be an early manifestation of metabolic dysfunction in PCOS since NEFA release from AT precedes its deposition at its target sites, and lesser amounts of insulin are typically needed to suppress lipolysis and circulating NEFA levels (half-maximal effective concentration [EC50] ~10 μU/mL) compared with that needed to stimulate muscle glucose uptake (EC50 ~60 μU/mL) (14, 64). Recently, Dumesic et al reported that an Adipo-IR value of 29 pmol/L × mmol/L (ie, 4.2 µIU/L × mmol/L) provided a threshold for discriminating between participants with PCOS and control participants (48). In our population, the proportion of participants with Adipo-IR >29 pmol/L × mmol/L was higher among the PCOS cohort than among the control cohort (55.6% vs 22.2%, respectively; P = 0.0402) (data not shown).
In agreement with our results, in a pilot study of 10 women of normal weight reproductive age with PCOS and 18 control participants, Adipo-IR was found to be greater in the former and correlated with circulating androgens and triglycerides, the percentage of small sc abdominal adipocytes, and mFSIVGTT-derived Si (48). As in our study, in the report by Dumesic et al, NEFA0 did not differ between the PCOS and control groups, while INS0 was higher in the PCOS group. Also similar to the results of our study, in a pilot cross-sectional study assessing 9 girls (aged 8-14 years) with a family history of PCOS and 10 girls without such history, girls with first-degree relatives that had PCOS had impaired insulin sensitivity compared with the girls in the control group, although NEFAsupp was also impaired (65), unlike in our study. A study of 21 adolescent girls with obesity and PCOS (aged 10-17 years) versus 21 participants as matched controls reported that girls with obesity and PCOS had metabolic inflexibility, decreased whole-body insulin sensitivity, and increased IR in AT, associated with the degree of obesity and impaired glucose tolerance (66).
The strengths of our study include assessing not only basal measures of IR in AT (ie, Adipo-IR) but also measuring insulin-mediated NEFA suppression directly using a robust method (mFSIVGTT), comprehensively assessing not only NEFA kinetics but also whole-body insulin-mediated glucose uptake and β-cell function in both basal (static) and dynamic states, and including well-phenotyped and matched participants and control participants. Our study was limited by its cross-sectional nature, which makes it difficult to determine the cause-effect relationship between IR in AT and whole-body metabolic dysfunction. Additionally, since we studied PCOS as defined by the 1990 National Institutes of Health consensus criteria (ie, phenotypes A and B of the Rotterdam criteria) (28) this means that the results of this study cannot be generalized to other phenotypes of PCOS (ie, phenotypes C and D). Furthermore, the number of participants in which we assessed both NEFA kinetics and GLUT-4 mRNA expression was relatively small. Finally, our study is also limited by studying only SAT adipocytes due to the practical difficulties of obtaining VAT adipocytes. Because of significant morphological and functional differences and variations in gene expression between SAT and VAT adipocytes (67, 68), our findings on GLUT-4 expression cannot be immediately extrapolated to VAT adipocytes.
Overall, our results indicate that along with impaired whole-body insulin-mediated glucose uptake and impaired β-cell function, women with PCOS demonstrated evidence of increased IR in AT, which is closely associated with reduced whole-body insulin sensitivity but not with dynamic state insulin secretion (ie, β-cell function) or adipocyte GLUT-4 gene expression. Our data also suggest that Adipo-IR could serve as a valid index for lipolysis dysfunction and IR in AT. The underlying cause of metabolic dysfunction in PCOS appears to be multifactorial, with these women manifesting impaired sensitivity to the effect of insulin on lipolysis in AT, defective whole-body insulin-mediated glucose uptake, and β-cell dysfunction. Further studies are needed to explore the underlying mechanisms for IR in AT and the resulting dysfunction in NEFA kinetics and their role in the development of IR and associated metabolic morbidities in PCOS.
Abbreviations
- Adipo
adipose
- AIRg
acute insulin response to glucose
- AT
adipose tissue
- BMI
body mass index
- CAT
computerized axial tomography
- DHEAS
dehydroepiandrosterone sulfate
- Di
disposition index
- GLUT-4
glucose transporter type 4
- HOMA
homeostasis model of assessment
- INS0
fasting plasma insulin level
- IR
insulin resistance
- IV
intravenous
- mF-G
modified Ferriman-Gallwey
- mFSIVGTT
modified frequently sampled intravenous glucose tolerance test
- mRNA
messenger RNA
- NEFA
nonesterified fatty acids
- NEFA0
basal NEFA level
- NEFAsupp
NEFA suppression
- PCOS
polycystic ovary syndrome
- RNA
ribonucleic acid
- SAT
subcutaneous AT
- sc
subcutaneous
- Sg
glucose effectiveness
- Si
insulin sensitivity index
- T
testosterone
- T2DM
type 2 diabetes mellitus
- TAT
total AT
- VAT
visceral AT
Acknowledgments
Financial Support: This work was supported by Grants 1-K24-HD01346, R01-DK073632, and R01-HD29364 from the National Institutes of Health and an endowment from the Helping Hand of Los Angeles, Inc.
Additional Information
Abbreviations of authors’ names and Disclosure Summary: Abbreviation of authors’ names: Uche Ezeh (U.E.), Ida Y-D Chen (I.Y.D.C.), Yen-Hao Chen (Y.H.C.) and Ricardo Azziz (R.A.). The authors have nothing to declare.
Data Availability: The datasets generated during and/or analyzed during the current study are not publicly available but are available from the corresponding author on reasonable request.
References
Teede HJ, Misso ML, Costello MF, et al. International PCOS Network. Recommendations from the international evidence-based guideline for the assessment and management of polycystic ovary syndrome. Hum Reprod. 2018;33:1602–1618.
Chazenbalk G, Chen Y-H, Heneidi S, et al. Abnormal expression of genes involved in inflammation, lipid metabolism, and Wnt signaling in the adipose tissue of polycystic ovary syndrome. J Clin Endocrinol Metab. 2012;97(5):E765-E770.
