


Abstract
Hypoglycemia attenuates cardiovascular homeostatic autonomic control. This attenuation, known as the cardiovascular component of hypoglycemia-associated autonomic failure (HAAF), is characterized most notably by decreased baroreflex sensitivity (BRS) that begins during hypoglycemia and persists until at least the next day, despite return to euglycemia. Understanding the mechanisms underlying this reduction in BRS is important because BRS attenuation is associated with increased morbidity and mortality.
The objective of this work is to investigate the role of the adrenocorticotropin (ACTH)-adrenal axis in decreasing BRS. We tested the hypothesis that infusion of ACTH 1–24 (cosyntropin), as compared to placebo, would acutely suppress BRS, and that this decrease in BRS would be present the next day.
A double-blind, placebo-controlled, random-order, cross-over study was conducted.
This study took place in a clinical research center.
Participants included healthy men and women.
Interventions included an intravenous infusion of cosyntropin (70 μg/hour for 2.5 hours in the morning and again in the early afternoon) vs normal saline placebo.
Outcome measures included BRS during and 16 hours after cosyntropin vs placebo infusions.
Cosyntropin infusion attenuated BRS (mm Hg/ms) as compared to placebo (baseline 17.8 ± 1.38 vs 17.0 ± 2.07; during 14.4 ± 1.43 vs 17.3 ± 1.65; and next day 14.8 ± 1.42 vs 18.9 ± 2.04; P < .05, time by treatment, analysis of variance). BRS was decreased during the final 30 minutes of the morning cosyntropin infusion as compared to baseline (P < .01) and remained suppressed the next day (16 hours after afternoon infusion) (P < .025). Placebo infusion did not significantly change BRS. Corrected QT interval was not affected.
ACTH attenuates BRS, raising the possibility that hypoglycemia-induced increases in ACTH may contribute to the cardiovascular component of HAAF.
A major limitation to optimal glycemic control in patients with diabetes is the risk of hypoglycemia and subsequent development of hypoglycemia-associated autonomic failure (HAAF). Hypoglycemia is a stress that activates multiple hormonal systems, including the hypothalamic-pituitary-adrenal (HPA) axis, which function to raise blood glucose levels back into the normal range, thus restoring homeostasis. HAAF is defined by compromised metabolic/hormonal and cardiovascular autonomic function (1). The biology of the metabolic component of HAAF is characterized by a blunted hormonal counterregulatory response (eg, glucagon, epinephrine, adrenocorticotropin (ACTH), cortisol, pancreatic polypeptide, growth hormone) and blunted muscle sympathetic nerve activity to a subsequent episode of hypoglycemia (1-5).
The cardiovascular component of HAAF is characterized by hypoglycemia-induced attenuation in autonomic nervous system function in response to a cardiovascular stress (6, 7). Specifically, exposure to hypoglycemia blunts the baroreflex, which is a key mediator of cardiovascular homeostatic control. For example, in response to a decrease in blood pressure, the baroreflex mediates a decrease in vagal activity and an increase in sympathetic activity. These baroreflex-mediated responses increase peripheral vascular resistance, heart rate, and myocardial contractility, which, in concert, restore blood pressure (7, 8). The hypoglycemia-induced decrease in cardiovagal-baroreflex sensitivity (BRS) (R-R interval response to unit changes in blood pressure) starts during hypoglycemia and is still present the next day, 16 hours after return to euglycemia (7). Furthermore, prior exposure to hypoglycemia blunts the baroreflex-mediated increases in muscle sympathetic nerve activity and norepinephrine in response to transient hypotension and a simulated orthostatic challenge using lower-body negative pressure (6). Hypoglycemia activates the HPA axis leading to increases in ACTH, cortisol, and aldosterone. In humans, infusion of ACTH and activation of mineralocorticoid receptors (MRs) and glucocorticoid receptors (GRs) can impair the counterregulatory responses to hypoglycemia (5, 9), but the role of the pituitary-adrenal axis in inducing the cardiovascular component of HAAF is uncertain.
The goal of this study is to determine whether an infusion of ACTH (1-24) (i.e., cosyntropin), which increases cortisol and aldosterone, thus activating GR and MR, attenuates cardiovagal-BRS.
Materials and Methods
This was a double-blinded, placebo-controlled, random-order, cross-over study performed at the Brigham and Women’s Hospital Center for Clinical Investigation (Boston, Massachusetts, USA) (ClinicalTrials.gov NCT02339506). The study protocols were approved by the Partners Healthcare Institutional Review Board. All participants provided written informed consent.
Participants
Healthy men and women, age 18 to 55 years with body mass index of 18 to 32 kg/m2, were recruited using online postings and physical flyers, and underwent initial screening by telephone. Eligible participants then consented and were interviewed during a screening visit at Brigham and Women’s Hospital Center for Clinical Investigation that comprised a complete history and physical exam, blood work, urinalysis, urine pregnancy test (if applicable), and electrocardiogram (ECG). Exclusion criteria included any active medical illnesses, pregnancy, and/or prescription or herbal medication use (including use of steroids within the past 6 months) with the exception of oral contraceptives. Sample size was determined using a power calculation.
Center for clinical investigation study visits
Each participant completed 2 study visits (cosyntropin infusion visit and placebo infusion visit, in random order) with a 1 to 3 month (mean, 1.3 ± 0.15 months) wash-out period between visits (Fig. 1). Participants, study staff, and nursing staff were all blinded to drug treatment. Participants were randomly assigned with equal probability to 1 of 2 sequence groups (cosyntropin then placebo, or placebo then cosyntropin) using a permutated block method. Randomization ratio was 1:1. A biostatistician generated the randomization codes and provided sealed envelopes to the Brigham and Women’s Hospital investigational pharmacy. The research pharmacists did not have study participant contact and did not communicate with study staff regarding assigned treatments. Study staff did not have access to assigned treatments until the unblinding for data analysis.
![Experimental design. Participants completed 2 study conditions (two 2.5-hour infusions of placebo [0.9% saline] and synthetic adrenocorticotropin [1-24] [cosyntropin] 70 µg/hour) in random order with 1 to 3 months between study visits. MO refers to the modified Oxford test for assessing baroreflex sensitivity performed at baseline (before morning infusion), during the morning infusion (between 2 and 2.5 hours after start of morning infusion), and the following day (24 hours after baseline measures on day 1 and 16 hours after completion of the second infusion on day 1).](https://oup.silverchair-cdn.com/oup/backfile/Content_public/Journal/jcem/105/7/10.1210_clinem_dgaa221/4/m_jcem_105_7_2345_f1.jpeg?Expires=1749946705&Signature=NXlSU6KH2rMQWENYO6X62rpLdyqsajJJxIDPOovuXQrU0O5zruxtFghcAGcJB07JYAiLyXW3a78ceHj0xAhagkxWm2napLUO0IW3UQ137yUHaLReOCisFTPNYqQw3Vebpxmtxr71ooToMUBRjnN6RqaMQHUDwcfRfsn5DM2z3efgXOzxGTTumgraDwtu22Pr7Qsjoo9hPodSHlGryKdbfAerh9OzNoML5XIjYA0kcjeoMNzFHlfRPoT51abdl4DI2rsR2pmGNHma9ygsbITItAcKsNxbm~y1qtRMMoZ34gVnr12Ozp4rcDMhKutVV7flN21QnrsI9yti0fwbS2hzkw__&Key-Pair-Id=APKAIE5G5CRDK6RD3PGA)
Experimental design. Participants completed 2 study conditions (two 2.5-hour infusions of placebo [0.9% saline] and synthetic adrenocorticotropin [1-24] [cosyntropin] 70 µg/hour) in random order with 1 to 3 months between study visits. MO refers to the modified Oxford test for assessing baroreflex sensitivity performed at baseline (before morning infusion), during the morning infusion (between 2 and 2.5 hours after start of morning infusion), and the following day (24 hours after baseline measures on day 1 and 16 hours after completion of the second infusion on day 1).
For 1 week prior to each of the two 3-day/2-night inpatient visits at the Center for Clinical Investigation, participants were asked to abstain from alcohol, caffeine, and excessive exercise, and to consume their normal ad lib diet with the addition of 2 bouillon packets per day to ensure high sodium balance. Consumption of a high-sodium diet standardizes effects on endogenous aldosterone secretion and ensures normal intravascular volume. Participants’ dietary adherence was confirmed by 24-hour urine collections during the study visit. On both study days, procedures were initiated after participants had fasted and had been supine overnight from midnight onward. An intravenous line was placed in an antecubital vein for infusion of study medications. A second intravenous line was placed retrograde into a hand or wrist vein to allow for withdrawing blood samples throughout the infusions. This hand was warmed by placing the hand in a heated (66 °C [150 °F]) acrylic box to arterialize the venous blood (10). Blood samples for cortisol and aldosterone were drawn via the indwelling intravenous catheter. Cortisol was assessed at baseline, immediately prior to the start of each infusion, at 30- to 45-minute intervals during the infusions, and the next morning (24 hours after the baseline blood draws and approximately 16 hours after the end of the second infusion) (see Fig. 1).
Adrenocorticotropin/Placebo infusion
On day 1, participants were randomly assigned to receive either two 2.5-hour infusions of 0.9% normal saline or two 2.5-hour infusions of cosyntropin (ACTH [1-24], 70 µg/hour, Sandoz Pharmaceuticals); the alternate drug was infused on the second admission. The first 2.5-hour infusion was administered in the morning, with the second 2.5-hour infusion being administered in the afternoon, 90 minutes after the completion of the first infusion. The 2 sessions of infusions were designed to parallel prior studies, which used two 2- to 2.5-hour periods of hypoglycemia or pharmacologic stress hormone infusions (3, 6, 9). The cosyntropin infusion rate of 70 µg/hour was chosen to attain hypercortisolemia (serum cortisol 25-30 µg/dL [690 nmol/L-828 nmol/L]) during the intrainfusion BRS testing similar to that achieved during mild hypoglycemia (3, 11).
Between infusions, participants received 0.45% normal saline to maintain vascular access and were given a 30-minute period immediately following the completion of the first infusion to eat breakfast while in bed with the head of the bed raised, before returning supine for 1 hour prior to the start of the second infusion. Participants were allowed to rise after the second infusion, eat and ambulate ad lib until midnight, when they again began fasting and lying supine until study procedures were finished the next morning.
Modified Oxford procedure for baroreflex sensitivity measurement
BRS was measured in duplicate using the modified Oxford procedure, as previously described (6), at 3 time points: 1) at baseline (prior to initiation of the cosyntropin/placebo infusion); 2) during the last 30 minutes of the 2.5-hour morning infusion; and 3) the next morning, 24 hours after the start of the first infusion and approximately 16 hours after the second infusion ended. These time points were chosen to replicate the study designs in which we showed that BRS is attenuated during the last 30 minutes of a 2.5-hour hypoglycemic clamp (7) and 16 hours after exposure to a morning and afternoon hypoglycemic clamp (6). Each assessment of autonomic function consisted of a modified Oxford procedure and 12-lead ECG to assess QT interval. The modified Oxford assesses the change in systolic blood pressure (SBP) and heart rate over time induced by sequential boluses of a vasodilator (nitroglycerin) (American Regent) followed 1 minute later by a vasoconstrictor (150 µg phenylephrine hydrochloride) (Westward Pharmaceuticals). The sequential administration of these agents produces a drop in SBP of approximately 15 mm Hg followed by a rise above baseline of approximately 15 mm Hg, with resultant increases and subsequent decreases in heart rate mediated by the baroreflex. To identify the nitroglycerin dose for the modified Oxford for each participant, a titration was performed before the first baseline modified Oxford to find the lowest dose between 50 and 200 µg (in 50-µg increments) that would produce a 15 mm Hg SBP decrease. This nitroglycerin dose was used for all modified Oxford procedures during that visit. The median nitroglycerin dose needed to achieve an SBP decrease of 15 mm Hg was 100 µg.
A Finometer was used to noninvasively record beat-to-beat changes in blood pressure and heart rate (Finometer, Finapres Medical Systems BV). After a 10-minute rest, the modified Oxford was repeated. BRS was calculated from the change in heart rate (R-R interval) relative to the change in SBP after administration of phenylephrine. The final BRS value was the average of the 2 (where available) BRS measurements at each time point. Four trained personnel came to consensus as to whether individual modified Oxford results were reliable and of good quality; in all, 11% of the runs were removed from analysis. All BRS data evaluation was performed prior to unblinding.
Laboratory analysis
Serum cortisol, aldosterone, basic metabolic panel, complete blood count, and urine sodium and pregnancy testing were measured using standard CLIA (Clinical Laboratory Improvement Amendments) certified laboratory techniques.
Statistical analysis
Statistical data analyses were performed using SPSS software (IBM Corp, version 26). The primary outcome was the effect of cosyntropin vs placebo infusion on BRS acutely and 16 hours later. Secondary outcomes were the effects of cosyntropin vs placebo infusion on cortisol, aldosterone, and electrolytes as well as on corrected QT interval (QTc). Data were analyzed using multiple analyses of variance (ANOVAs) with repeated measures (general linear model) to compare time by treatment (cosyntropin and placebo infusions) effects. General pairwise comparisons to analyze the effects of time were assessed using the Bonferroni method. One individual was removed from the aldosterone analysis only because of aldosterone levels greater than 3 SDs from the mean. Data are expressed in mean ± SE. P values of less than .05 were considered significant.
Results
Clinical characteristics and baseline biochemical characteristics
Seventeen healthy individuals (9 men, 8 women; mean age, 31 ± 2.8 years) completed both treatment arms of the study and were included in the analysis (Fig. 2: Participant flow diagram). One additional participant completed both arms but was not included in the analysis because BRS data were not acquired. Demographics and baseline characteristics of the 17 participants are shown in Table 1. There were no significant harms or unintended effects with either treatment. The period of recruitment spanned March 2015 through March 2016.
Participant demographics and characteristics at screening (n = 17)
| Age, y | 31 ± 3 |
|---|---|
| Sex, self-identified | 47% female, 53% male |
| Race, self-identified | 6% Asian, 23% black, 71% white |
| Latino or Hispanic | 12% |
| BMI, kg/m2 | 23.6 ± 0.8 |
| Systolic blood pressure, mm Hg | 116 ± 1 |
| Diastolic blood pressure, mm Hg | 70 ± 1 |
| Heart rate, bpm | 79 ± 2 |
Data are in mean or percentage ± SEM.
Abbreviations: BMI, body mass index; bpm, beats per minute.
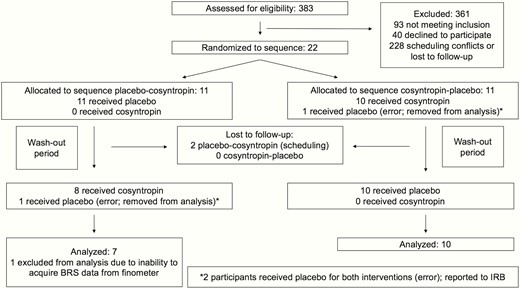
Participant flow diagram.
Effect of cosyntropin infusion on cortisol, aldosterone, and electrolyte levels
Baseline serum cortisol levels were similar on the cosyntropin and placebo study days (319.6 ± 18.42 nmol/L vs 322.7 ± 26.65 nmol/L, P = .912). Cosyntropin infusion increased serum cortisol compared to placebo infusion (Fig. 3, P < .001, time by treatment, ANOVA), reaching cortisol levels of 836.1 ± 25.47 nmol/L and 1017.8 ± 42.21 nmol/L at the end of the morning and afternoon infusions, respectively. Consistent with the diurnal variation in cortisol, serum cortisol decreased throughout the day during the placebo infusions. No significant differences were observed between cortisol levels obtained at baseline and 24 hours later for either cosyntropin or placebo infusions (cortisol at 24 hours: 245.1 ± 25.25 nmol/L postcosyntropin and 275.6 ± 24.87 nmol/L postplacebo infusions, P = .500).
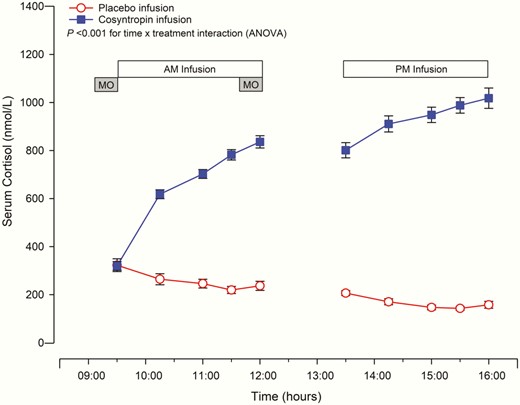
Cortisol levels during cosyntropin and placebo infusions.
Cosyntropin infusion significantly increased serum cortisol levels compared to placebo infusion, P less than .001 time × treatment interaction (analysis of variance, ANOVA). Mean ± SEM are displayed, n = 16. Circles denote placebo and squares cosyntropin infusion. MO refers to the modified Oxford technique.
Baseline serum aldosterone levels were similar in the 2 arms (217.8 ± 21.49 pmol/L for baseline cosyntropin and 238.6 ± 24.07 pmol/L for baseline placebo, P = .27). Infusion of cosyntropin significantly increased aldosterone as compared to placebo infusion (P < .001, time by treatment, ANOVA), with aldosterone increasing to 543.3 ± 45.70 pmol/L and 597.4 ± 48.86 pmol/L at the end of the morning and afternoon cosyntropin infusions, respectively. Aldosterone decreased to 208.5 ± 25.48 pmol/L and 182.0 ± 20.32 pmol/L at the end of the morning and afternoon placebo infusions, respectively, consistent with the diurnal variation in aldosterone, P < .01. No significant differences were observed between aldosterone levels obtained at baseline and 24 hours later for either cosyntropin or placebo infusions (next-day aldosterone:179.4 ± 27.30 pmol/L postcosyntropin and 244.3 ± 30.68 pmol/L postplacebo infusions, P = .098).
Electrolytes were measured at baseline, the end of the morning infusion, and the next day. Serum sodium was not significantly affected by either the cosyntropin or placebo infusions (P = .123, time by treatment, ANOVA). Similarly, serum potassium obtained at the end of the morning infusion was not affected by either infusion; however, the next-day serum potassium was significantly lower after the cosyntropin as compared with placebo infusions (3.9 ± 0.03 mmol/L vs 4.4 ± 0.07 mmol/L, P < .001).
Effect of cosyntropin infusion on baroreflex sensitivity
At baseline, blood pressure, heart rate, and BRS were similar on the cosyntropin and placebo days (Table 2). Cosyntropin infusion significantly decreased BRS compared to placebo infusion (see Table 2, P < .05, time by treatment, ANOVA) (Fig. 4). During the final 30 minutes of the morning cosyntropin infusion, BRS was significantly decreased compared to baseline, P = .008. This decrease in BRS was still present the following day (16 hours after completion of the afternoon infusion), P = .022. Placebo infusion did not lead to significant alterations in BRS either during the infusion or the following day. SBP threshold, SBP saturation, and R-R interval range were similar with the cosyntropin and placebo infusions. Fig. 5 is a representative participant showing the effect of cosyntropin infusion compared to baseline (preinfusion) on BRS slope.
Effect of cosyntropin and placebo infusions on baroreflex sensitivity and hemodynamic measures obtained during modified Oxford and on QT interval measured before each modified Oxford
| Cosyntropin infusion | Placebo infusion | |||||
|---|---|---|---|---|---|---|
| Baseline | During AM infusion | Next day | Baseline | During AM infusion | Next day | |
| SBP, mm Hg | ||||||
| Minimum | 111 ± 3.5 | 113 ± 1.9 | 113 ± 3.1 | 109 ± 3.1 | 109 ± 3.1 | 109 ± 3.1 |
| Maximum | 137 ± 4.5 | 142 ± 3.5 | 142 ± 4.3 | 140 ± 3.7 | 137 ± 3.7 | 134 ± 4.7 |
| R-R interval, ms | ||||||
| Minimum | 796 ± 39.3 | 785 ± 32.7 | 816 ± 31.2 | 783 ± 25.1 | 778 ± 32.1 | 816 ± 26.9 |
| Maximum | 1304 ± 54.8 | 1245 ± 48.5 | 1292 ± 53.7 | 1354 ± 65.3 | 1317 ± 56.2 | 1312 ± 53.6 |
| Range | 508 ± 41.0 | 460 ± 33.7 | 476 ± 47.2 | 571 ± 54.0 | 539 ± 48.9 | 496 ± 49.0 |
| BRS, mm Hg/ms | 17.8 ± 1.38 | 14.4 ± 1.43a,b | 14.8 ± 1.42a,c | 17.0 ± 2.07 | 17.3 ± 1.65 | 18.9 ± 2.04 |
| QTc, ms | 409 ± 6.2 | 409 ± 6.8 | 409 ± 5.8 | 408 ± 5.6 | 411 ± 6.8 | 405 ± 5.9 |
Data are mean ± SEM.
Abbreviations: am, morning; BRS, baroreflex sensitivity; SBP, systolic blood pressure; QTc, corrected QT interval.
a P less than .05 cosyntropin vs placebo infusion, time × treatment interaction (analysis of variance).
b P equal to .008 cosyntropin vs baseline (preinfusion) (post hoc t test, Bonferroni-corrected).
c P equal to .022 cosyntropin vs baseline (preinfusion) (post hoc t test, Bonferroni-corrected).
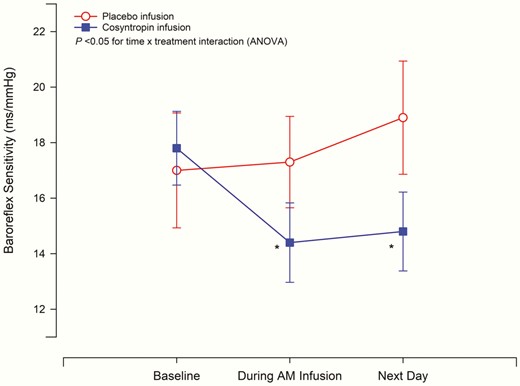
Effect of cosyntropin and placebo infusion on baroreflex sensitivity. Baroreflex sensitivity (BRS) was measured by the modified Oxford method at baseline (preinfusion), during the morning infusion (between 2 and 2.5 hours after start of morning infusion) and the following day (24 hours after baseline measures on day 1). Cosyntropin infusion significantly decreased BRS as compared to placebo, P less than .05 time × treatment interaction (analysis of variance, ANOVA). Cosyntropin infusion decreased BRS during morning infusion and the next day compared to baseline (preinfusion), *P less than .05. Placebo infusion did not alter BRS. Mean ± SEM are displayed, n = 17. Circles denote placebo and squares denote cosyntropin infusion.
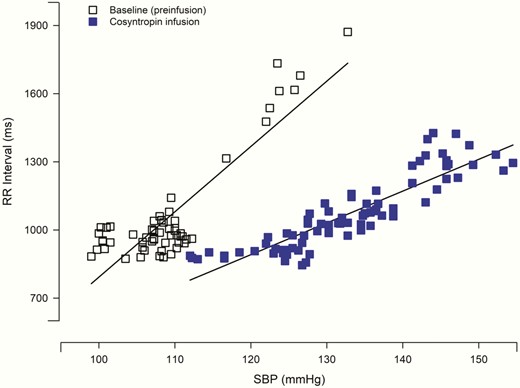
Baroreflex sensitivity of representative participant during modified Oxford technique. Baroreflex sensitivity is represented by the slope of the relationship between systolic blood pressure (SBP) and R-R interval. Data from a single individual displays a decrease in the linear relationship during the morning cosyntropin infusion compared to baseline (preinfusion) the same day. Solid squares denote cosyntropin and open squares denote baseline (preinfusion).
Effect on corrected QT interval
QTc was measured using a 12-lead ECG at baseline before the morning infusion, during the morning infusion, and the next day (16 hours following the completion of the afternoon infusion). There were no significant differences in QTc length during cosyntropin infusion as compared to placebo (see Table 2, P = .083, time by treatment, ANOVA). Similarly, there were no significant differences between the 2 treatments the next day (16 hours after the end of the afternoon infusion) as compared to baseline measures, P = .246. Mean QTc length at baseline, during the infusion, and the next day are shown in Table 2.
Discussion
In this study we show that an infusion of cosyntropin, which increases endogenous cortisol and aldosterone, suppresses BRS acutely and maintains this suppression until the following day. This result implicates the pituitary-adrenal axis in the pathophysiology of stress-induced impairment in cardiovascular function. Thus, our results may be relevant in understanding the changes in autonomic function provoked by stressors that increase ACTH, including hypoglycemia.
We previously demonstrated that exposure to insulin-induced hypoglycemia (serum glucose level of 50 mg/dL) for 2 hours suppresses BRS (7). In addition, we demonstrated that exposure to 2 episodes of hypoglycemia (50 mg/dL for 90 minutes in the morning and in the afternoon) leads to a reduction in BRS the next day (16 hours later) when participants are euglycemic (6). These reported findings on BRS attenuation by hypoglycemia have led to an expansion of the definition of HAAF to include both metabolic and cardiovascular components (1). The present data introduce a potential mechanism for the biological basis of the cardiovascular component of HAAF.
Activation of the HPA axis is a key component of the homeostatic response to stress. Stress increases the hypothalamic peptides corticotropin-releasing hormone (CRH) and arginine vasopressin, which stimulate pituitary release of ACTH (12). ACTH then increases cortisol and aldosterone production by the adrenal glands. The increases in cortisol, aldosterone, and ACTH feed back to inhibit the activity of the HPA axis (13). Aldosterone is a selective MR activator. Cortisol is selective for GR at lower cortisol concentrations because 11 beta-hydroxysteroid dehydrogenase 2 (11β-HSD2) protects the MR by converting cortisol to the inactive cortisone. However, at higher cortisol concentrations, the enzymatic capacity of 11β-HSD2 to fully inactivate cortisol is exceeded, and unmetabolized cortisol can then also activate the MR (14, 15). The GR and MR stimulate multiple physiologic processes that are vital to restoring homeostasis after stress (14, 16-18).
Hypoglycemia increases ACTH, cortisol, and aldosterone. In humans, infusion of ACTH induces components of metabolic HAAF (5), for example, reducing the epinephrine, norepinephrine, and growth hormone response to hypoglycemia. Expanding on this research, we tested the hypothesis that an ACTH infusion would suppress BRS, a key component of the cardiovascular component of HAAF. We demonstrated that an ACTH infusion, which increased cortisol and aldosterone to levels observed during hypoglycemia (9), suppressed BRS, and this suppression was still apparent the next day, long after serum steroid levels normalized. Thus, an ACTH infusion, like hypoglycemia, acutely decreases BRS and leads to continued attenuation to the next day. This suggests that activation of the HPA axis contributes to the cardiovascular component of HAAF.
The mechanisms responsible for the reduction in BRS seen in our study are not fully elucidated. Infusion of ACTH will suppress endogenous CRH (19, 20), and CRH via the CRH type 1 receptor has been shown to modulate downstream autonomic signaling (21, 22). Further, some (3, 23, 24) though not all (25, 26) studies in humans, sheep, and dogs show that corticosteroid infusion contributes to the metabolic component of HAAF. Studies specifically examining the role of the GR and MR in humans show that activation of either of these receptors induces components of metabolic HAAF (9). Thus, within the HPA axis, GR, MR, ACTH, and/or CRH could be contributing to HAAF. Which of these factors predominates in the cardiovascular component of HAAF and whether the mechanisms involved in the metabolic and cardiovascular components of HAAF are similar will be important questions to address in future studies.
The observation that ACTH impairs BRS raises the possibility that any stress activating ACTH could lead to a cardiovascular autonomic failure analogous to the cardiovascular component of HAAF. This may have clinical importance for individuals undergoing a variety of physical stresses (eg, stress associated with an intensive care unit admission or long surgical procedure) as well as psychological stress. For example, reduced BRS has been associated with acute psychological stress, a known HPA axis activator, such as acute mental stress (27-29) and increased anxiety (30). Physical stresses that are known to increase adrenal steroidogenesis (31-33) have also been associated with reduced BRS, including hypoglycemia (6, 7), smoking (34), obstructive sleep apnea (35), and alcohol withdrawal (36). Our present study suggests that stress-induced activation of the HPA axis could be an explanation for this BRS reduction.
The group mean value of BRS shows a significant albeit modest change in BRS (–3.33 ± 3.86 ms/mm Hg) with ACTH; however, marked variability exists across study participants. In half the participants, the BRS decreased by more than 20% (4 ms/mm Hg) with ACTH and in a third of the participants the reduction was more than 35% (6 ms/mm Hg). The decrease in BRS in these individuals could have greater physiological implications. For example, in the participant who had a decrease in BRS from approximately 15 ms/minute at baseline to approximately 9 ms/minute with ACTH, a 40 mm Hg blood pressure decrease would cause a compensatory increase in heart rate by 25 beats/minute at baseline, but only 12 beats/minute after ACTH. Because heart rate is an important hemodynamic factor in blood pressure homeostasis, the blunted heart rate response to a blood pressure change may impair the response to a hemodynamic stress.
BRS reduction has several other clinical consequences. Reduced BRS leads to attenuated cardiac-vagal tone, which is proarrhythmogenic, and decreases in BRS are associated with increased risk of cardiac arrhythmias (37). Also, decreased BRS is associated with increased cardiovascular risk in heart failure patients (38) and increased mortality in individuals with cardiovascular disease, hypertension, or diabetes (39, 40). Furthermore, in the postmyocardial infarction setting, decreases in BRS predict worse outcomes independent of left ventricular ejection fracture or ventricular arrhythmias (41), and baroreflex dysfunction after major surgery is associated with excess postoperative morbidity (42).
Exposure to hypoglycemia leads to prolongations in QTc, which is another potential mechanism of hypoglycemia-associated arrhythmogenesis and mortality (43, 44). The cosyntropin infusion did not affect QTc, suggesting that the mechanisms for modulating QTc and BRS differ and that the pituitary-adrenal axis does not mediate changes in QTc.
As discussed earlier, because ACTH increases both cortisol and aldosterone, the present study does not determine whether the decrease in BRS is mediated by the MR, GR, ACTH receptor, and/or CRH type 1 receptor. The MR is implicated by a study showing acute BRS suppression with an aldosterone infusion in healthy men (45); however, that study did not assess the effects of aldosterone on BRS the following day. Hydrocortisone has also been reported to suppress BRS, but that study induced supraphysiologic levels of cortisol (~96 µg/dL, ~2640 nmol/L) (46), making its physiologic relevance less certain. Further, this high level of cortisol would be expected to activate both GR and MR. Thus, future studies are still needed to define the relative contributions of the GR and MR on BRS reduction, as well as possible contributions of ACTH, CRH, and other factors. Two 2.5-hour infusions of ACTH at 70 µg/hour induced levels of aldosterone and cortisol typical of the response to hypoglycemia, making the applicability of our findings to the physiology of stress more relevant. Although the present study does not establish the full duration of ACTH-induced BRS suppression, it is the first study to examine both acute and next-day effects.
A possible limitation of this study is that we studied a relatively small number of men and women, all of whom were healthy. However, we hypothesize that the same physiology will hold true in other populations, such as patients with diabetes.
In conclusion, a cosyntropin infusion causing endogenous hypercortisolemia and hyperaldosteronemia resulted in acute and next-day suppression of cardiovagal autonomic control. This suppression in BRS parallels that seen in experimental models of cardiovascular HAAF, during which BRS decreases in response to ongoing hypoglycemia as well as antecedent hypoglycemia. Thus, these studies raise the possibility that hypoglycemia-induced activation of the pituitary-adrenal axis mediates the cardiovascular component of HAAF. Finally, these studies raise the possibility that any potent or prolonged stress leading to increases in ACTH could alter cardiovascular autonomic function.
Abbreviations
- 11β-HSD2
11 beta-hydroxysteroid dehydrogenase 2
- ACTH
adrenocorticotropin
- BRS
baroreflex sensitivity
- CRH
corticotropin-releasing hormone;
- GR
glucocorticoid receptor
- HAAF
hypoglycemia-associated autonomic failure
- HPA
hypothalamic-pituitary-adrenal
- MR
mineralocorticoid receptor
- SBP
systolic blood pressure.
Acknowledgments
Financial Support: This work was supported by the National Institutes of Health (NIH) (Endocrinology Fellowship Training Grant T32 HL 7609-28 to J.H.L.; NIH R01 HL 01025319 to R.F.) (NIH K24 HL 103845 to G.K.A.); Harvard Catalyst, The Harvard Clinical and Translational Science Center (supported by National Center for Advancing Translational Sciences, NIH Award UL1 TR001102 and financial contributions from Harvard University and its affiliated academic health-care centers). The content is solely the responsibility of the authors and does not necessarily represent the official views of Harvard Catalyst, Harvard University and its affiliated academic health-care centers, or the NIH.
Clinical Trial Registration: This trial has been registered at clinicaltrials.gov as NCT02339506 (randomized, crossover clinical trial).
Author Contributions: J.H.L., R.F., and G.K.A. conceived the idea. O.F.B. coordinated the study and recruited the participants. J.H.L. and O.F.B. conducted the study. J.H.L., O.F.B., J.C., I.B., J.W., R.F., and G.K.A. performed data analysis and interpretation. J.H.L., O.F.B., R.F. and G.K.A. wrote the manuscript; I.B., J.C., and J.W. helped with manuscript preparation. R.F. and G.K.A. are the guarantors of this work, and, as such, had full access to all the data in the study and take responsibility for the integrity of the data and the accuracy of the data analysis. J.H.L. and O.F. B. contributed equally and share co-first authorship. R.F. and G.K.A. contributed equally and share co-senior authorship.
Additional Information
Disclosure Summary: The authors have nothing to disclose.
Data Availability: The datasets generated during and/or analyzed during the current study are not publicly available but are available from the corresponding author on reasonable request.
References
Author notes
J.H.L. and O.F.B. and
R.F. and G.K.A. contributed equally to this work.
